My Account     Contact Us     Cart

MAPublisher Dot Density Maps

Dot density themes are sometimes called dot distribution maps because they show where particular data characteristics occur. It uses dots or other symbols to represent the number of occurrences of a given data characteristic in a particular location. Starting at MAPublisher 8.4, the ability to create dot density maps is available through the provision of Dot Density Themes.

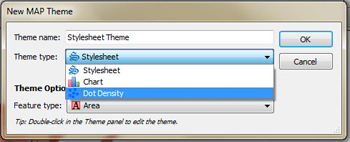
When creating a new MAP Theme simply choose “Dot Density” from the available theme types. The creation of a dot density theme is facilitated through the MAP Themes panel. The dot density theme is an Adobe Illustrator effect applied to an area layer.

Item 2: Coordinate system of the map

As dot density maps are most useful for showing where particular data occur, they may only be generated for MAP Area type layers. Most often, symbols are used to represent data occurring within a bounding polygon such as a census tract, zip code or county polygons.

Item 2: Coordinate system of the map

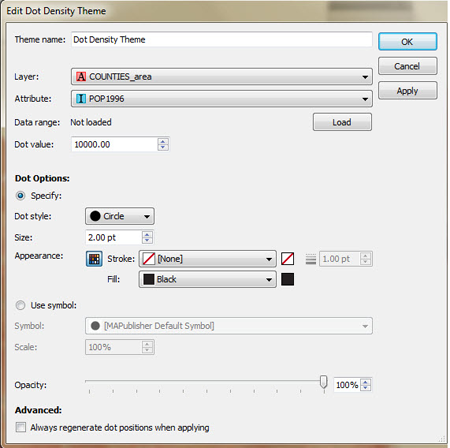
Dot density effects are created on a per layer basis, based on various user defined settings. Data ranges can be determined from selected attribute columns and then a dot value can be assigned a corresponding symbol at which point MAPublisher will map the appropriate results. Users may apply default symbols or load custom ones based on Illustrator symbol sets

In this example, population tallies per county have been loaded, assigned a dot value of 10,000 with a designated symbol of a 2pt black dot.

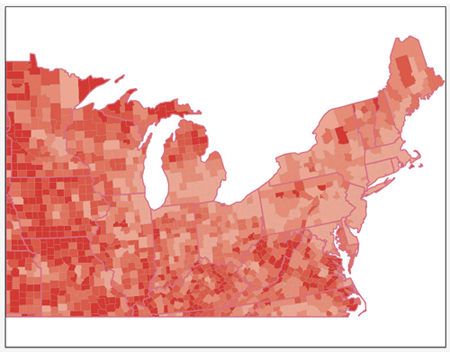
This screenshot displays the map prior to applying the dot density effect.

Item 2: Coordinate system of the map

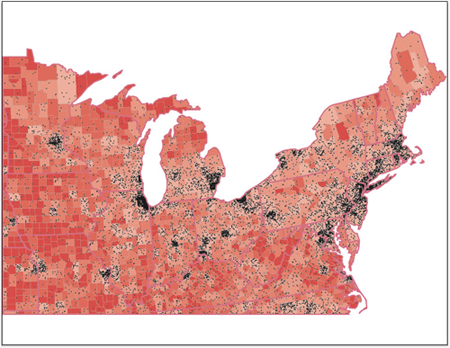
The screenshot below displays the map after having applied the Dot Density Theme using the parameters displayed within the dialog .

Item 2: Coordinate system of the map


Leave a Reply


Blog Archive

March 2024 (2)
February 2024 (1)
January 2024 (1)
December 2023 (1)
November 2023 (2)
October 2023 (2)
September 2023 (1)
August 2023 (1)
July 2023 (3)
June 2023 (1)
February 2023 (1)
January 2023 (2)
December 2022 (1)
November 2022 (2)
October 2022 (2)
September 2022 (1)
May 2023 (1)
August 2022 (3)
July 2022 (1)
June 2022 (2)
May 2022 (1)
February 2022 (1)
January 2022 (2)
December 2021 (3)
November 2021 (5)
October 2021 (1)
September 2021 (3)
August 2021 (2)
July 2021 (1)
June 2021 (2)
May 2021 (2)
April 2021 (3)
March 2021 (3)
February 2021 (2)
January 2021 (1)
November 2020 (1)
October 2020 (1)
June 2020 (2)
May 2020 (1)
April 2020 (3)
March 2020 (2)
December 2019 (1)
November 2019 (2)
September 2019 (1)
August 2019 (1)
July 2019 (1)
June 2019 (3)
May 2019 (4)
April 2019 (2)
March 2019 (1)
February 2019 (2)
January 2019 (3)
December 2018 (2)
November 2018 (1)
October 2018 (1)
September 2018 (2)
August 2018 (4)
July 2018 (2)
June 2018 (1)
July 2018 (1)
June 2018 (4)
May 2018 (1)
April 2018 (2)
March 2018 (5)
February 2018 (1)
January 2018 (1)
November 2017 (1)
October 2017 (2)
August 2017 (2)
July 2017 (1)
March 2017 (1)
February 2017 (2)
January 2017 (2)
November 2016 (1)
January 2017 (1)
November 2016 (1)
October 2016 (2)
May 2016 (1)
April 2016 (2)
December 2015 (2)
June 2015 (1)
May 2015 (1)
April 2015 (2)
December 2014 (4)
October 2014 (2)
May 2014 (4)
February 2014 (1)
October 2013 (3)
April 2013 (1)
January 2013 (2)
August 2012 (1)
October 2012 (1)
July 2012 (3)
May 2012 (2)
January 2012 (2)
August 2011 (1)
July 2011 (2)
June 2011 (2)
May 2011 (2)
March 2011 (1)
February 2011 (1)
January 2011 (5)
December 2010 (1)
November 2010 (1)
December 2010 (1)
November 2010 (1)
October 2010 (1)
August 2010 (4)
July 2010 (2)
June 2010 (3)
May 2010 (2)
April 2010 (2)
March 2010 (2)

Search