Hosted by Safe Software Wednesday, November 30, 2022 10:00am to 11:00am EST
FME Auto is a powerful add-on that connects the GIS data processing environment of FME Desktop to the cartographic design and publishing environment of MAPublisher and Adobe Illustrator. We’ll be appearing at this educational webinar hosted by Safe Software (creator of FME) about harnessing the power of this add-on to automate several of your cartographic processes. Nick Burchell from the Avenza team will be joining Hans van der Maarel from Red Geographics and Mark Ireland from Safe Software to demonstrate how FME shines as part of a high-end map production workflow. During the hour, you’ll be walked through:
An overview of MAPublisher’s extensive cartographic capabilities
An overview of FME and its basic cartographic capabilities, including the Illustrator format writer
How MAPublisher integrates FME with Adobe Illustrator directly
The power of automation to achieve faster map production
Sign up here if you are interested in learning more!
Tomorrow is November 1st, which means it’s time to start another year of the #30DayMapChallenge! The challenge is a Twitter-based daily map challenge which involves posting a map that suits the daily theme each day and tagging it with the hashtag #30DayMapChallenge. It was first started by Topi Tjukanov in 2019 and has been growing in popularity ever since. In 2021, the challenge ended up with over 9,000 submitted maps!
The daily themes for the challenge are posted in early October each year, giving participants about a month to get a head start on planning some of their maps. Some examples of daily themes include maps that show colours, hexagons, fantasy, or islands. Some of the themes also function as a challenge, such as creating a “bad” map, the 5 minute map challenge, as well as a map that is created using new tools outside of your comfort zone.
This year, we’ll be sharing some of our own maps created by Avenza employees, and highlighting some on-theme maps from the Avenza Map Store! We’re looking forward to seeing all of the interesting and innovative maps floating around the #30DayMapChallenge hashtag on Twitter. Remember, participants can post as many or as few maps as they wish. At the end of the day, it comes down to engaging in the ever growing community of cartography-lovers.
We’ll see you on Twitter tomorrow for the Day 1 theme: points! Happy mapping!
For more information about the #30DayMapChallenge – including the 2022 daily themes, visit the official website or check out the GitHub repository!
Today we are shifting the spotlight to Geographic Imager, our plugin for Adobe Photoshop. This blog features the usage of the Terrain Shader tool, which was featured in our promotional video at the Adobe MAX conference last week!
Terrain Shader is great for adding dimension to your maps. It is commonly used to perform shaded relief, a method for representing topography on maps in a natural and intuitive way. The tool provides options to apply colourization schema and shaded relief to supported elevation data formats, such as DEM or SRTM files. Terrain Shader has several different settings that users can customize to create a shaded relief that best suits their needs.
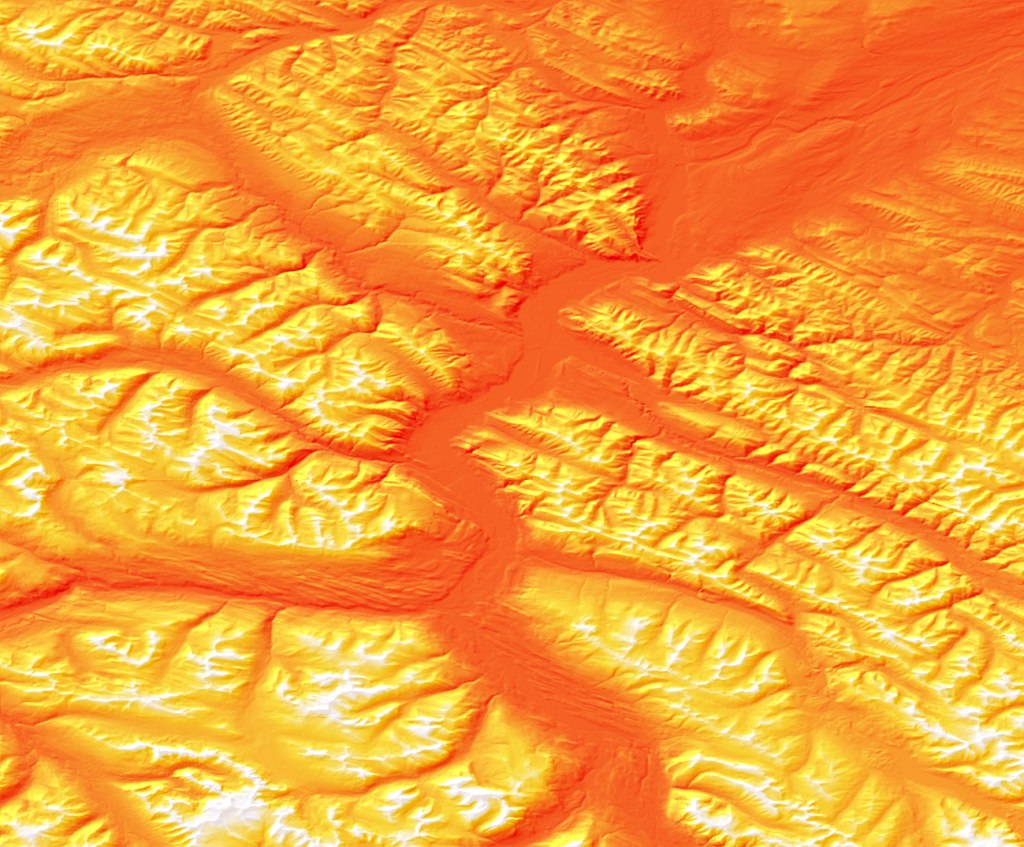
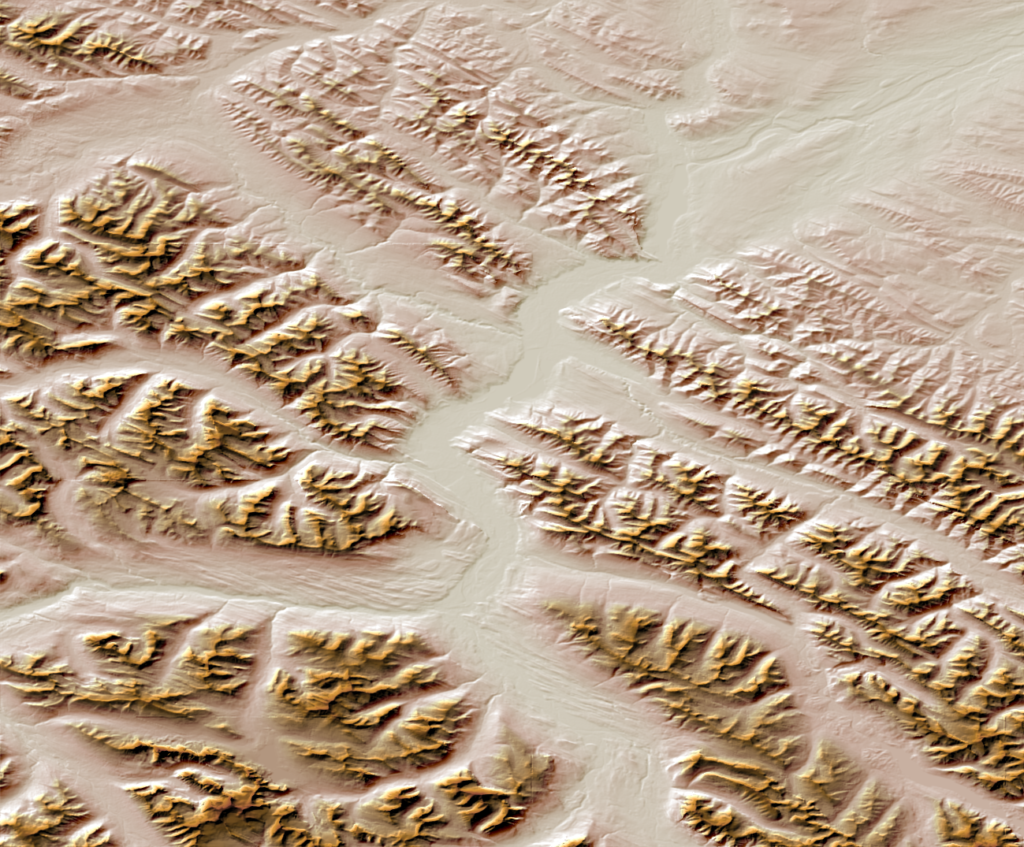
In the spirit of Halloween, we’ve decided to show off the Terrain Shader tool by creating a fun shaded relief using a colourization schema that resembles candy corn!
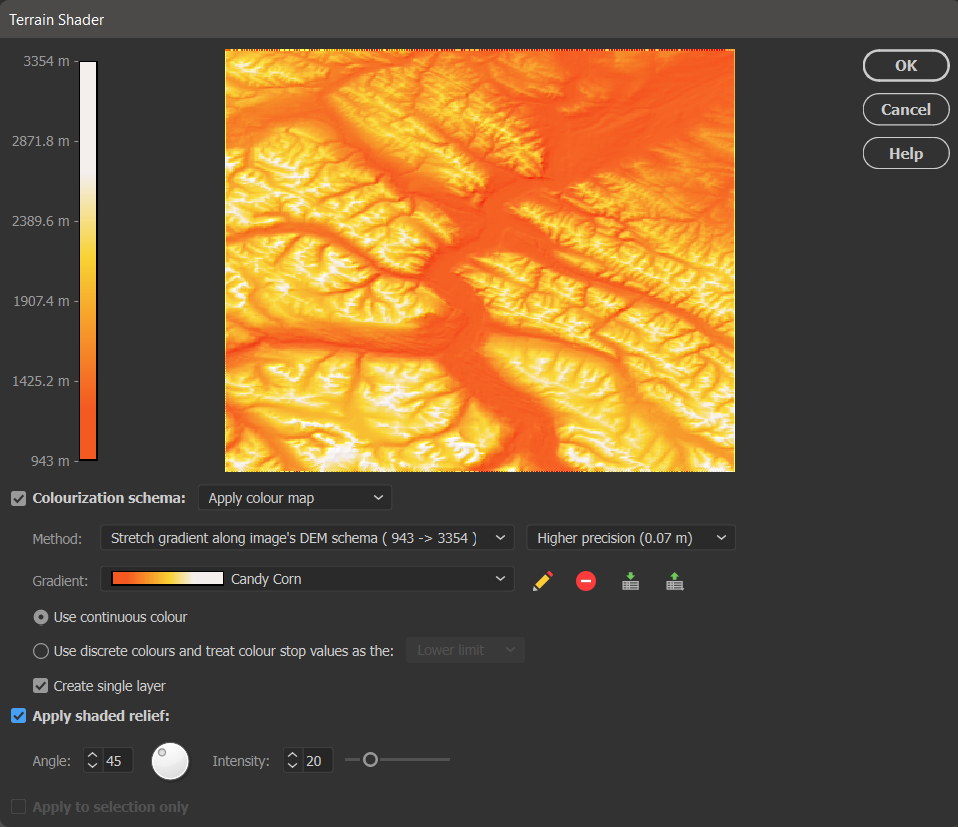
I’m starting with a DEM file covering a portion of Jasper National Park in Alberta. DEMs are imported by default using a black-white gradient, with black representing the lowest elevation and white representing the highest.
Next, you can open the Geographic Imager panel and select the Terrain Shader button.
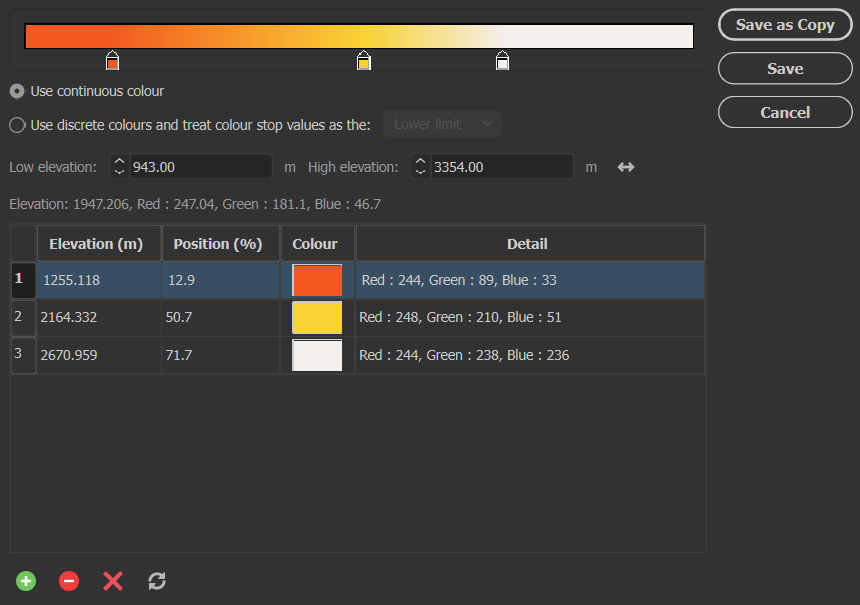
There are many different settings available in the Terrain Shader tool to customize your design. First, ensure the Colourization schema option is checked and set to “Apply colour map” which enables you to apply colour to your DEM. You can also choose the Method to stretch the colour map over a preset group of values or simply apply your colour ramp from the highest and lowest point on the DEM.
Next, you want to select any Gradient from the list and press the pencil icon to open the Colour Map editor window. From this window, you can set and adjust three different colour stops to represent the three candy corn colours you wish to apply to your map.
When you are finished, be sure to click Save and save it as a new colour map, titled appropriately (in my case, it was “Candy Corn”).
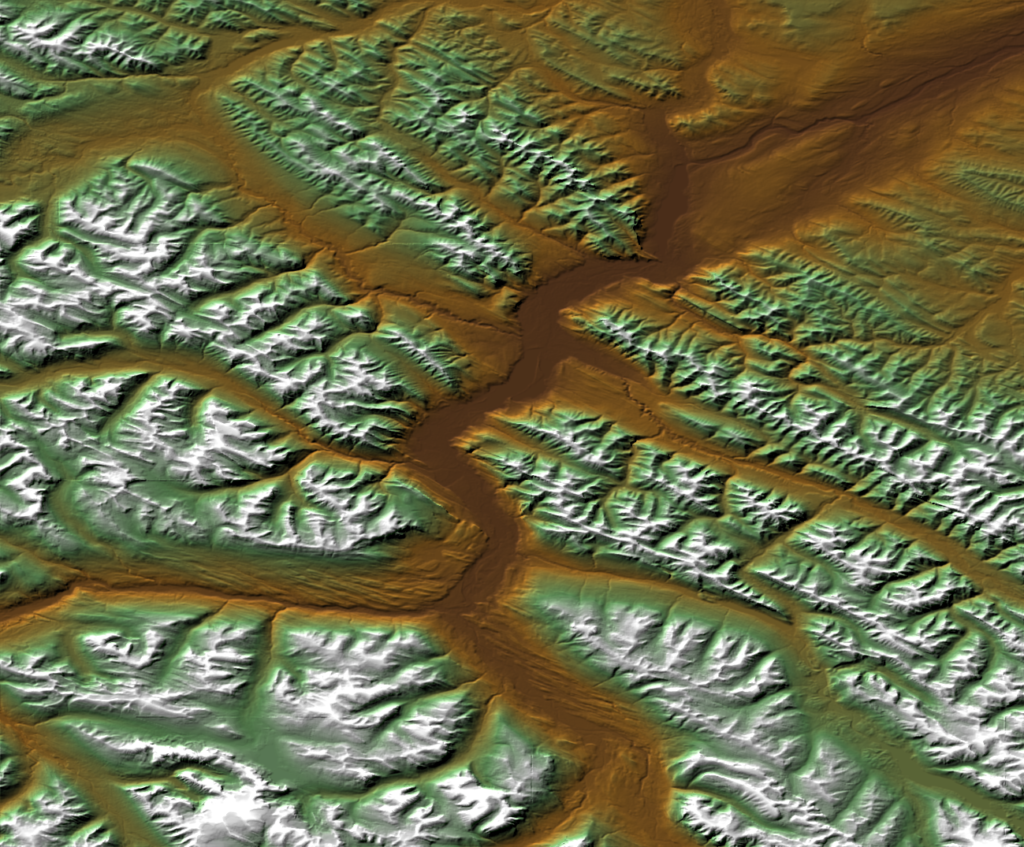
Finally, select Apply shaded relief and adjust the light source angle and intensity if desired. Shaded relief is what adds texture to your DEM to make it look like terrain.
Click OK, and you have successfully created your very own candy corn mountains! This is just one fun way to make use of the terrain shader to add a personal touch to your map. See the final result below, as well as a few other examples of colourization schemas that can be used to add a more realistic feel to your terrain.
For more information about the Terrain Shader tool, check out our related Support Centre articles and tutorial!
Join us at the North American Cartographic Information Society’s 42nd annual meeting at The Depot in downtown Minneapolis.
NACIS 2022 will feature over 150 speakers and presenters at Practical Cartography Day, twenty-one Main Conference sessions, two discussion panels, four workshops, and one field trip.
Adobe MAX 2022 The Creativity Conference October 18–20 Los Angeles and virtual
Adobe MAX is the largest and fastest-growing creativity conference. Join us there, where thousands of designers, developers, and business leaders will come together to learn new skills, discover the latest technologies, and discuss emerging trends. See for yourself how easy it is to make beautiful maps in Adobe Creative Cloud using MAPublisher and Geographic Imager.
With the recent release of MAPublisher 11.0, the plugin now comes with a new set of three MAP Erase tools in its arsenal. In this blog, we would like to highlight how these tools work and differentiate between each of them.
Much like the MAP Crop tools, there are three slightly differing tools in the MAP Erase toolset: MAP Vector Erase Tool, MAP Vector Erase, and MAP Erase by Shape. The advanced settings for the MAP Erase tools are shared with the MAP Crop tools, and can be accessed in the MAPublisher Preferences window under “MAP Crop Tool”.
Also like the MAP Crop tools, there are limitations to the types of artwork that can be erased using these tools. The purpose of MAP Vector Erase is to cut and remove vector data (points, lines, and polygons), however some Adobe Illustrator-specific objects may not be erased properly using this tool:
Blend and Live Paint objects
Any art using effects that have been rasterized
Custom art such as scale bars, grids/graticules, north arrows (this art must be expanded to crop)
Compound shapes
Legacy and overflowing text
Locked objects (command box: either treat locked layers as unlocked or skip locked layers)
Hidden layers (command box: either crop hidden layers or skip hidden layers)
Images
MAP Vector Erase Tool
The MAP Vector Erase Tool can be selected from the Illustrator menu. You can draw a rectangle or ellipse shape on the portion of the map you would like to erase.
You can also click anywhere on the artboard which will open the MAP Vector Erase dialog box and specify crop options. Which leads us to the next Erase tool…
MAP Vector Erase
MAP Vector Erase can be accessed from the MAP Toolbar in the Geoprocessing section under the Crop menu as well. This will also result in the MAP Vector Erase dialog box opening. There are a few options you can use to customize how you want your erase shape to be created, as shown below. In my case, I have created a bounding box to perform my erase with, and I would like to apply it to all layers in my document.
You can also click the Advanced… button for further options, which is useful for deciding how your labels are affected by the MAP Erase tools.
The final result is very similar to the previous step, however the MAP Vector Erase dialog box allows for much more customization and specificity.
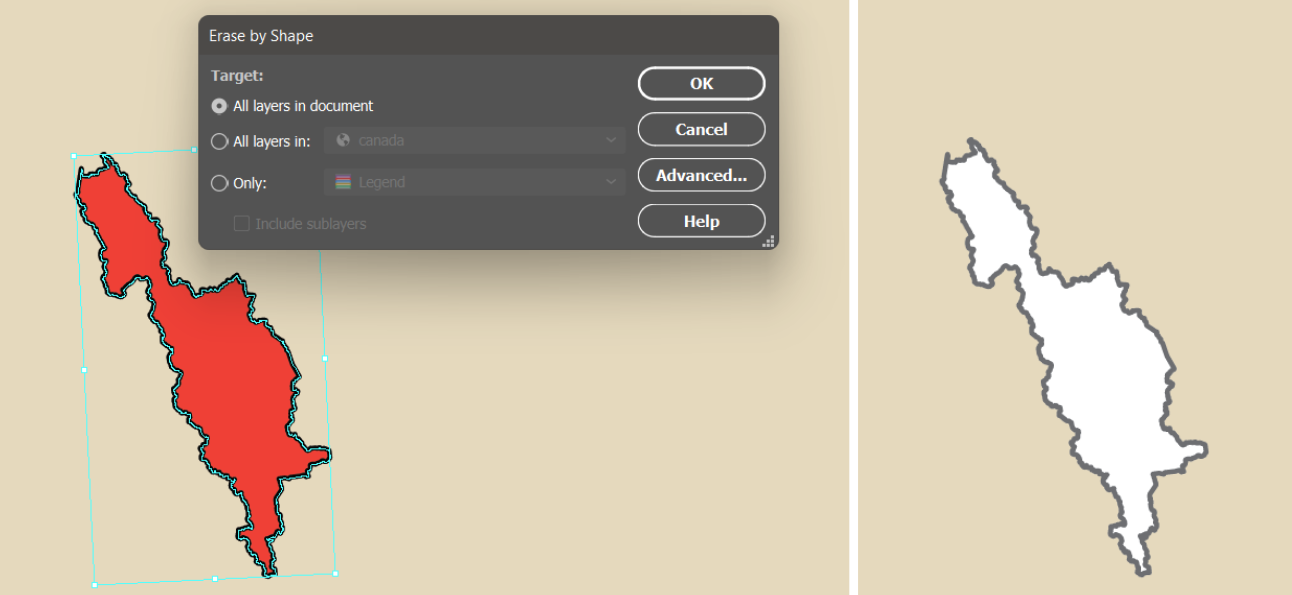
MAP Erase by Shape
The final tool in the Erase series is the MAP Erase by Shape tool, which is also located in the Crop menu of the Geoprocessing section of the MAP Toolbar. This tool can only be opened when there is a single polygon selected on the document, which will be the bounds for the erasure. The MAP Erase by Shape tool is useful when you wish to erase an area that is not a rectangular or elliptical shape. For example, in this example, I used the shape of Banff National Park to erase this portion of my map.
For more information about MAPublisher’s new MAP Erase tools, please visit our Support Centre.
We’re excited to announce that the 2023 Avenza Student Map Contest has now concluded. Submissions for the contest were accepted from December 1st, 2022 to April 30th, 2023. Over the last month we have selected the winner. As such, congratulations are in order for the grand prize winner!
Grand Prize Winner
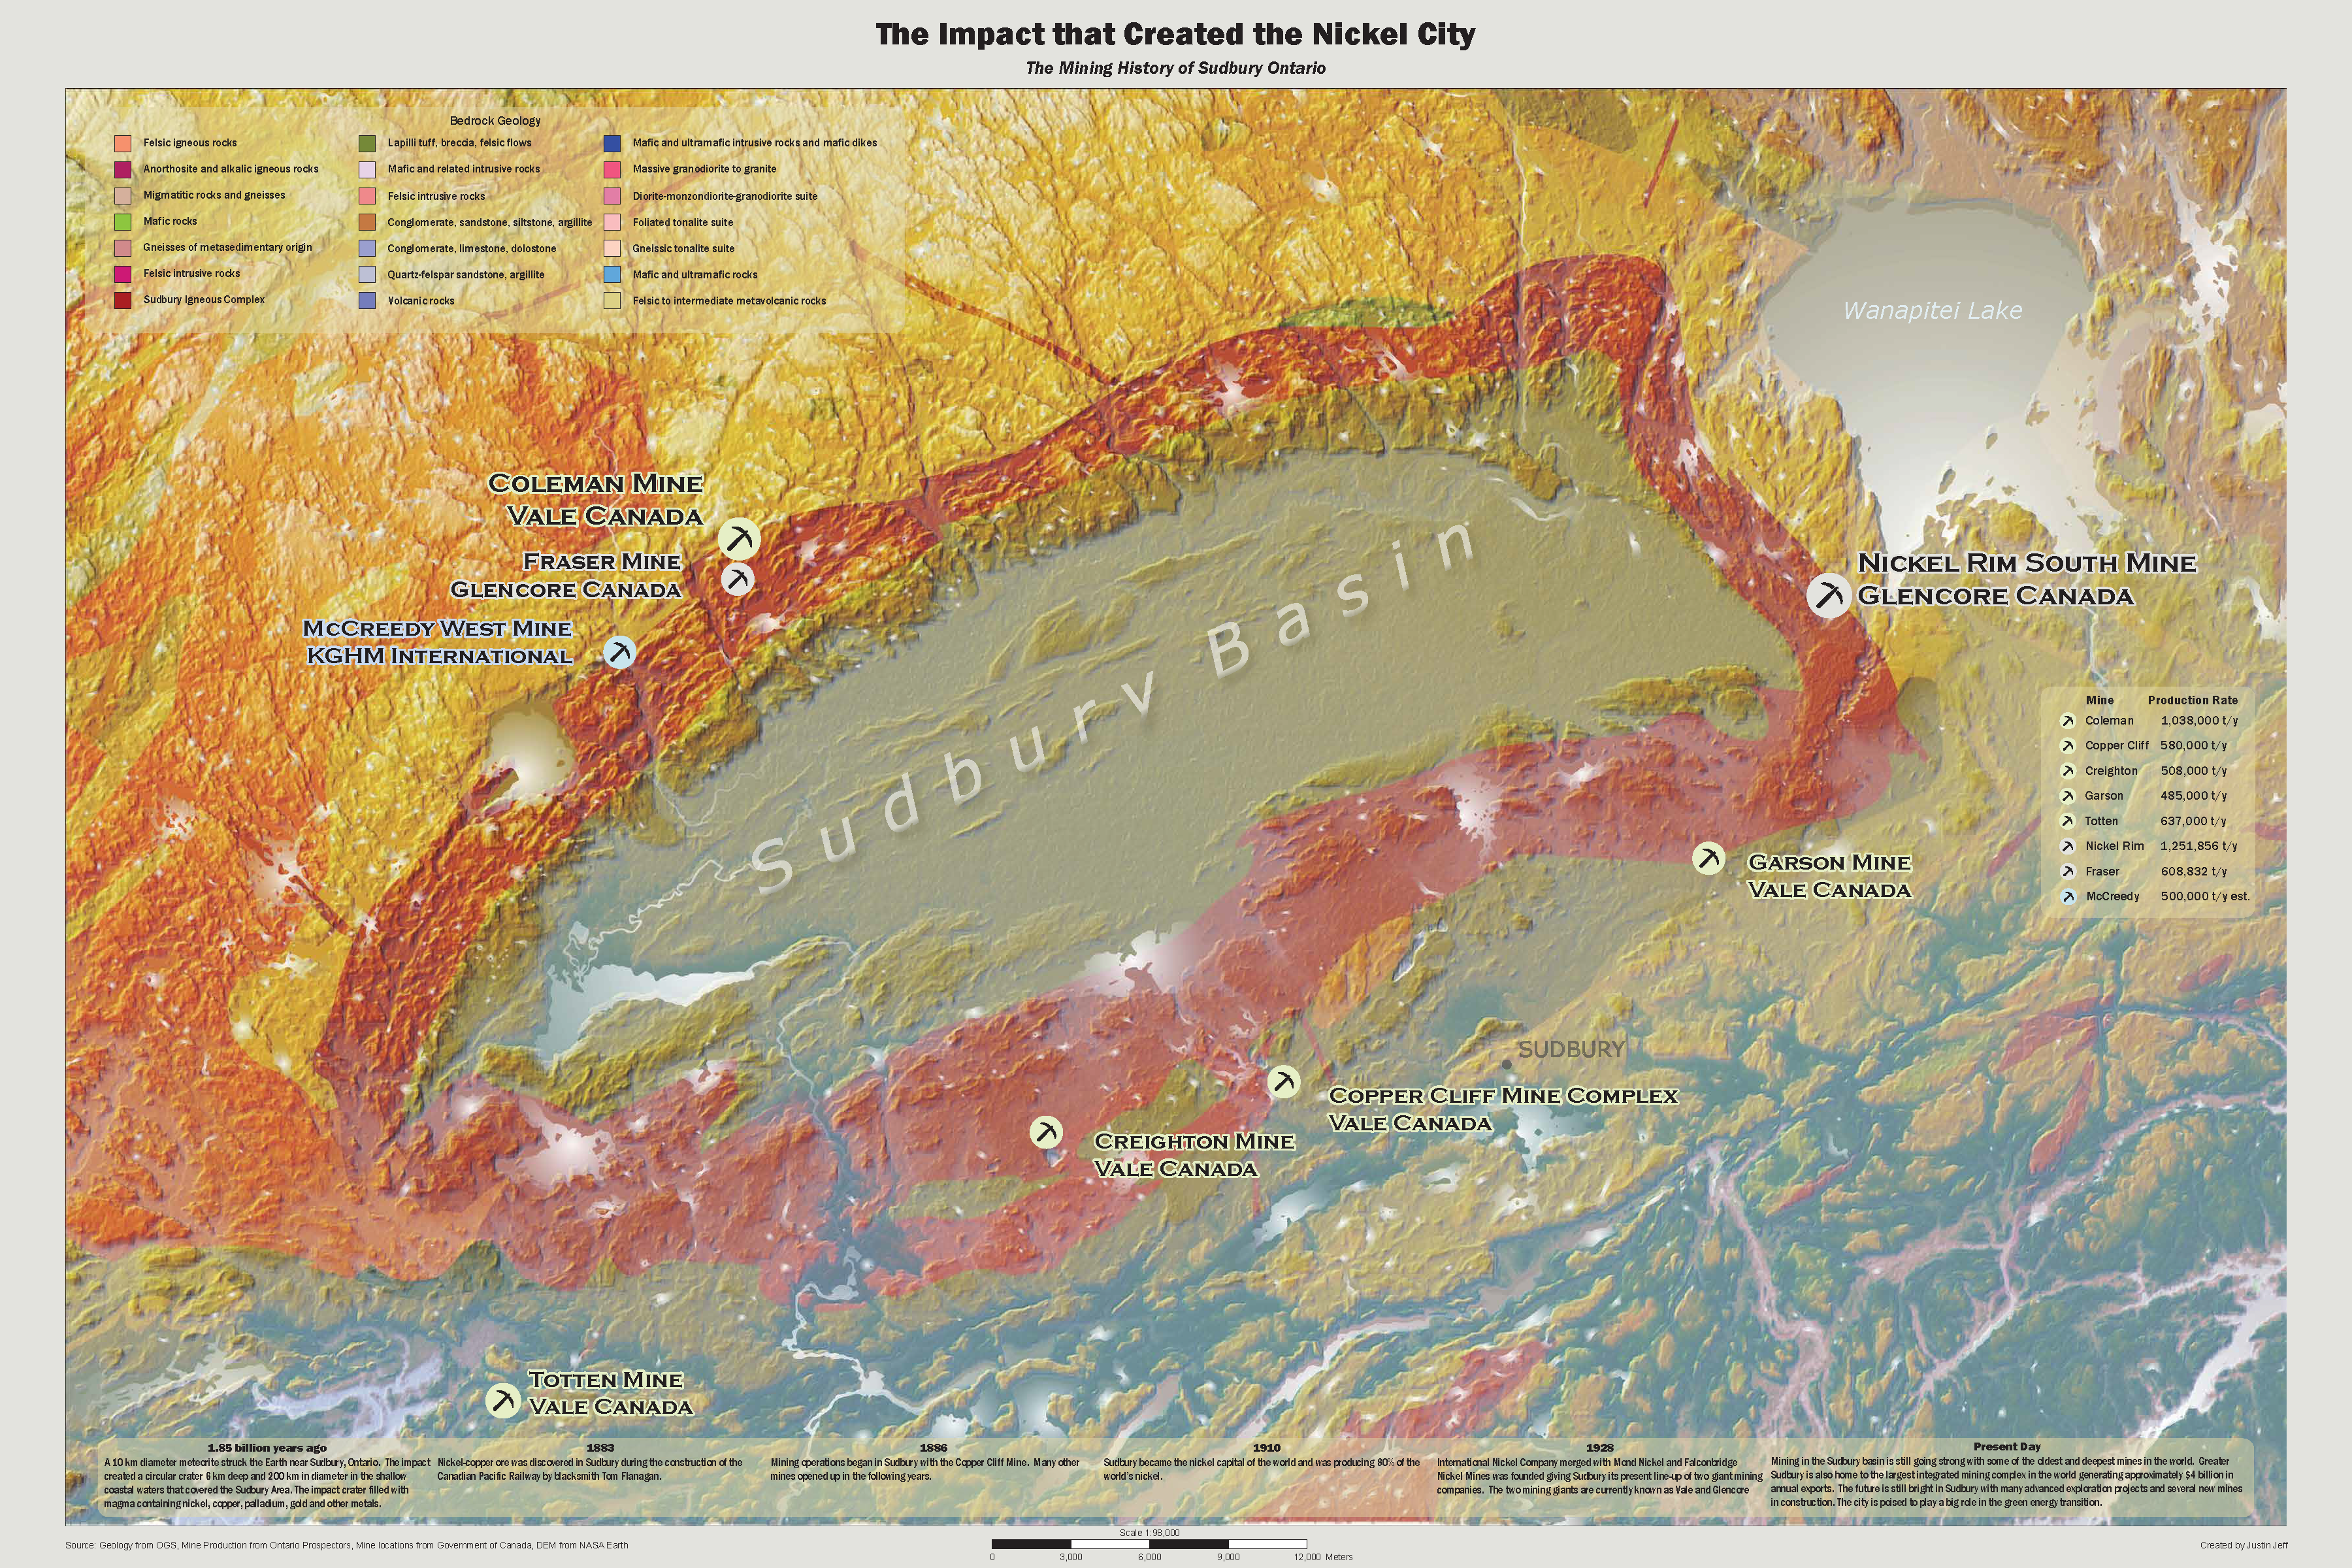
The Impact that Created the Nickel City Justin Jeff Fleming College
From the creator: “My map displays the terrain and geology around the Sudbury Basin that was created by a meteorite impact. Furthermore, it shows the active mines around the Sudbury Basin using a proportional dot technique based on the mines production. Also it shows a timeline of the mining history in the Sudbury area. It will be used to gain insight and understand the significance of the Sudbury Basin.”
Justin used the MAPublisher import tools to import prepared data from other sources for the terrain and mine locations. The MAP Themes tool was used to create proportional dot symbols for the active mines and the MAP LabelPro add-on was used to label and style the active mines. Finally, Justin used the Layout tools to add and style the scale bar.
Congratulations again to Justin! Stayed tuned for the open version of the Avenza Map Contest starting soon…
Toronto, CA (October 18, 2022) – Avenza Systems Inc., producer of the Avenza Maps® app for mobile devices is pleased to announce the upcoming releases of MAPublisher® 11.1 for Adobe Illustrator® 2023 and Geographic Imager® 6.6 for Adobe Photoshop® 2023. These updates will provide a range of user interface improvements, feature enhancements, bug fixes, and performance upgrades, along with compatibility with the latest Adobe Creative Cloud applications.
Data-driven Map Design in Illustrator with MAPublisher
MAPublisher cartography software seamlessly integrates more than seventy GIS mapping tools into Adobe Illustrator to help you create beautiful maps from GIS data. Import industry-standard GIS data formats and make crisp, clean maps with all attributes and georeferencing intact using the Adobe Illustrator design environment.
Expected improvements for the MAPublisher 11.1 extension for Adobe Illustrator include maintenance fixes and Adobe Illustrator 2023 compatibility. Additional feature upgrades to be announced soon.
Powerful Imagery Editing in Photoshop with Geographic Imager
Geographic Imager for Adobe Photoshop delivers an all-encompassing solution to import, edit, and export geospatial images such as aerial and satellite imagery. Work with digital elevation models, GeoTIFFs, and other popular GIS image formats while using Adobe Photoshop features such as transparencies, filters, cropping, and image adjustments; all while maintaining georeferencing and support for hundreds of coordinate systems and projections
Expected improvements of the Geographic Imager 6.6 extension for Adobe Photoshop include official Apple Silicon support, a revamped discoverability screen, maintenance fixes, and Adobe Photoshop 2023 compatibility.
Upgrade or Purchase
MAPublisher 11.1 will be available free of charge to all current MAPublisher users with active maintenance and as an upgrade for non-maintenance users starting at US$649. New licenses are available from US$1499. MAPublisher FME Auto and MAPublisher LabelPro are also available as add-ons starting at US$499.
Geographic Imager 6.6 will be available and free of charge to all current Geographic Imager Maintenance Program members and starts at US$349 for non-maintenance upgrades. New fixed licenses start at US$749. Geographic Imager Basic Edition licenses start at US$99.
Academic, floating, and volume license pricing is also available for both extension suites.
More about Avenza Systems Inc.
Avenza Systems Inc. is an award-winning, privately held corporation that provides cartographers and GIS professionals with powerful software tools to make better maps. Avenza also offers the mobile Avenza Maps app to sell, purchase, distribute, and use maps on iOS and Android devices. For more information, visit www.avenza.com.
For further information contact: 416-487-5116 – info@avenza.com – www.avenza.com
We are very excited to announce the release of MAPublisher 11, the latest version of our MAPublisher extension for Adobe Illustrator.
With MAPublisher 11, we are bringing forward full compatibility with the Apple Silicon processor, enhancements to the MAP Attributes panel, a revamped welcome screen, the ability to import OpenStreetMap file formats, a brand new set of MAP Erase tools, and several performance and bug fixes.
Here’s what you can expect with the latest MAPublisher 11 release:
Compatibility with the Apple Silicon Processor
We want to ensure our users enjoy a truly seamless experience whether they are using a PC or Mac computer. Our team has worked to ensure that MAPublisher 11 is fully compatible with the Apple Silicon chip, and as such we can declare that MAPublisher is officially supporting this processor.
MAP Attributes Panel Enhancements
An exciting feature for MAPublisher 11 is a number of enhancements made to the MAP Attributes panel. Users are no longer required to select all objects on a layer for them to appear in the MAP Attribute panel. Instead, all features appear by default, and users can toggle between showing all features or just their selected features at the bottom left corner of the panel. When all features are shown, selected features will appear highlighted in the attribute table.
Welcome Screen Revamp
MAPublisher 11 comes with a brand new welcome screen that appears upon opening the program. This window is equipped with visually appealing refreshed graphics, while maintaining access to the License Management window. It also features several new sections that increase discoverability for you, such as new features, help and tutorials, and other Avenza news or events. There is also a Get Inspired section to help inspire you as a mapmaker, which features articles from our website which highlight the excellent maps and stories of some of our most proficient users.
Importing OpenStreetMap File Formats
We are thrilled to announce that importing OpenStreetMap (OSM) file formats is now a possibility with MAPublisher 11! Whether you are importing a single file, or using the Multiple Data Import tool you can now select OSM and PBF file formats from the list of supported formats. The rest of the import process remains unchanged from the other file formats users are familiar working with in MAPublisher.
MAP Erase Tools
Many of our users have requested the ability to quickly erase unwanted or sensitive data from their maps. Thus, we are happy to introduce the new MAP Vector Erase and MAP Erase by Shape tools that come along with MAPublisher 11!
MAP Vector Erase Tool
With the new release of MAPublisher 11 comes a new tool known as the MAP Vector Erase tool. Functioning as an inverse version of the MAP Vector Crop tool, the Erase tool removes all data within a specified rectangle or ellipse shape.
MAP Erase by Shape Tool
The new MAP Erase by Shape tool functions similarly to the MAP Vector Erase tool, but it allows users to easily erase portions of MAP Layers using shapes other than rectangles and ellipses. Users can simply select the shape object they wish to use as the erase boundaries, and then select the MAP Erase by Shape tool from the MAP Toolbar.
Both tools share the same customizable settings and advanced options. Like the MAP Crop tools, the MAP Erase tools can be applied to all layers within the document, all layers within a single MAP View, or just a single layer.
If you would like to learn more about the new MAPublisher 11 features or have any questions, please check out our Support Centre.
MAPublisher 11 is immediately available today, free of charge to all current MAPublisher users with active maintenance subscriptions and as an upgrade for non-maintenance users.
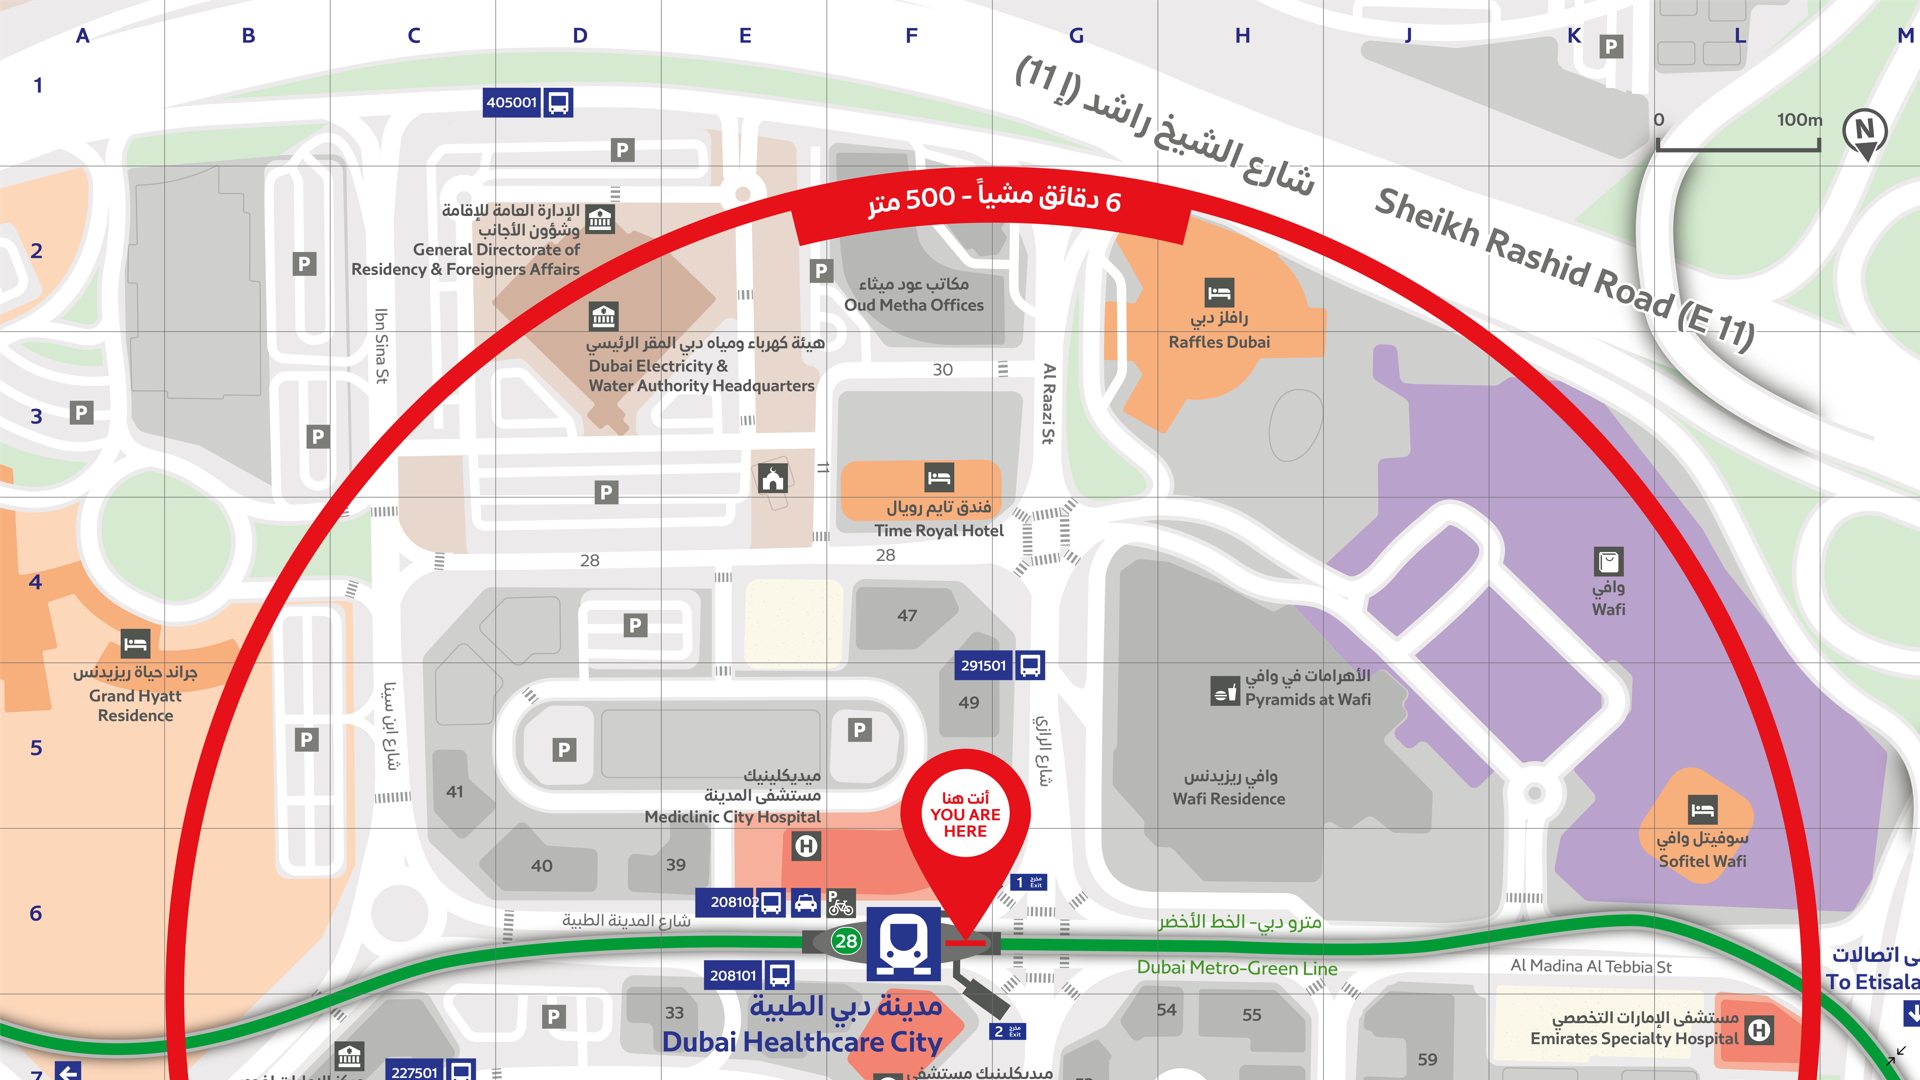
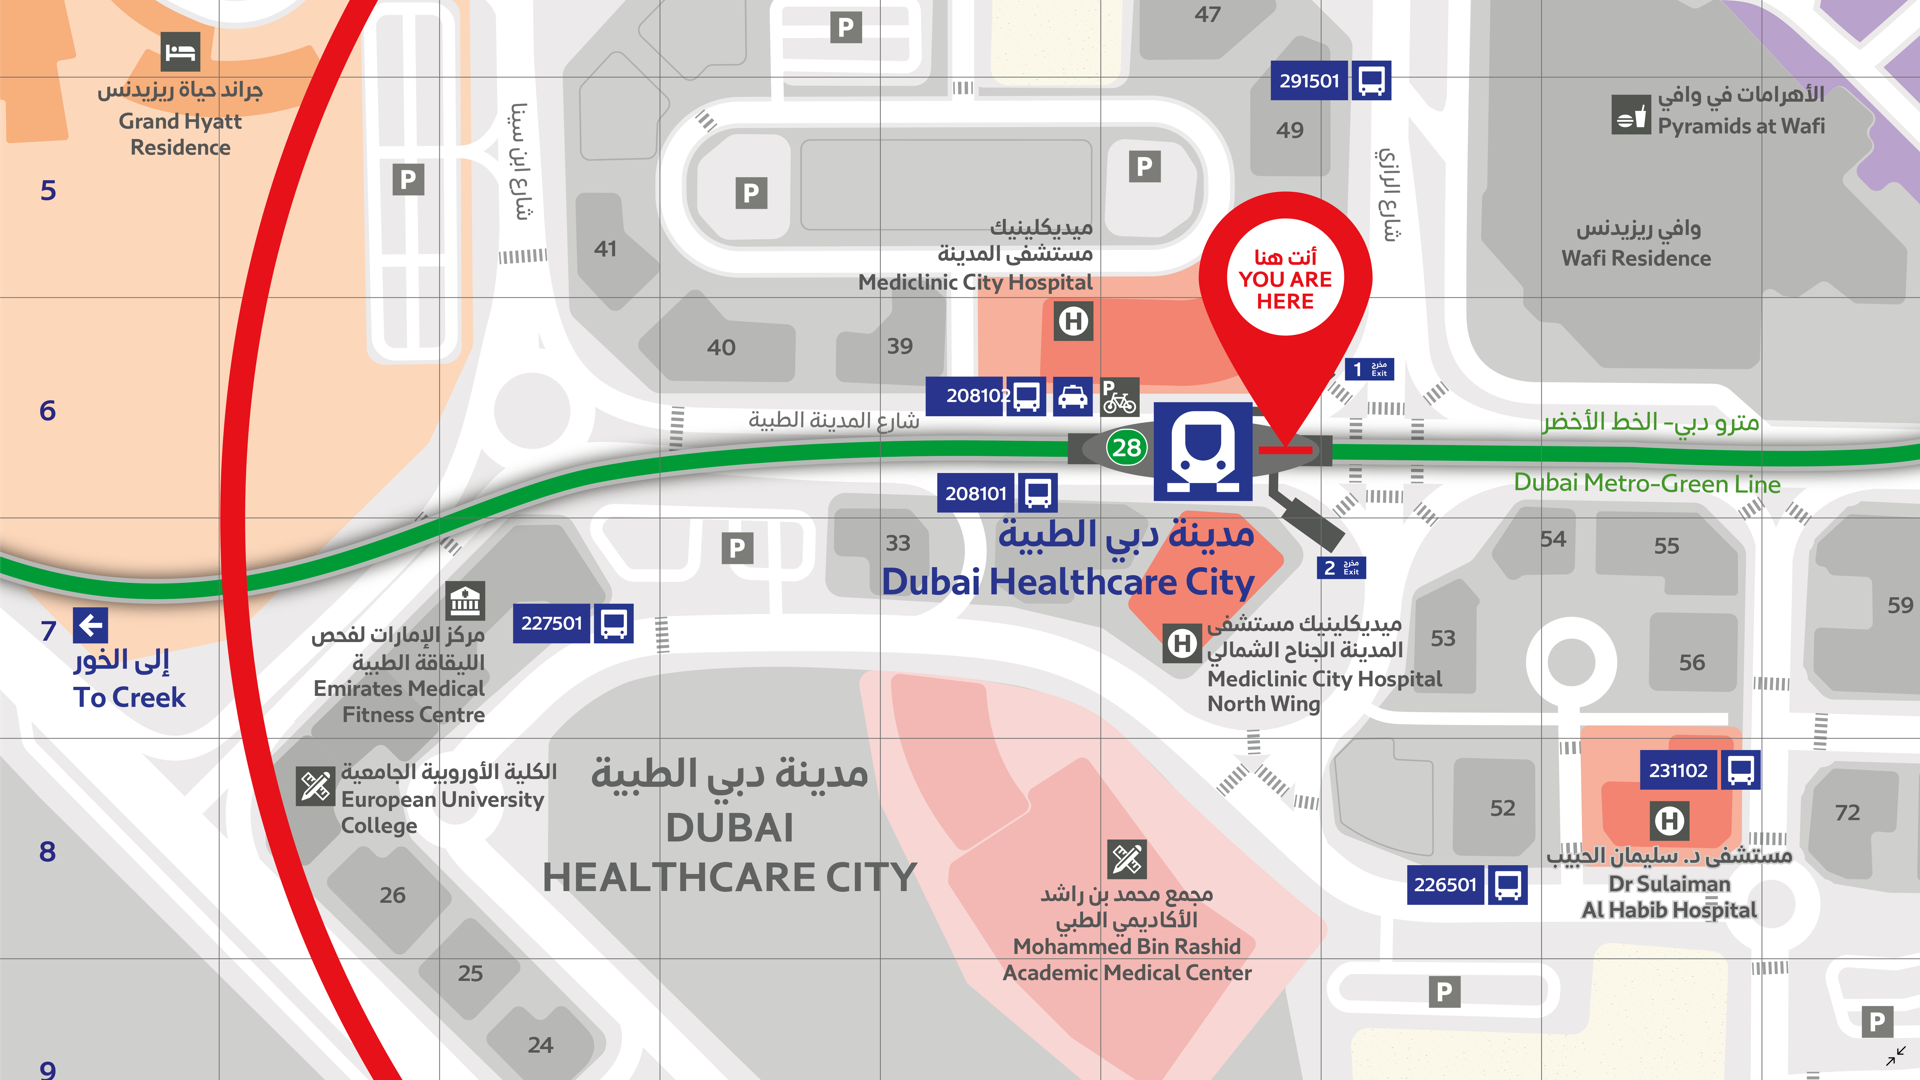
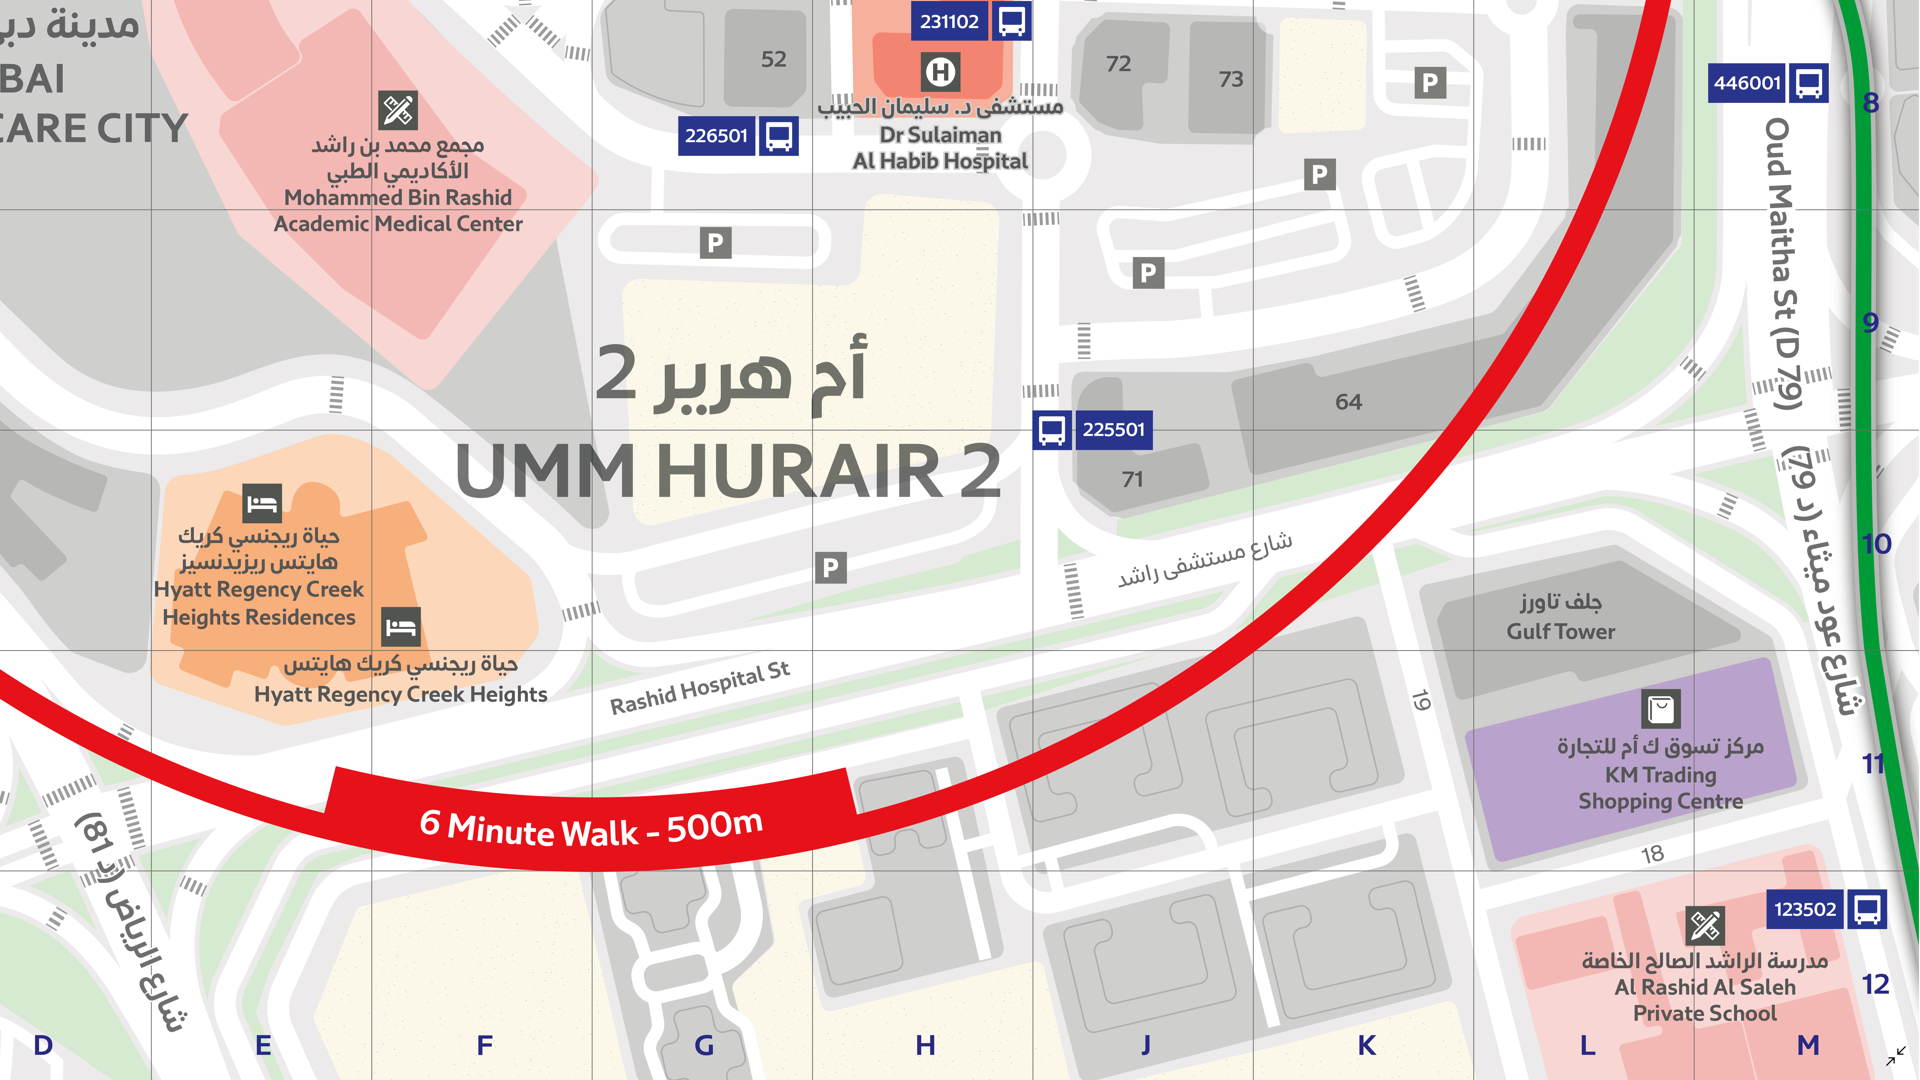
In this Map Gallery Spotlight, we are highlighting another submission from the 2021 Avenza Map Competition. This bilingual map of the area around the Dubai Healthcare City Metro Station was created by Zain Madathil for Explorer Publishing. It is one of nearly 4,000 individual maps he has created for the Dubai Public Transport Map project.
The map is easy-to-use and informative, providing information in both English and Arabic, and is accompanied by a detailed map index to categorize and highlight important points of interest and nearby attractions surrounding the station. The map utilizes careful design elements to make interpretation easy, including colour-coded icons and building footprints, platform-based direction markers, and a 500m radius walking distance indicator.
Select the images below to see a detailed look at Zain’s map
Making the Map
Madathil received data from his client in the form of points, lines, and polygons, and used the Avenza MAPublisher plugin for Adobe Illustrator to design the map. He used the Multiple Data Import tool to easily get all of his data into MAPublisher with a single import process. MAPublisher maintains the georeferencing of the data imported from almost any source, which allowed Madathil to focus on customization rather than data placement.
With nearly 4,000 maps in the series, the MAP Themes tool was important for Madathil to maintain consistent labelling across all maps in the series. After creating a custom branding MAP Theme stylization, Madathil was able to apply this to each map in the series as necessary. He also used the Map Attributes Panel to aid with customization of the attribute data associated with his map features.
Madathil simplified his labelling process by using our MAPublisher LabelPro add-on, which also allowed him to ensure consistency across the map series. LabelPro allowed Madathil to customize the style of his labels and apply rules to ensure they did not overlap important features or other labels. It also eased his application of both Arabic and English labels on the map.Finally, Adrain added an Index Grid and created an index and legend to complete the reference guide for the map using the Layout Tools.
For more information on using the MAPublisher LabelPro add-on, please visit our Support Centre section for this tool.Check out our other Map Gallery Spotlight blogs here!