My Account     Contact Us     Cart

Exploring the New MAP Erase Tools in MAPublisher

With the recent release of MAPublisher 11.0, the plugin now comes with a new set of three MAP Erase tools in its arsenal. In this blog, we would like to highlight how these tools work and differentiate between each of them.

Much like the MAP Crop tools, there are three slightly differing tools in the MAP Erase toolset: MAP Vector Erase Tool, MAP Vector Erase, and MAP Erase by Shape. The advanced settings for the MAP Erase tools are shared with the MAP Crop tools, and can be accessed in the MAPublisher Preferences window under “MAP Crop Tool”.

Also like the MAP Crop tools, there are limitations to the types of artwork that can be erased using these tools. The purpose of MAP Vector Erase is to cut and remove vector data (points, lines, and polygons), however some Adobe Illustrator-specific objects may not be erased properly using this tool:

  • Blend and Live Paint objects
  • Any art using effects that have been rasterized
  • Custom art such as scale bars, grids/graticules, north arrows (this art must be expanded to crop)
  • Compound shapes
  • Legacy and overflowing text
  • Locked objects (command box: either treat locked layers as unlocked or skip locked layers)
  • Hidden layers (command box: either crop hidden layers or skip hidden layers)
  • Images

MAP Vector Erase Tool

The MAP Vector Erase Tool can be selected from the Illustrator menu. You can draw a rectangle or ellipse shape on the portion of the map you would like to erase.
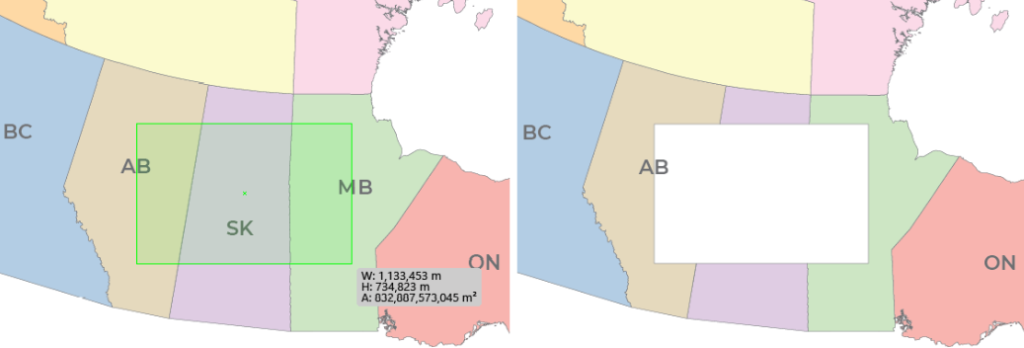
You can also click anywhere on the artboard which will open the MAP Vector Erase dialog box and specify crop options. Which leads us to the next Erase tool…

MAP Vector Erase

MAP Vector Erase can be accessed from the MAP Toolbar in the Geoprocessing section under the Crop menu as well. This will also result in the MAP Vector Erase dialog box opening. There are a few options you can use to customize how you want your erase shape to be created, as shown below. In my case, I have created a bounding box to perform my erase with, and I would like to apply it to all layers in my document.

You can also click the Advanced… button for further options, which is useful for deciding how your labels are affected by the MAP Erase tools.

The final result is very similar to the previous step, however the MAP Vector Erase dialog box allows for much more customization and specificity.

MAP Erase by Shape

The final tool in the Erase series is the MAP Erase by Shape tool, which is also located in the Crop menu of the Geoprocessing section of the MAP Toolbar. This tool can only be opened when there is a single polygon selected on the document, which will be the bounds for the erasure. The MAP Erase by Shape tool is useful when you wish to erase an area that is not a rectangular or elliptical shape. For example, in this example, I used the shape of Banff National Park to erase this portion of my map.

For more information about MAPublisher’s new MAP Erase tools, please visit our Support Centre.

Mapping Canadian Capitals for Canada Day

Canada Day Map MAPublisher

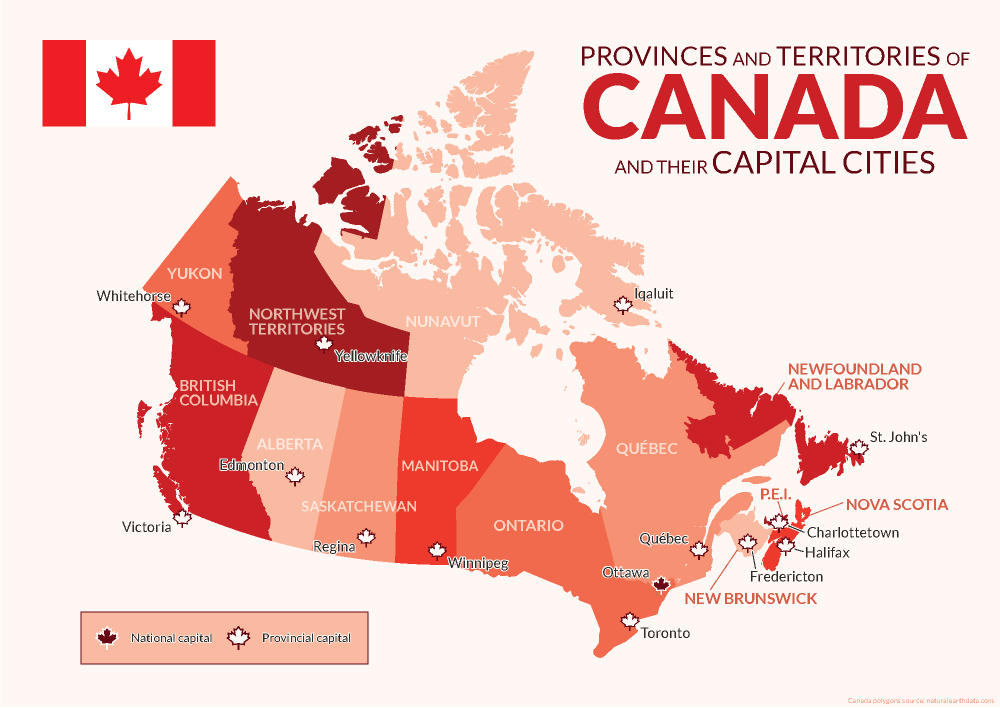
Avenza was founded and headquartered in Toronto, and as such, we pride ourselves on being a Canadian company with a global reach. This year we have celebrated by creating a map highlighting the names and capital cities of each province and territory of Canada using MAPublisher

Using the MAP Point Plotter Tool to Plot Canadian Capital Cities

This blog will detail how we quickly and easily plotted points to represent the capital cities of Canada and its provinces and territories using the MAP Point Plotter tool. Firstly, a MAP Point layer must be created and selected before opening the MAP Point Plotter tool. This is the only layer type that can be used with this tool, for obvious reasons. 

There are several different ways in which addresses and coordinates can be entered into the MAP Point Plotter tool. This blog will highlight a few of the common techniques.

Using a Point’s Address

The simplest way to plot a point is by entering its address, following a specific-to-general granularity format as seen in the examples below. After opening the tool, the Address tab was selected and the following cities were plotted using MapQuest to locate these addresses:

  • Victoria: 1 Centennial Square, Victoria, BC V8W 1P6
  • Edmonton: Edmonton, AB T5J 0R2
  • Regina: 2476 Victoria Ave, Regina, SK
  • Winnipeg: 510 Main Street, Winnipeg
Canada Day Victoria Plot Address

Using a Point’s Coordinates in Decimal Degrees

Another way to plot points is to use coordinates, by selecting the Coordinates tab. There are several different coordinate formats accepted by the MAP Point Plotter tool. We entered simple decimal degrees by selecting Decimal degrees as the format and using these coordinates:

  • Whitehorse: Long: -135.056839, Lat: 60.721188
  • Yellowknife: Long: -114.371788, Lat: 62.453972
  • Iqaluit: Long: -68.519722, Lat: 63.748611
Canada Day Whitehorse Plot Coordinates

Decimal degrees with a compass direction can be entered similarly to the previous step by using negative or positive numbers to indicate the hemisphere of the point or the compass direction can be indicated by using a letter. The follow cities were added to the map in this manner: 

  • Toronto: 43.6532° N, 79.3832° W → Long: -79.3832, Lat: 43.6532
  • Québec: 46.8139° N, 71.2080° W → Long: -71.2080, Lat: 46.8139
  • St. John’s: 47.5615° N, 52.7126° W → Long: 52.7126W, Lat: 47.5615N

Using a Point’s Coordinates in Degrees Minutes Seconds

Coordinates that are formatted as Degrees Minutes Seconds, can be added using various delimiters, such as spaces, dashes, underscores, colons, or d (degree), single quote (minute), double quote (second). We entered the last 3 provincial capital cities using these formats:

  • Halifax: 44° 39′ 3.8520″, -63° 34′ 57.6732″ → Long: 063 34 57.6732W, Lat: 44 39 3.8520N
  • Charlottetown: 46° 14′ 19.9968″, -63° 7′ 44.9976″ → Long: -63-07-44.9976, Lat: 46-14-19.9968
  • Fredericton: 45° 57′ 53.9748″, -66° 38′ 46.7952″ → Long: 066d38’46.7952″W Lat: 45d57’53.9748″N

Using MAP Locations to Plot a Point

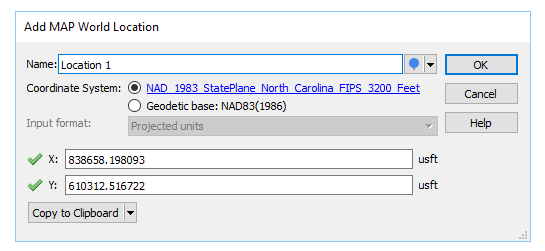
Points can also be plotted from previously created MAP Locations (to learn about this tool, visit the MAP Locations page in our Support Centre). This is how we plotted a MAP Location for Ottawa on our map. In the MAP Point Plotter tool window, we selected the hamburger menu and selected Plot MAP Locations. Then we selected our MAP Location for Ottawa and set the Destination Layer to Existing… and added it to the Capitals MAP Point Layer. After clicking OK the point was added to our map!

Canada Day Ottawa MAP Location Add

Finally, we used other MAPublisher finishing tools to stylize and complete our map so it would be ready to post on this blog just in time for Canada Day!

For more information about the MAP Point Plotter tool, check out its documentation page in our Support Centre!

MAPublisher Features We Love

MAPublisher has been simplifying the process of making maps beautiful for cartographers for more than 20 years. We are always adding new features and improving others, some of which have impacted the overall workflow and affect a majority of users. Other are more ‘niche’ in their application and the functions they perform. Here are a few favourite features that you may, or may not be aware of, as identified by the people who helped design and build them.

MAP Tagger Tool Michael L. – Product Marketing
I like the MAP Tagger Tool because it’s incredibly fast to create labels by clicking features on the artboard. Labels are created using attribute data as a source for the labels. In dense areas, the Map Tagger has flexibility to style and attach leader lines according to placement rules.

MAP Web Author Will H. – Sales
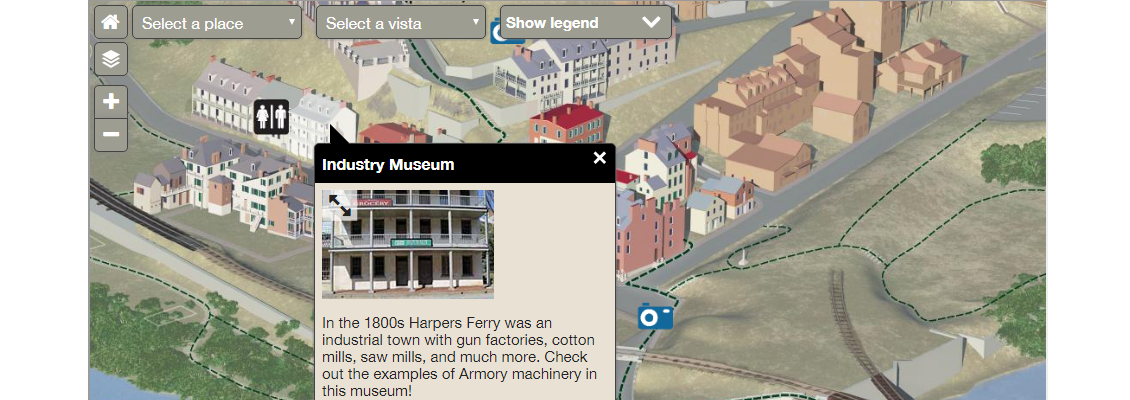
The MAPublisher users I speak with are usually impressed with Web Author and are surprised that it is included in the MAPublisher package. MAP Web Author lets Adobe Illustrator documents with GIS attributes be exported to interactive HTML5 web maps complete with callouts, rollovers, layer control, search, pan and zoom controls. With a little bit of knowledge of CSS (Cascading Style Sheets) and JavaScript you can embed interactive maps into any web page. The map below was created by the National Park Service.

MAPublisher MAP Web Author

Scale and Rotate by Attribute Andrew P. – Software Architect
We added this for a customer who had an interesting use case involving a pattern fill for lava flow. The map broke down an area into sub-areas by lava flow (direction, intensity, etc.). He wanted a way to use the attribute data he had in his map to automatically do a bunch of things he would otherwise have to do by hand, very carefully. In particular, he used the feature’s ability to rotate the pattern of area to match the lava flow direction, which sounded very cool (no pun intended) to us!

MAP Locations Tool Michael L. – Product Marketing
Most users don’t know what MAP Locations does (allows you to define real world coordinates for a location in a document) and how it’s actually useful. It sounds complicated, but it’s actually simple and far reaching throughout the product. MAP Locations can be used in several MAPublisher tools as references for georeferencing, for corners, for locations to draw lines, and locations to plot points. They can also be used to identify map and page anchors.

MAPublisher MAP Locations Tool

Add Calculated Data Andrew P. – Software Architect
Add Calculated Data is essentially a tool to update or add attribute data, but it allows users to feed in things that a user would find difficult to calculate themselves such as centroids, north angles, and art bounds. It also lets you pull in and store data like stroke or fill colours, in case you need to export them to a format that doesn’t support colours natively. You can even have it pull in elevation data!

The Avenza Resources Blog regularly published tips on how to use various MAPublisher tools. Detailed documentation is also available on our website.

News Archive