My Account     Contact Us     Cart

MAP Attribute Panel: Attribute Tear-Off Panel (CS6 or higher versions only)

MAPublisher Attribute Panel

A little known (but very useful) feature is the Attribute Tear-Off Panel which is located in the upper-right corner of the MAP Attribute panel (available in MAPublisher that’s compatible with Adobe Illustrator CS6 or higher). Use it to help you edit and view attributes even when they are deselected. It is very handy when used to compare attributes of different datasets.

Simply click the MAPublisher Attribute Panel: Tear-off icon Attribute Tear-Off Panel icon to open another MAP Attribute panel. There are a few key difference between MAP Attribute panel and Tear-off panel:

1) The tear-off panel does not have any MAP Attribute functions (e.g. Join Tables, Find and Replace, Edit Schema, etc).

MAPublisher Attribute Panel and Tear-off Panel:


2) The tear-off panel view remains active and shows attributes even after features are deselected.

MAPublisher Attribute Panel and Tear-off panel when objects are deselected.

If your data values are updated within MAP Attribute panel, click the Attribute Tear-Off Panel again MAPublisher Attribute Panel: Tear-off icon to update the values in the tear-off panel.

Labeling Trick for MAPublisher

This blog post was written by Avenza reseller in The Netherlands, Hans van der Maarel of Red Geographics.

When you’re labeling point features (let’s say cities) in MAPublisher, using either Label Pro or Label Features, and you’re not placing a label for every single point, you’re left with the task of removing the points you haven’t labeled. This trick will have the text inherit the attribute structure of the points including a lat/long and guarantee that there are no orphan points.

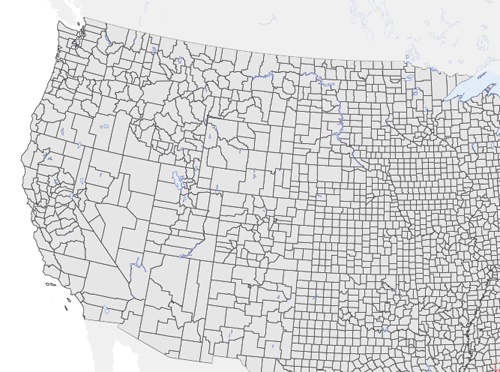
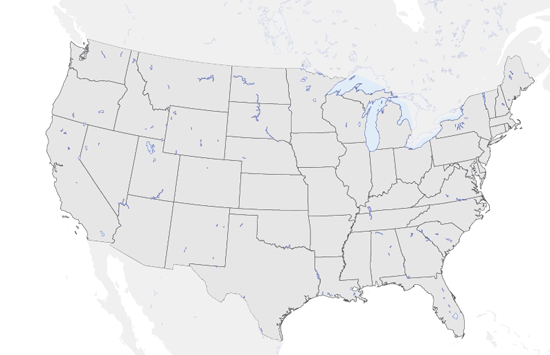
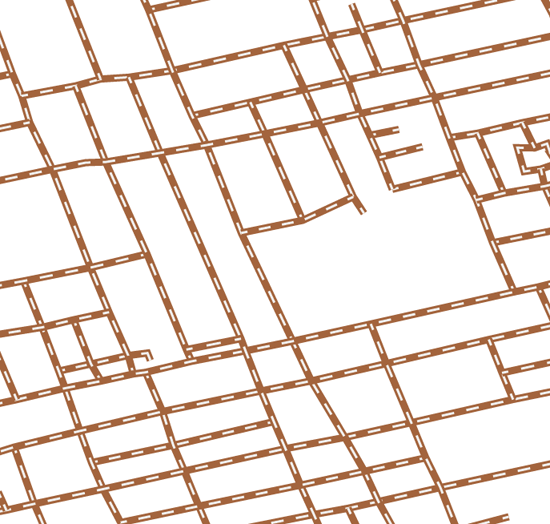
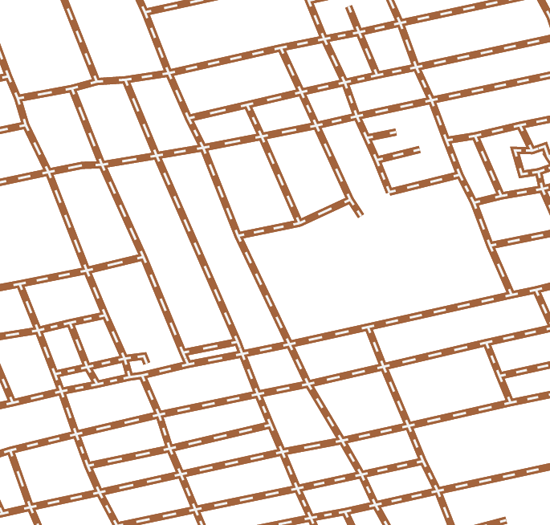
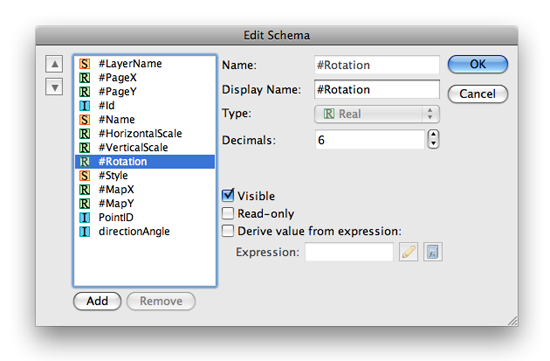
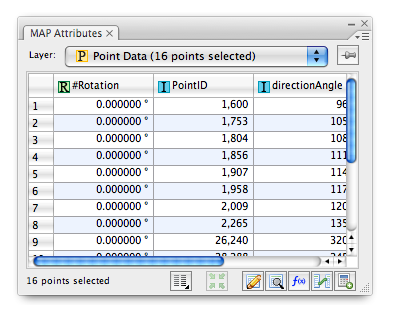
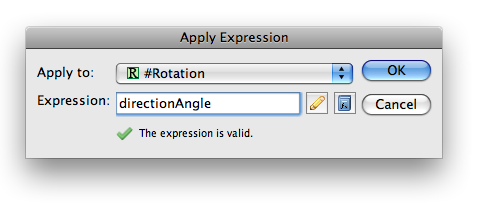
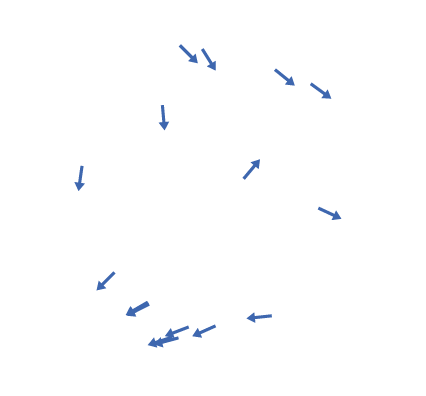
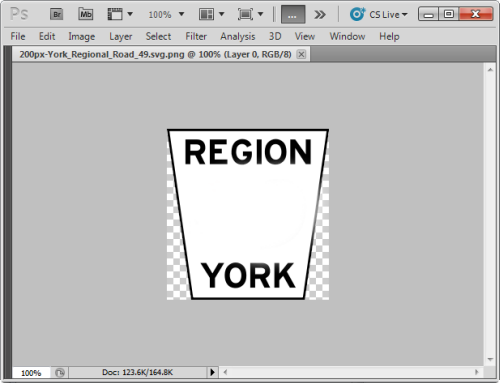
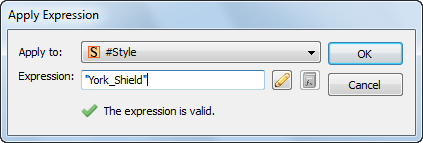
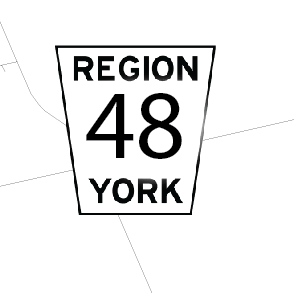
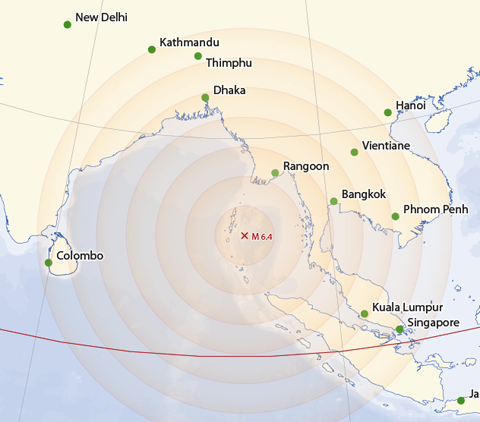
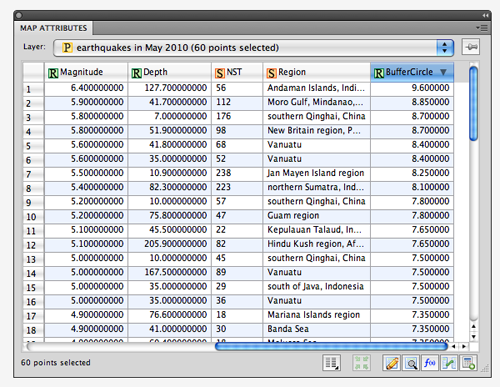
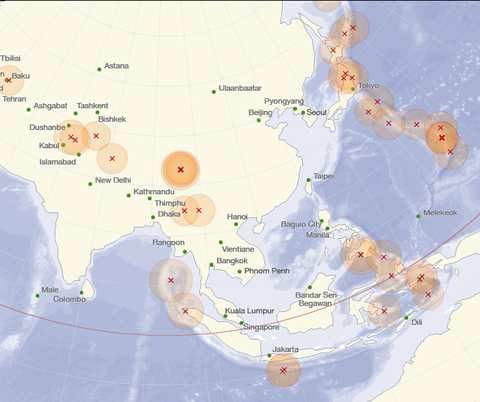
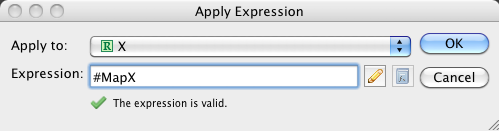
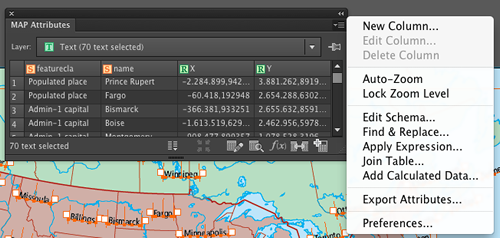
Take for example the above map. I want to label the cities, but not all of them. I’ll decide as I go along which city will get labeled, and which will get dropped. In order to more easily remove the unlabeled cities I need to do some preparation. I’ll create two columns in the cities layer, X and Y, and assign the expression #MapX and #MapY to them, respectively. It’s important that you do this through the Apply Expression option in the Map Attribute panel.

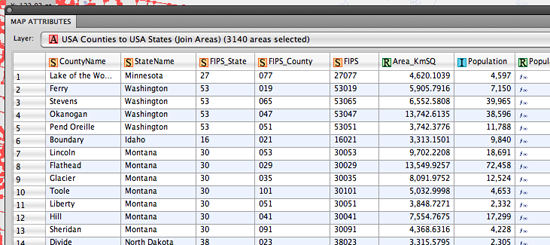
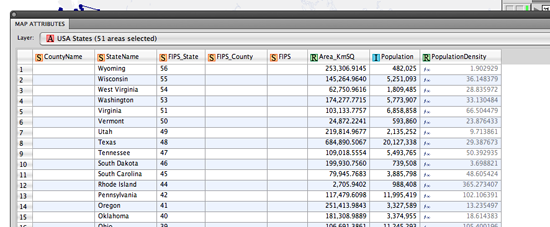
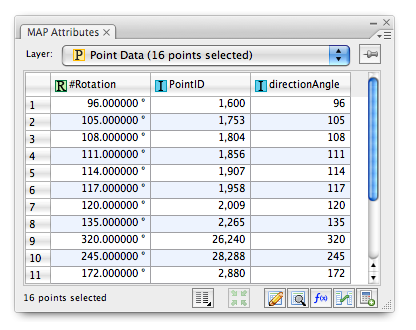
This gives two attributes with the original coordinates of the city points.

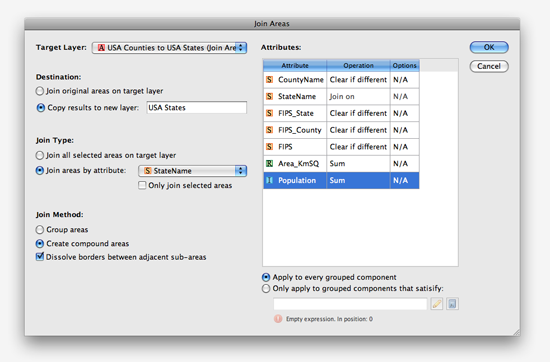
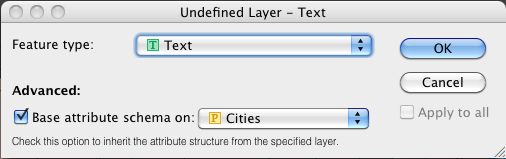
Next, I’ll create a layer for the labels and put it into the MAP View as a text layer, indicating that I want to copy the attribute structure of the cities layer.

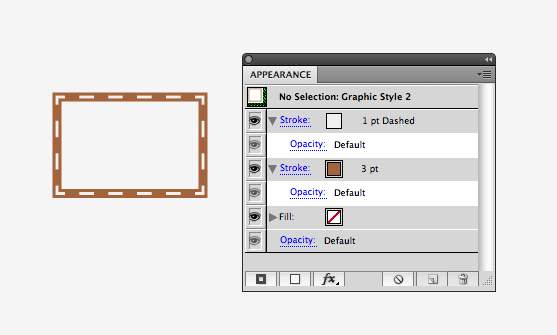
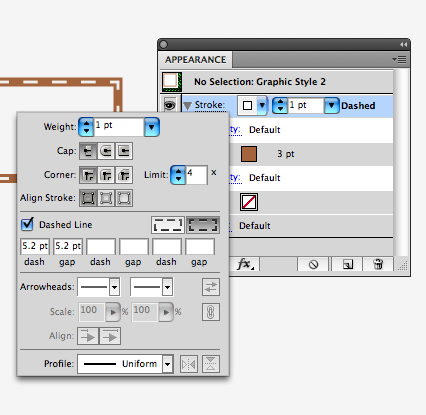
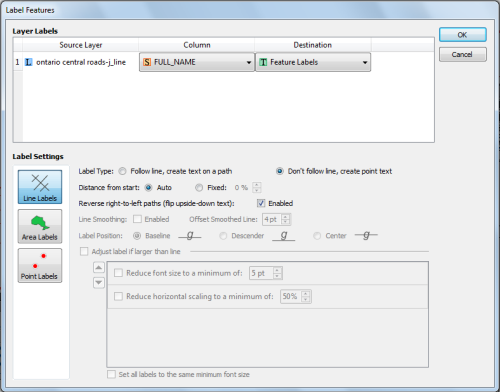
Now that all the preparatory work is done, I’ll start the labeling. I’m going to be using the Label Features option, but this will work with MAP LabelPro as well.

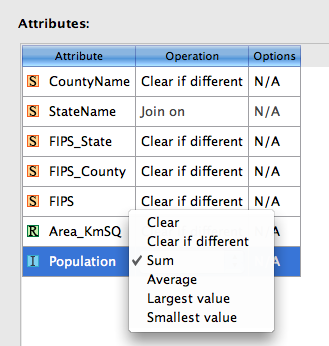
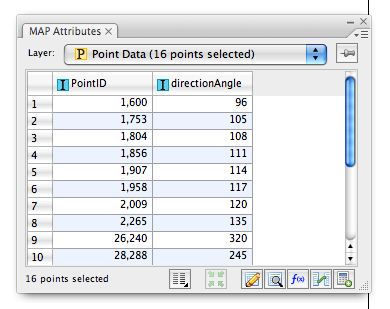
If I select one of the texts and look at its attributes, I’ll see that the attributes from the city point have been transferred to the text, including the X and Y attributes which hold the position of the original city point.

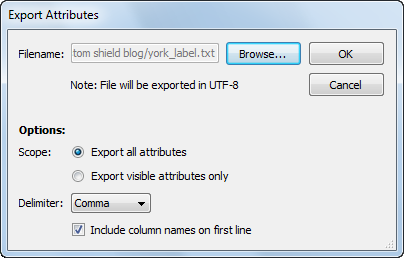
Next, I’ll remove the city points layer, select all city labels and use the Export Attributes option in the MAP Attributes panel:

This will export a comma-delimited text file (CSV). Make sure to check the “Field names on first line” option. It’s not exactly necessary, but it will make things a lot easier.

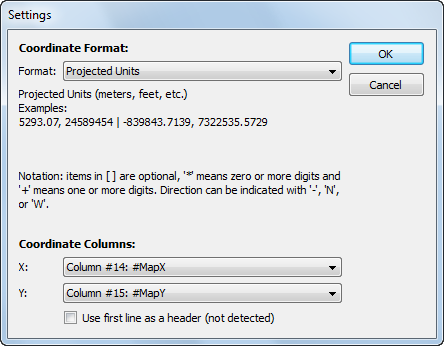
Import the CSV file back into MAPublisher. Make sure to specify that the projection of the data is the same as the existing MAP View. Once the data is imported, you can apply any existing Stylesheets that you had in place to style the cities, or create a new one. This way, you end up with just the symbols for the cities you’ve actually labeled.

New Join Areas feature in MAPublisher 8.4

The upcoming release of MAPublisher 8.4 introduces many new features. One of the new features is called Join Areas. We have received a lot of requests from our customers to create area objects by merging common attribute values. This geoprocessing function is generally known as “dissolve”.

The picture below shows polygon objects from a USA Counties layer. The goal is to create a layer with state boundaries and summing the population count by joining the objects of the counties layer.

USA County MAP

In the MAP Attributes panel of the USA Counties layer, every object of the counties layer contains attribute information including county name, state name, FIPS codes, area in km2, population and so on. We’ll be using the StateName attribute value to combine all the county polygons into one polygon per state.

MAP Attribute of the USA County layer

This is the new Join Area dialog box. On the left side, we’ll specify 1) target layer, 2) destination (output) layer, 3) join type and 4) join method. We are trying to create state boundaries from the counties target layer so we’ll select a join type based on the StateName attribute and output it to a new layer called USA States. The join will create compound paths and since our goal is to create state polygons, we’ll dissolve borders between adjacent sub-areas.

On the right side of the dialog box are attribute value operations available for each column. These operations determine what kind of the values will result for every attribute and the operations available are different for each data type (String, Real, Integer). The screenshot below shows the attribute value operation set to Sum for Population attribute (Integer data type). When the Join Area is complete, each state polygon will have the sum of the population of all the counties that belong to it.

After running the Join Areas function, county polygons are dissolved into state boundaries.

The population values show the total sum from all the counties for every state.

This is just one example of how Join Areas can be used. It was initially a feature request and with some discussion and planning, it became real. If you have any feature requests for MAPublisher, Geographic Imager or PDF Maps, please feel free to drop us a line at support@avenza.com. We’re happy to hear from all of you!

Making dashed lines intersect at every intersection in MAPublisher

One of the great advantages of using Adobe Illustrator for a mapping project is that you can make great line styles easily. For example, to make a double line stroke and one of them is dashed:

01: Double Stroke Line

Double strokes are a line graphic style where two different line strokes overlap each other. For example, the image shows that there is a stroke with a brown color and its stroke size is 3 pts. On top of this brown line, there is a 1 pt white dash line:

02: Double stroke lines with the settings shown in the appearance panel

You might have an experience where you duplicated one line layer and assigned a different style for lines in each of those layers. However, this has some disadvantages. The file size will increase because all the line segments as well as the attribute information attached to every line object is duplicated. Also, when you apply the double stroke line to road layer, the white dash line does not intersect nicely at every intersection of the map:

02: Double stroke problem

With Adobe Illustrator CS5, these problems are solved.

0) Create a graphic style like the one shown above.

1) Open the Pathfinder panel (Window > Pathfinder).

03: Pathfinder Tool

2) Select all the line objects in the line layer.
Click the outline tool 04: Pathfinder - outline tool .

This function in the Pathfinder tool breaks lines at every intersection.

03: Pathfinder - function: breaking lines at every intersection

All the selected objects which were selected at Step 2 will be broken into segments at every intersection and they will be grouped as one object in the layer.

04: Pathfinder result - all the objects are now grouped.

3) Having the grouped objects selected, apply the graphic style with the double stoke.

4) The white dashed line is intersected at every intersection nicely.
05: dashed lines intersect at every intersection

Quick tip

When creating double stroke, make sure to select the option trick tool “Align dashes to corners & path ends, adjusting length to fit” available next to the dash line option.

Note

Since this operation involves a pathfinder functions, the attribute information will not be matintained after the “outline” function is applied to those selected line works. Our development team is looking for a possible solution to keep the attribute information for the future version of MAPublisher.

Changing the Point Angle using Expressions and Attribute Values in MAPublisher

Here we have placed point symbols for a MAP Point layer. However, we want to change the point angle using the Attribute values.

Step 0: my point (not rotated)

Below is the attribute table for the point data shown above. The field directionAngle is the field containing the symbol rotation value. With MAPublisher, it’s possible to assign this value to every symbol in this layer.

step 1: Attribute data

Open the Edit Schema dialog box from the MAP Attribute panel. Find the field called #Rotation from the attribute field list. This #Rotation field is hidden/invisible by default. Click the Visible option to enable it and click OK.

MAP Attributes > Edit Schema

In the MAP Attributes panel, you can see that the #Rotation field shown. The values in this field is 0.00 degree for every point in the layer. We’ll assign the angle value from the directionAngle field to the #Rotation value .

MAP Attributes panel with the #Rotation field displayed

Open the Apply Expression dialog box from the MAP Attributes panel. Enter the column name directionAngle for the Expression and ensure that the value will be applied to the field #Rotation.

MAP Attributes panel > Apply Expression

Every value from the directionAngle field is now inherited by the #Rotation field.

MAP Attributes: Angle value assigned

As a result, the rotation angle is now applied to every point.

Point symbols after the angle values are assigned

The origin of the rotation is at each point’s registration point. With Adobe Illustrator CS4 and earlier, the registration point is set at the centre of the point symbol. With Adobe Illustrator CS5, the registration point can be flexibly placed. This will be discussed with some examples in a later topic. Stay tuned!

Working with Custom Highway Shield Symbols and Label Features

MAPublisher offers a variety of labelling options, ranging from the MAP Tagger tool used for hand labelling single pieces of art, the Label Features tool for automatic attribute labelling, and MAPublisher LabelPro™, a separately licensed advanced labelling engine.

MAPublisher LabelPro ships with nearly 100 highway shields from across North America into which attribute labels can be easily placed. Although LabelPro does not support adding custom symbols to its existing symbols library, the following instructions outline a manual method for adding a custom highway shield to your map, along with placing text on to this shield.

First we must setup our custom shield. This can be drawn in Adobe Illustrator, or produced from a pre-existing image brought into Illustrator using the File > Place menu option. For this exercise I have taken a highway shield I found online from York Region Ontario, and using Adobe Photoshop removed the highway number from the shield.

Working with MAPublisher for Adobe Illustrator

Once the shield is drawn and sized appropriately and placed in Illustrator, simply use the Selection Tool to drag the symbol into the Adobe Illustrator Symbols panel. Be sure to name the symbol, as you will need to access the symbol from a list later on; I named mine “York_Shield”

Our next step is to produce our feature labels. Using the Label Features tool, choose to label with the “Don’t follow line, create point text” option selected. Once the labels are placed on the map, use the Adobe Layers panel to select the labels and use the Paragraph panel or the Control Toolbar to centre justify the labels. This step is important for easily lining up our shields with the labels.

Label map features

We now need to create a point layer with a point corresponding to each label. This is easily done by using the MAP Attribute panel option menu to “Export Attributes..” of our newly created Feature Labels MAP Text Layer. Be sure to choose export all attributes under Options: Scope, and to check “Include column names on first line” as we will be using the hidden MAPX and MAPY attribute columns when importing this data back into the map as point data.

Export map attributes

Next, use the MAPublisher Simple Import tool to add the newly created .csv file of referenced attribute information. When prompted by the Settings dialog, choose the MAPX column as the column containng X coordinates, and MAPY for Y coordinates. Once the data is imported, if it has not been added to the MAP View containing your line and text layers, add it, and specify the coordinate system if necessary.

MAPublisher Settings

With the imported point data selected, open the MAP Attribute panel and right click a column heading to access the Show/Hide Columns > Show All option. double click the #Style column and change the style to your shield symbol. Use the Apply Expression tool in the option menu to apply the symbol to every item at once.

Apply expressions

Alternately, a MAP Stylesheet can be built to apply the symbol only to art with a specific range of attributes. In the Adobe layers panel move your label layer above your symbol layer.

If text and symbol do not line up as desired, the symbol geometry will need to be altered. If you are using CS5, doubble click the shield in the symbol panel to enter isolation mode, here you can drag the symbol to respecify the anchor point so that your symbol lines up as you would like it. If you are using CS3 or CS4, you will need to add some invisible art (no stroke/no fill) just below or above the symbol to adjust its extents, and where exactly the symbol’s centre point is located. As well, symbol and text rotation can be edited globally by changing the #Rotation attribute in the MAP Attributes panel.

MAPublisher highway shields

Buffer Art in MAPublisher

Up to MAPublisher 8.2, the MAPublisher Buffer Lines function was limited to only Line features. For MAPubisher 8.3, a revised buffer function called Buffer Art can be performed on both Line and Point layers. Buffer Art allows you to enter one fixed value to either all or the selected art in one layer or the values from an attribute column in one map layer.

Example 1: Applying a static value for the buffer width

Below is the new Buffer Art dialog box. I have one MAP Point layer with a location of a strong earthquake recorded in India n May 31, 2010.

Example with Buffer Art (1): Settings

I specified a value of 2100 Kilometer as the distance to buffer from the epicentre (the origin of the earthquake). The buffered art will be placed in the existing destination layer Buffer Area – 300 km interval.

For the buffered area, a pre-designed graphic style will be applied.

Lastly, I enabled the Add concentric circles every: option. This option will generate evenly spaced rings around the points within the buffered area. I am selecting 300 Kilometer for each concentric circle distance. It will generate seven concentric circles within the 2100 km buffer. As a result, you can see that a concentric ring is drawn every 300 km from the epicentre.

Example with Buffer Art (1): Result


Example 2: Applying values from an Attribute Column for the buffer width (Creating Graduated Symbols for every point)

I will use another point layer this time. I have one MAP Point layer with the point information of earthquake epicenters. The size of the buffer width in the page unit (pixel) was calculated based on the size of the magnitude for every point in the layer. Those values under the BufferCircle column will be used for the buffer width.

Example with Buffer Art (2): Calculated Buffer Width in the MAP Attribute panel

Now, the Buffer Art feature will be performed with those calculated values for the buffer width.

Example with Buffer Art (2):  Settings

The Attribute Value option is chosen and the BufferCircle field for the Buffer Width.

As a result, every buffered area (circle) has a different size. Also, the graphic style selected for the buffer art had some level of transparency applied. You can see the darker color when the buffered art overlaps each other. In other words, the region where the dark orange is observed experienced earthquakes more than once.

Example with Buffer Art (2): Result

Buffer Art can be applied to many situations such as around parcel lots, around road or highway lines or even creating them to find intersection proximity between map features. Experiment with your own to find out what is most useful for your own data.