My Account     Contact Us     Cart

Best Practices for Processing and Importing Maps into the Avenza Maps App

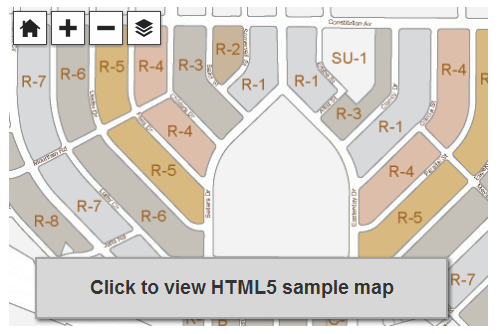
Avenza Maps is capable of importing and displaying georeferenced maps in several different formats. The app processes a map by rasterizing and tiling it on import. The speed and result of processing will vary depending on the type of file used and the size and dimensions. We’ll discuss the types of files allowed and the advantages of each.

Usually larger files take longer to process than smaller ones with some exceptions. An image may have a very high resolution but a small disk size due to image compression. It is recommended that images be less than 100 megapixels for upload to the app. A geospatial PDF file with many vector features may also take a long time to process. In this case, you should convert the file to an image to avoid having to rasterize vector data in the app.

Maps can be loaded into the app faster by processing them before import. Maps can also be preprocessed by uploading them to the Avenza Maps Store or using the Export to Avenza Maps tool in Geographic Imager or MAPublisher.

Comparison of Allowed File Types

GeoTIFF

A GeoTIFF is a TIFF file (Tagged Image File Format) with spatial information embedded in the file. This format is typically the preferred format for uploading directly to Avenza Maps without preprocessing. Since this is an image format, the app doesn’t need to rasterize the file on import meaning processing times will generally be faster compared to PDF’s, and it will maintain the native resolution.

It is also possible to import a normal TIFF file by zipping it with a TIFF World File (TFW) and either a WKT or PRJ file which contains projection information. It is best not to do this for the sake of simplicity. Usually, any GIS software that can produce a world file will also be able to save to GeoTIFF.

Geospatial PDF

A Geospatial PDF stores spatial data in either raster or vector format as well as associated attributes and layer information. Files should comply with the Adobe Acrobat PDF 1.7 specification which has been standard since 2006.

Avenza Maps rasterizes geospatial PDF files on import which discards layer and attribute information. PDF files typically take longer to process than image files. There is also a chance that the file may process incorrectly (e.g. discarding labels).

Despite this, there are some instances when it may be preferable to use a geospatial PDF file. For example, the map may already be in this format and isn’t worthwhile to convert to another format. Geospatial PDF files tend to be smaller than image files so they would be a good solution if device storage space or download speed is an issue. Also, occasionally converting from PDF to TIFF degrades the image quality and may make maps illegible.

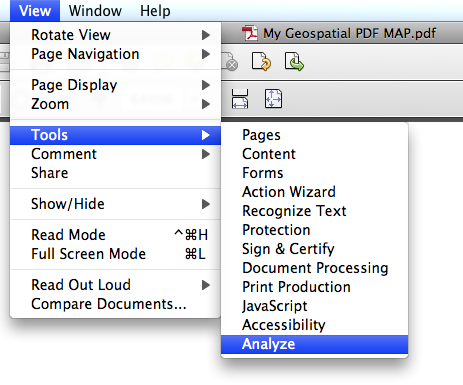
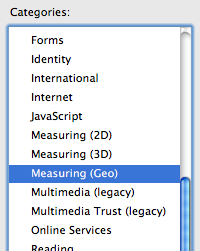
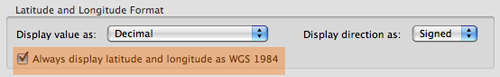
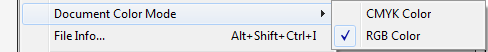
To ensure a geospatial PDF file has a good balance between size and quality, open the file in Adobe Acrobat and go to Advanced > PDF Optimizer. This is especially helpful if the map contains large raster images.

JPEG

JPEG is an image format like TIFF but it does not have the ability to store spatial information. To load a JPEG into Avenza Maps, it must be zipped with a JPEG World File (JGW) and either WKT or PRJ file. JPEG files are compressed so this may be an option to consider if file size is a consideration, however, a better alternative would be to compress a GeoTIFF file.

Processing Maps with MAPublisher, Geographic Imager, and the Map Store

It is best to process maps before loading them into the app because desktop computers are more powerful than mobile devices. It also avoids having to process the file each time the map is loaded onto a device. Geographic Imager and MAPublisher each have a utility to export to an Avenza Maps package with the capability to upload directly to the Avenza Map Store if you have a vendor account.

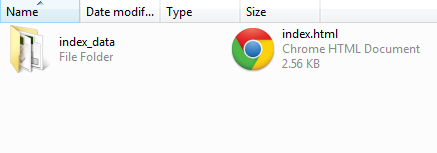
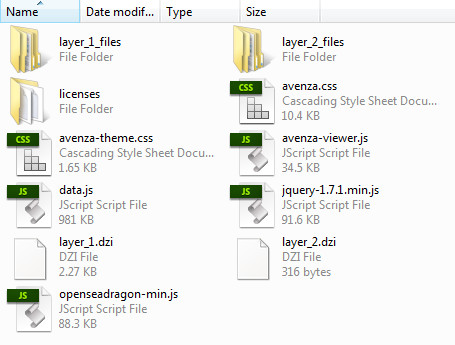
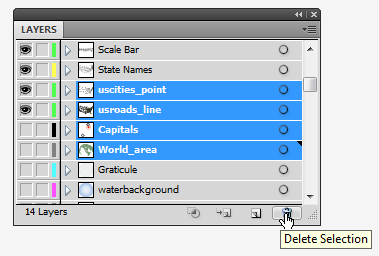
Running these utilities produces a folder that contains a ZIP file with a thumbnail to show a preview of the map, a reference file, and a folder called tiles that contains a tiled version of the map in PNG format. This ZIP file can be imported into the app in the same way as other files.

Uploading a map to the Avenza Map Store processes the map the same way. To use the store, register a vendor account on the Avenza Maps website.

Create HTML5 Maps with MAP Web Author in Adobe Illustrator and How to Embed Them on your Website


What is HTML5?

HTML5 is the current major revision of HTML (Hypertext Markup Language), the core markup language of the Internet. One of its major development goals was to reduce the need for proprietary, plug-ins such as Adobe Flash and to provide new graphics drawing abilities to the canvas element of HTML5. Scripting (e.g. JavaScript) is used to draw graphics, animations, and display other types of content. The potential of applications in online mapping with HTML5 technology varies widely including uses in fields such as cartography, GIS, demographics, and statistics.

Introduction to HTML5 Map Web Author

As maps become more detailed and data sources becoming richer, the way we present multiple data layers and map projections in dynamic map zoom levels and extents, traditional web mapping techniques start to become too limited. While many current web maps are rendered and served through a server, this could limit the amount of data provided and be slow to transfer as more and more tiles are served. MAP Web Author uses a technique to make maps from Adobe Illustrator compatible with browsers that support HTML5, specifically the canvas element. The maps exported using MAP Web Author are not server-side rendered, instead, they are rendered on-the-fly and content dynamically changes when the map is panned or the map zoom level is changed. This ultimately produces a more flexible, interactive and dynamic map. An HTML5 map also has more efficient storage and requires less space than other web map technologies. Stored vector map data (points, lines, and areas) is more efficient than raster tiles and can be displayed at any scale and even styled using CSS. Since HTML5 technology replaces browser plug-ins like Flash or Java, web maps generated by MAPublisher are accessible on Android, iOS, and Windows mobile devices (smartphones and tablets).

Files created from export

After exporting your map using MAP Web Author to HTML5 format, several files will be created. A ready to use index.html file and an index_data folder. The index.html file contains pre-formatted code necessary to view your map. In most instances, you can simply open the file in a browser to view the web map.

The index_data folder contains all of the necessary map layer data, JavaScript files, and CSS files to display your map.


How to embed an HTML5 web map into your site

The viewer will be embedded inside of a div element in your page (the “container div”). The map view will fill the container div.

For mobile specific sites we recommend setting the width and height of the container div to 100%, then using max-width and max-height to limit the width to the size of the map. The style should fit in the head, like this:

<style>
	#map_container {
		max-width: 479px; 
		width: 100%;
		max-height: 320px;
		height: 100%;
	}
</style>

For standard websites we recommend explicitly setting a width and height of the container div. The style should fit in the head, like this:

<style>
	#map_container {
		width: 479px; 
		height: 320px;
	}		
</style>

The following script tags must be included in the head tag as well. These scripts contain JavaScript functions that allow the map to function, like so:

<script src="index_data/jquery-1.7.1.min.js"></script>
<script src="index_data/openseadragon-min.js"></script>
<script src="index_data/avenza-viewer.js">lt;/script>

Keep note that the prefixUrl points to the directory where your map data is stored. It should be a relative path to avoid cross-site access errors. The id is used below in the body of your page.

<script>
	var avenzaViewer;
	$(function () {
		
		AVENZA.initialize();
		avenzaViewer = AVENZA.embedViewer({
			id: 'map_container',
			prefixUrl: 'index_data/'
		});
	});
</script>

Within the body tag, place the div element where appropriate. Specifying the div element id initiates the JavaScript to display the HTML5 web map. If a browser that is not compatible is used, then the message is displayed.

<div id="map_container">
	<div style="display:none">
		<!-- 
		The message below will appear instead of the map if 
		a user connects with a browser that does not support 
		enough HTML5 for the map viewer to function. You may 
		wish to customize the message for your site.
		-->
		A web browser that supports HTML5 is required in order 
		to view this content. If you are seeing this message 
		then your current web browser does not. 
 
		Please upgrade.
</div>


More information and sample HTML5 maps can be found in the MAP Web Author section.

MAPublisher FME Auto [VIDEO]

This video shows the great functionality of the MAPublisher FME Auto.

MAPublisher® FME Auto™ is a new add-on that connects the GIS data processing environment of FME Desktop to the cartographic design and publishing environment MAPublisher and Adobe Illustrator.

The MAPublisher FME Auto add-on was developed with Safe Software to support both FME Desktop and FFS (FME Feature Store) file format into Adobe Illustrator using MAPublisher. FME users can now effortlessly move their data from FME Desktop into the MAPublisher design environment to easily create stunning maps.

Visit our YouTube channel for more videos about the app and other Avenza products.

Geospatial PDF in Adobe Acrobat: Examining latitude and longitude values

After creating a map with MAPublisher or Geographic Imager, you might want to export it as a geospatial PDF file. You want to ensure that the georeference information of your Geospatial PDF files are correct before bringing them into the field for use. A great way to use geospatial PDF maps (and GeoTIFFs) is to load them onto an iPhone, iPad, or iPod touch with PDF Maps installed.

One way to check for georeference accuracy of geospatial PDF files is to use Adobe Acrobat. Open the “Analysis” tool from View > Tools > Analyze.

Adobe Acrobat: Opening Anlysis Tool

Click the “Geospatial Location Tool” from the Analyze panel.

With the Geospatial Location Tool enabled, you can see the latitude and longitude values of the map while you move the mouse over the opened Geospatial PDF file.

Geospatial PDF viewed in Adobe Acrobat

An important tip you should keep in mind: you need to set the preference option for this tool correctly depending on the coordinate system of the map in the geospatial PDF file.

Open the Preference dialog window:

Acrobat X on Windows: Edit > Preferences > General …
Acrobat X on Mac: Acrobat > Preferences …

In the Preference dialog window, find the preference category “Measuring (Geo)” from the list of categories.

Adobe Acrobat Preference dialog window

In the “Measuring (Geo)” category, take a look at the right side. There are many options for the georeferencing tool. One of the options is “Latitude and Longitude Format”. In this section, you have a checkbox option “Always display latitude and longitude as WGS 1984”.

Adobe Acrobat Preference option for Latitude Longitude Display

This option is very important. If the coordinate system of the map is “NAD 27 / UTM Zone 16 N”, which geodetic system would you like to have to show the latitude and longitude values in Adobe Acrobat? For example, if you are checking the latitude and longitude values in the WGS 1984 geodetic system, you should keep this option selected. However, if you are checking the latitude and longitude values in NAD 1927 geodetic system, then you should de-select this option. The difference in the distance at the same spot between two different geodetic systems may be small or large. If you would like to see the correct latitude and longitude values, you should be aware of this option.

Optimizing Adobe Illustrator Documents with MAPublisher for Geospatial PDF Export

Adobe Illustrator documents with GIS data can be exported to georeferenced PDF files thanks to the MAPublisher Export Geospatial PDF feature. A geospatial PDF is an Adobe Acrobat file that contains geospatial coordinates. With coordinates, users can view and interact with the PDF to find and mark location data. MAPublisher exports all the MAP Attributes data in an Adobe Illustrator document into the geospatial PDF. Attribute values can subsequently be accessed and searched in Acrobat 9 (and 8 with limitations).

In order to ensure the best interoperability and geospatial PDF output results from your MAPublisher documents, the following work practices are recommended:

Convert document color mode to RGB

To ensure predictable color results, it is highly recommended to convert the documents color mode to RGB prior to exporting to Geospatial PDF. This is advisable especially if generating geospatial PDF documents to be used in conjunction with the PDF Maps app for IOS devices. The document color mode can be changed in Adobe Illustrator through File > Document Color Mode > RGB Color.

Colour mode

Crop data to the required extents using the MAP Vector Crop Tool

Remove any extraneous data not required for the geospatial PDF document by cropping the map using the Vector Crop Tool (located in the Adobe Illustrator Toolbar). If necessary, exclude data from being cropped by locking the its the appropriate layers.

Vector crop

Remove unnecessary layers

Delete any map layers that are not required for the final PDF map document. This may include raster layers, hidden layers, and layers that are outside the mapping extent or art board. Not only will this decrease file size, it will also simplify your layers list and improve organization. Delete layers in the MAP Views panel or the Layers panel.

delete selection

Preserve data contained within sublayers

If your document contains map data organized within sublayers it will be necessary to reorganize/move this data to it’s parent layer if you wish to preserve it when converting to and from geospatial PDF. This is necessary because data contained on sublayers are forced into their parent layer by the Adobe Illustrator PDF exporter. Layers are also required for importing a geospatial PDF back into MAPublisher in order to assign a schema.

Remove unused attribute information

Data sets, especially those available through various data portals and government agencies can contain attribute information not suited or required for our mapping need, or perhaps we are only interested in the geometry of the data for representational purposes. In this case it is advisable to delete any attribute information that does not fulfill a purpose as this will unnecessarily increase the resultant file size. Select your data, open the MAP Attributes panel, and click the Edit Schema button. You may delete and organize your attributes using this panel.

Edit attribute schema

Assign MAPublisher attributes to Adobe Illustrator Object names

This recommendation is not necessary but may be useful in some cases. In MAPublisher the #Id attribute column is a unique identifier MAPublisher uses internally to associate attributes with unique pieces of art. By default the art will have a name of “path” or “compound path” however it may be desirable to tag the object with a unique identifier from an existing attribute column for the purposes of making it easier to differentiate art objects within the Acrobat tree list, for example.

To do this we can use the “Apply Expression” option in the MAP Attributes panel. Simply designate the #Name column as the “Apply to” option while entering the name of the attribute column you wish to derive the attributes from as the “Expression”. For example in the screeshot below we are renaming the art objects contained in the #name column with values stoed in the “ROUTE” column with the results being reflected in the artwork listed in Illustrator Layers panel.

Use the Simplify Line Tool

Reduce the number of vertices available in MAP Line and Area layers by using the Simplify Line tool (located on the MAPublisher toolbar). This differs from the Adobe Illustrator Simplify Path tool because it takes into account X and Y coordinates. The proximity value or simplification tolerance is based on the vertical difference between the begin-end line and points off a line, not the distance between anchor points on the line.

Simplify lines

Geospatial PDFs derived from or include images should be generated as 72 DPI

This has particular relevance when dealing with geospatial PDF files, especially those generated with Geographic Imager. When a 200 DPI (dots per inch) georeferenced image is converted to a geospatial PDF, the image will be embedded in the PDF as a 200 DPI image. However, when displayed by PDF viewing applications such as Acrobat or Illustrator it will appear as a 72 DPI image. Due to this, on export, MAPublisher converts the referencing to 72 DPI format since it must be imported back as 72 DPI

Geospatial PDF at 72 DPI

Following the above recommendations should help ease the transition of your MAPublisher documents to and from geospatial PDF.


Working with Custom Highway Shield Symbols and Label Features

MAPublisher offers a variety of labelling options, ranging from the MAP Tagger tool used for hand labelling single pieces of art, the Label Features tool for automatic attribute labelling, and MAPublisher LabelPro™, a separately licensed advanced labelling engine.

MAPublisher LabelPro ships with nearly 100 highway shields from across North America into which attribute labels can be easily placed. Although LabelPro does not support adding custom symbols to its existing symbols library, the following instructions outline a manual method for adding a custom highway shield to your map, along with placing text on to this shield.

First we must setup our custom shield. This can be drawn in Adobe Illustrator, or produced from a pre-existing image brought into Illustrator using the File > Place menu option. For this exercise I have taken a highway shield I found online from York Region Ontario, and using Adobe Photoshop removed the highway number from the shield.

Working with MAPublisher for Adobe Illustrator

Once the shield is drawn and sized appropriately and placed in Illustrator, simply use the Selection Tool to drag the symbol into the Adobe Illustrator Symbols panel. Be sure to name the symbol, as you will need to access the symbol from a list later on; I named mine “York_Shield”

Our next step is to produce our feature labels. Using the Label Features tool, choose to label with the “Don’t follow line, create point text” option selected. Once the labels are placed on the map, use the Adobe Layers panel to select the labels and use the Paragraph panel or the Control Toolbar to centre justify the labels. This step is important for easily lining up our shields with the labels.

Label map features

We now need to create a point layer with a point corresponding to each label. This is easily done by using the MAP Attribute panel option menu to “Export Attributes..” of our newly created Feature Labels MAP Text Layer. Be sure to choose export all attributes under Options: Scope, and to check “Include column names on first line” as we will be using the hidden MAPX and MAPY attribute columns when importing this data back into the map as point data.

Export map attributes

Next, use the MAPublisher Simple Import tool to add the newly created .csv file of referenced attribute information. When prompted by the Settings dialog, choose the MAPX column as the column containng X coordinates, and MAPY for Y coordinates. Once the data is imported, if it has not been added to the MAP View containing your line and text layers, add it, and specify the coordinate system if necessary.

MAPublisher Settings

With the imported point data selected, open the MAP Attribute panel and right click a column heading to access the Show/Hide Columns > Show All option. double click the #Style column and change the style to your shield symbol. Use the Apply Expression tool in the option menu to apply the symbol to every item at once.

Apply expressions

Alternately, a MAP Stylesheet can be built to apply the symbol only to art with a specific range of attributes. In the Adobe layers panel move your label layer above your symbol layer.

If text and symbol do not line up as desired, the symbol geometry will need to be altered. If you are using CS5, doubble click the shield in the symbol panel to enter isolation mode, here you can drag the symbol to respecify the anchor point so that your symbol lines up as you would like it. If you are using CS3 or CS4, you will need to add some invisible art (no stroke/no fill) just below or above the symbol to adjust its extents, and where exactly the symbol’s centre point is located. As well, symbol and text rotation can be edited globally by changing the #Rotation attribute in the MAP Attributes panel.

MAPublisher highway shields

News Archive