My Account     Contact Us     Cart

Quick Georeference Images with Geographic Imager

Sometimes we know enough about an image to georeference it in a faster manner than other images. In Geographic Imager, we call this type of georeferencing a Quick Georeference.

Quick Georeference is a method of georeferencing images that requires two conditions to be met:

  1. The image is not rotated; in other words, true north is oriented at the top of the page
  2. Two control points on the image are known, however these points cannot be aligned on either the X or Y axis

This article will show an example of quick georeferencing. The image used in this demonstration is called Americas_4.tif, and can be found in the Tutorial Data folder which is included with every installation of Geographic Imager.

After opening the image in Geographic Imager, you can confirm that it is aligned with true north. Then click the Georeference button on the Geographic Imager panel.

In the Georeference dialog box, you can click the Add Control Point button to do as such. Click anywhere on the image viewer to add a point. Point 1 will be added to the control point list. You can then adjust the pixel coordinates (PX and PY); these are the coordinates for the points on the image. Type 599 in the PX box and 0 in the PY box.

Next, you want to set the world coordinates that correspond to the pixel coordinates you just entered. You can double-click in the WX, WY or Coordinate System boxes to open the Edit Location dialog box. Here you want to select the WGS 84 coordinate system, and enter a Lat value of 35.917 and Long value of -50.064. After clicking OK, you will see that the world coordinates have been updated in the control point list.

You now want to add your second control point at the location with pixel coordinates of PX = 0 and PY = 456. Following the above steps again, give this point the world coordinates of Lat = 6.731 and Long = -88.417.

Now that you have added your two necessary control points to the image, you are ready to Quick Georeference your image. Next to the Image Coordinate System label, select the Specify… link. In the Choose Coordinate System dialog box, select the [No Coordinate System Specified] link. This opens the Specify Coordinate System dialog box, where you can select the Geodetic > World category, select the “WGS 84” coordinate system and click OK.

Back in the Georeference dialog box, select the Quick Georeference button (lightning bolt icon), and select By Two Reference Points (North/South aligned). You will notice that an additional control point is automatically added to the control point list and image view. Its world coordinates were calculated based on the existing two control point pairs. This occurs because a minimum of three control points are required to reference an image. It is also why the two control points you selected must not align.

To complete your Quick Georeference, simply click OK. Voilà! You will see the reference information appear in the Geographic Imager panel, and further details can be found in the Geographic Imager: General panel.

You can also check out our video tutorial for Quick Georeferencing on YouTube:

To view the step-by-step instructions that constituted the material in this blog post, check out the Quick Georeference tutorial in our Support Centre!

Avenza Releases Geographic Imager 6.4 for Adobe Photoshop

Toronto, ON, September 20th, 2021 – Avenza Systems Inc., producers of the Avenza Maps® app for mobile devices and geospatial plugins for Adobe® Creative Cloud®, including MAPublisher® for Adobe Illustrator®, is pleased to announce the release of Geographic Imager® 6.4 for Adobe Photoshop®. This latest version is fully compatible with the most recent version of Adobe Photoshop 2021 and introduces the ability to store embedded georeferencing within the saved Photoshop document format. Geographic Imager 6.4 also brings forward scripting support for the export of point, text, and vector layers, updated map store upload options, coordinate system updates, and a host of bug fixes and engine enhancements.

Enriching the Geospatial Image Editing Process

Geographic Imager for Adobe Photoshop delivers an all-encompassing solution to import, edit, and export geospatial images such as aerial and satellite imagery. Work with digital elevation models, GeoTIFFs, and other popular GIS image formats while using Adobe Photoshop features such as transparencies, filters, cropping, and image adjustments; all while maintaining georeferencing and support for hundreds of coordinate systems and projections.

New features of the Geographic Imager 6.4 plugin for Adobe Photoshop include:

  • Georeferenced Photoshop documents: Users can now store embedded georeferencing within a saved PSD/PSB. This reduces the need for retaining separate or external reference files.
  • Scripting support for export of vector layers: This will allow the export of vector layers, points, and text to be recorded as actions and provides functionality to script these processes.
  • New Avenza Map Store categories: The new categories used for browsing maps on the Avenza Map Store have been added when using the  ‘Upload to Avenza Map Store” functionality.
  • Updated coordinate systems: Engine enhancements including an updated coordinate system library.

Geographic Imager 6.4 is immediately available and free of charge to all current Geographic Imager Maintenance Program members and starts at US$349 for non-maintenance upgrades. New fixed licenses start at US$749. Geographic Imager Basic Edition licenses start at US$99. Academic, floating, and volume license pricing is also available. For more information, visit www.avenza.com/geographic-imager.

More about Avenza Systems Inc.

Avenza Systems Inc. is an award-winning, privately held corporation that provides cartographers and GIS professionals with powerful software tools to make better maps. In addition to desktop mapping software, Avenza offers the mobile Avenza Maps app to sell, purchase, distribute, and use maps on iOS and Android devices. For more information, visit www.avenza.com.

For further information contact:  416-487-5116 – info@avenza.comwww.avenza.com

What’s new in Geographic Imager 6.4

What’s New in Geographic Imager 6.4

Avenza is pleased to announce the release of Geographic Imager® 6.4 for Adobe Photoshop®. This version is fully compatible with the latest version of Adobe Photoshop 2021. The release also introduces the ability to retain embedded georeferencing within saved Photoshop documents. We are also excited to provide scripting support for the export of point, text, and vector layers, updated map store upload options, new coordinate system support, and a host of bug fixes and engine enhancements.

Here is what you can expect with the latest Geographic Imager 6.4 release:

Georeferenced Photoshop Documents and Photoshop BIG files

We know that easily and efficiently importing and processing georeferenced imagery data directly within Adobe Photoshop make Geographic Imager the go-to platform for your imagery editing needs. With the release of Geographic Imager 6.4, working with georeferenced imagery is now simpler than ever. We have introduced the ability to retain embedded georeferencing information directly within a saved Photoshop Document (PSD). Geographic Imager will now store, and automatically read georeferencing specifications upon opening Photoshop documents. This reduces the need to retain an external reference file and means users will not have to specify this source reference information upon opening the file. Embedded georeferencing now works with all support images contained in Photoshop Documents, as well as very large georeferenced images contained in Photoshop BIG (PSB) files.

Upload Options: Avenza Map Store Categories

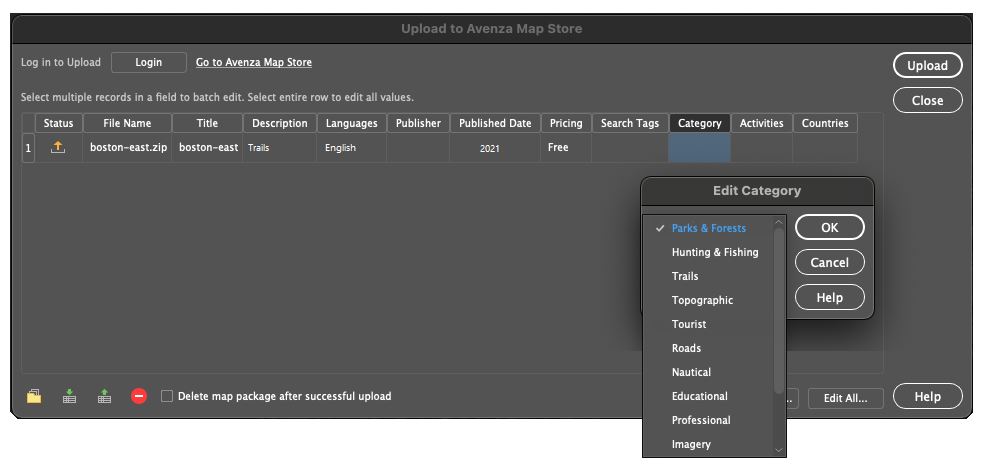
For users wishing to share or sell their maps on the Avenza Map Store, we have updated the “Upload to the Avenza Map Store” options to include the new Map Store categories. Map Store categories such as Parks & Forests, Trails, and Topographic are organized to enhance the search experience on the Map Store and ensure your high-quality map products reach the right users. When exporting from Geographic Imager to the Avenza Map Store, users will be provided an option to select one of 13 specific categories.

Scripting Support for Exporting Vector Layers

For handling repetitive imagery processing tasks, our users often employ the already powerful automation and scripting tools available in Adobe Photoshop. With Geographic Imager 6.4, we have introduced scripting capabilities for exporting vector layers. This means exporting vector points, lines, polygons, and text within Geographic Imager can now be recorded in the Adobe Photoshop Action panel. This new functionality allows users to script and automate export processes for their geospatial imagery.

Improved Coordinate System Library

For this release, we worked to improve the Geographic Imager engine that ensures our users can continue their work in a truly seamless, powerful, efficient, geospatial image-editing environment. This release includes performance enhancements, user interface improvements, and a host of bug fixes. Additionally, we have built on our existing coordinate system catalog with the addition of several new and updated projection and coordinate systems. These exciting additions include the Natural Earth and Natural Earth 2 Projections created by Tom Patterson. 

Get it today!

All active maintenance subscribers can upgrade to Geographic Imager 6.4 today for free. Users who don’t have active maintenance or are on a previous Geographic Imager version can still upgrade.

Mapping Class: Georeferencing Techniques Part Two – Working with Scanned Maps, with Hans van der Maarel

Welcome back to another exciting edition of Mapping Class, a video-blog series where we curate tutorials and workflows created by expert cartographers and Avenza power users from around the world. Today we release Part Two of our Georeferencing Techniques tutorial with Hans van der Maarel, owner of Red Geographics. In Part Two, Hans demonstrates some techniques he has developed for working with more challenging georeferencing tasks, including dealing with unknown projection information and working with scanned maps. If you missed Part One, in which Hans covers the basics of Georeferencing in MAPublisher, check it out here.

Hans has produced a jam-packed video walkthrough detailing his georeferencing process. The Avenza team has produced video notes (below) to help you follow along.

***

Georeferencing Techniques Part Two: Working with Scanned Maps
by Hans van der Maarel (video notes by the Avenza team)

As we discussed in last month’s Mapping Class, georeferencing is the process of taking imagery or map data that lacks geographic location information and associating it with specific coordinates on Earth. Previously, Hans showed us how MAPublisher provides a few tools that make georeferencing simple vector map data a painless process (Check out part one here!). Best of all, using the built-in georeferencing tools, this can be done entirely within the Adobe Illustrator environment.

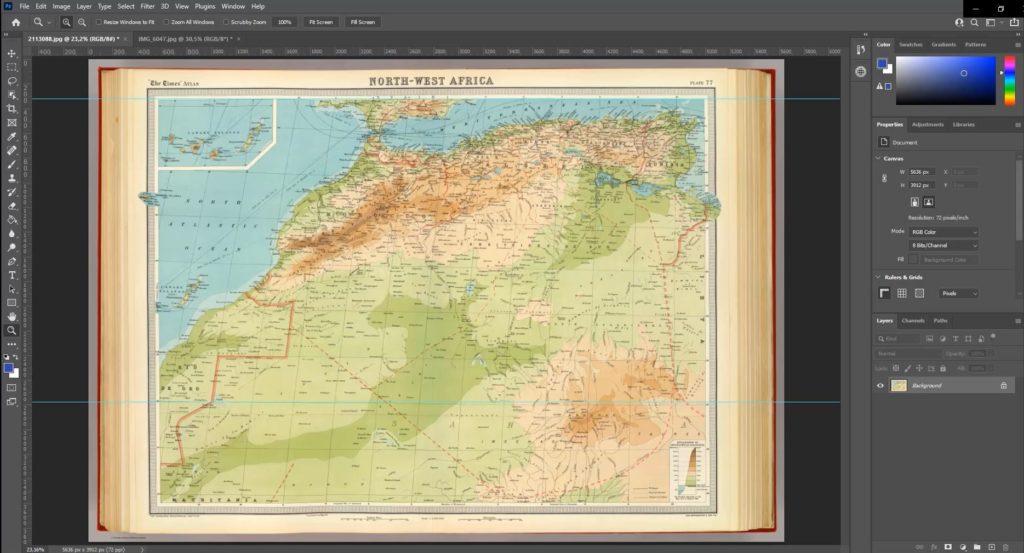
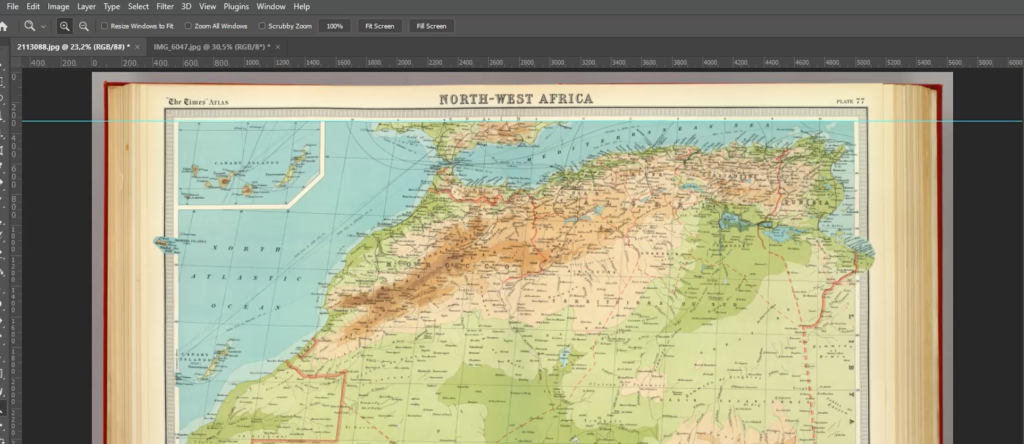
However, what can you do if you are working with historical maps or scanned images that lack spatial referencing or detailed projection information? This can present a challenge for many cartographers, as the projection information is necessary to create an effective cartographic product that will minimize distortion and maximize the spatial accuracy of the final result. To tackle this problem, Hans shares a series of tips and tricks that he uses for working with scanned historical maps. He uses a beautiful historical map of Northwest Africa to demonstrate his approach.

Right away, Hans identifies a few obstacles. First, he notices that the scan is not a perfect copy of the original map. Due to natural curves and bends in the physical paper version of the map, there is minor distortion in the digital image that arose when the map was scanned. This could create problems for georeferencing the image, as the “fitting” process can be susceptible to image distortions, even when a suitable projection is determined. Thus it is always a good idea to examine your scanned map prior to beginning the georeferencing process. Becoming aware of potential issues with the scanned map data can help inform decisions on the data’s suitability for a particular mapping task. Acknowledging that the distortion is relatively minor in this scanned map, Hans chooses to proceed with the georeferencing process.

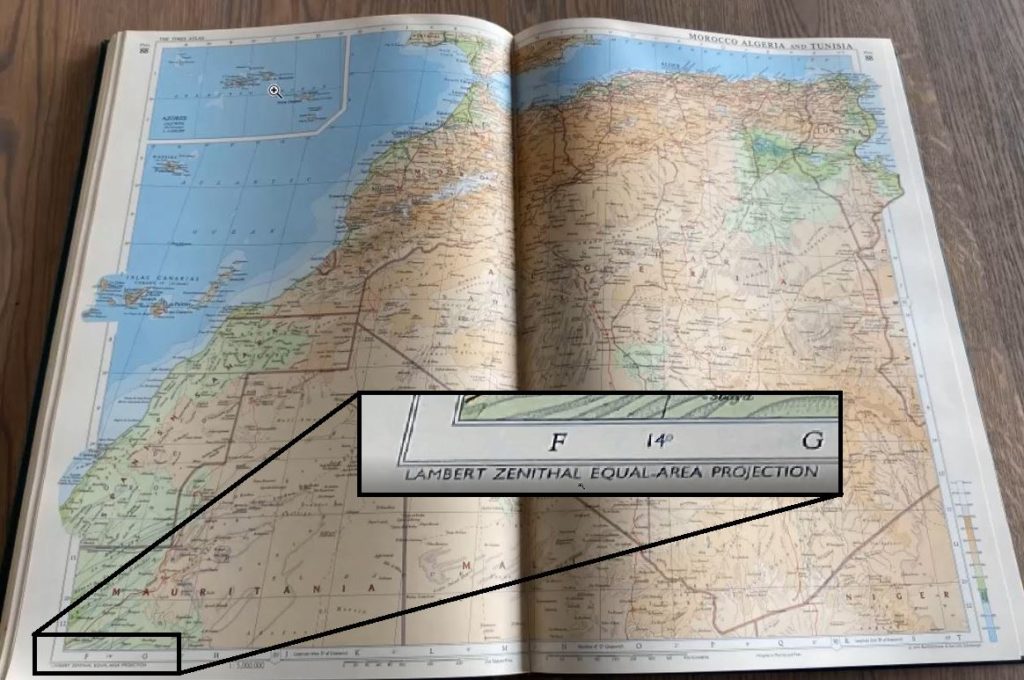
Hans notices that the scanned map image does not provide any details on the original projection information. Instead, Hans must make an “educated guess” on which projection was being used. With a bit of research, he discovers another map from roughly the same era and displaying a similar region. Recognizing the similarities between this map, and his scanned map, Hans decides to implement a Lambert Zenithal (Azimuthal) Equal Area Projection.

Hans discovered this map from 1968, which displays approximately the same area. He chooses to use the projection information from this map to help with the georeferencing process of his scanned map.

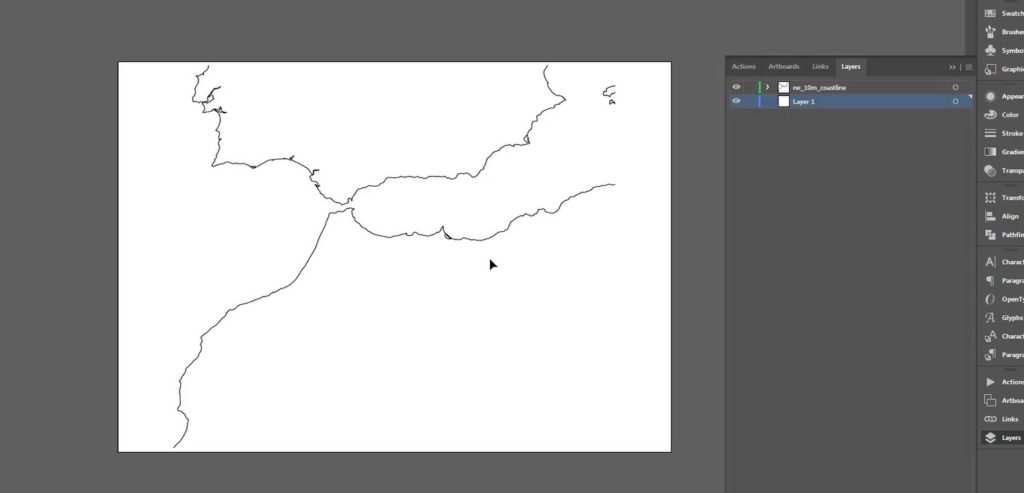
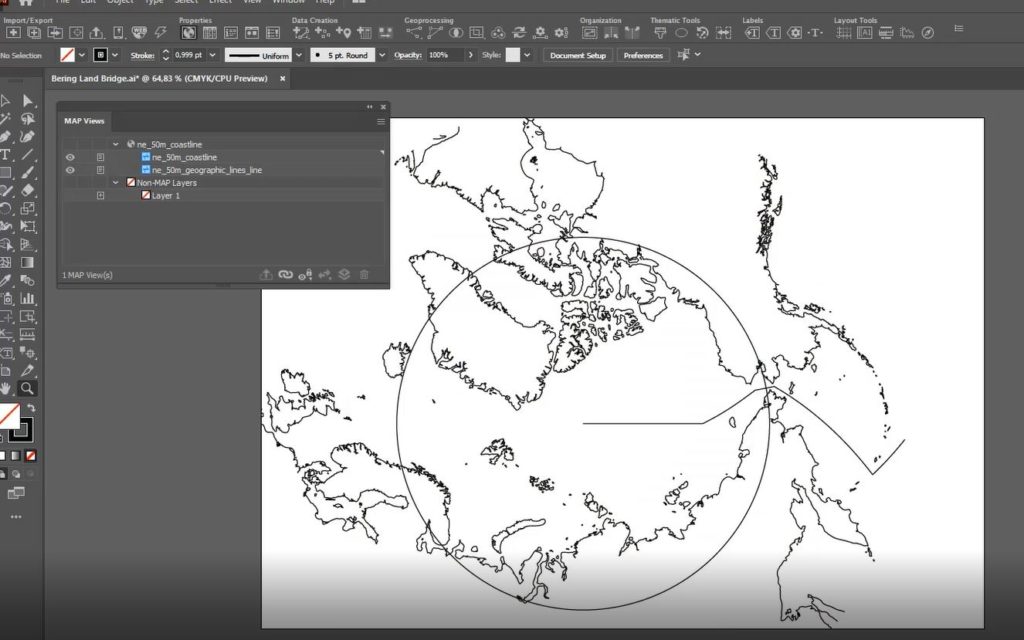
Hans can begin his georeferencing process by first setting up a new MAP View with the Lambert Azimuthal Equal Area Projection, a conical projection used in many atlas-style maps. To help with the georeferencing process, Hans has used the Import tool to display a vector line layer of coastlines using Natural Earth DataHe can use this coastline data as a guide to help align his scanned map during the georeferencing process.

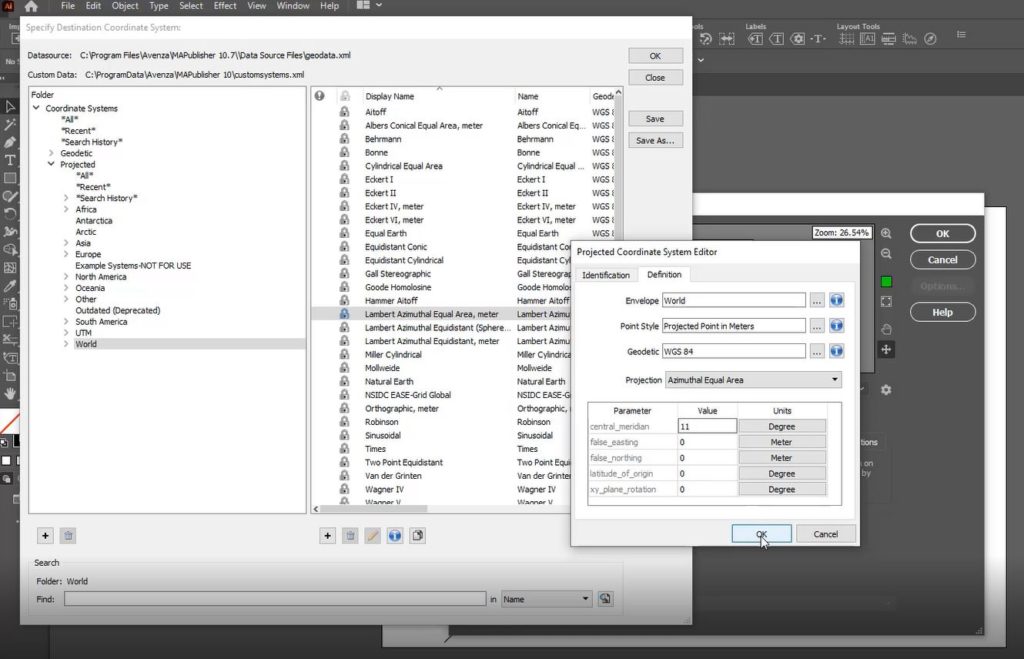
Before moving on, Hans brings up two important things one must consider when working with conical projections: the central meridian and the latitude of origin. When working with scanned maps that include graticule lines, a quick and easy way to help identify the central meridian is to look for the meridian line that closest approximates a straight line. Using the graticules on the scanned map, Hans can approximate a central meridian of about 11 Degrees. In the MAP View Editor, a user can open the projected Coordinate System Editor and modify the definition for the lambert azimuthal equal-area projection to have a central meridian that matches his estimation.

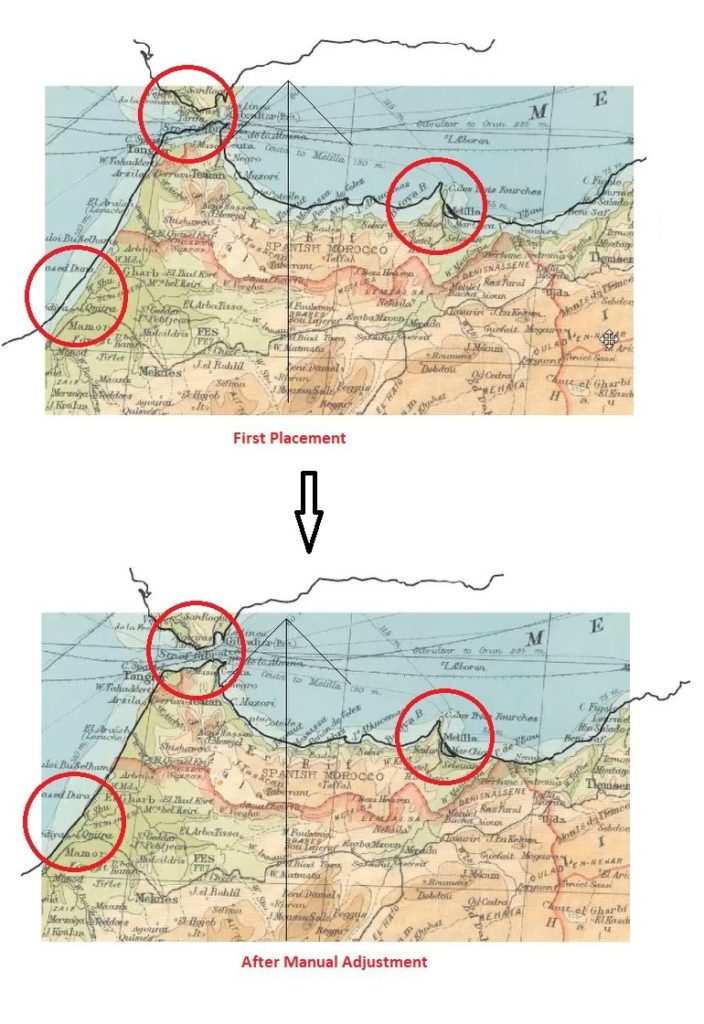
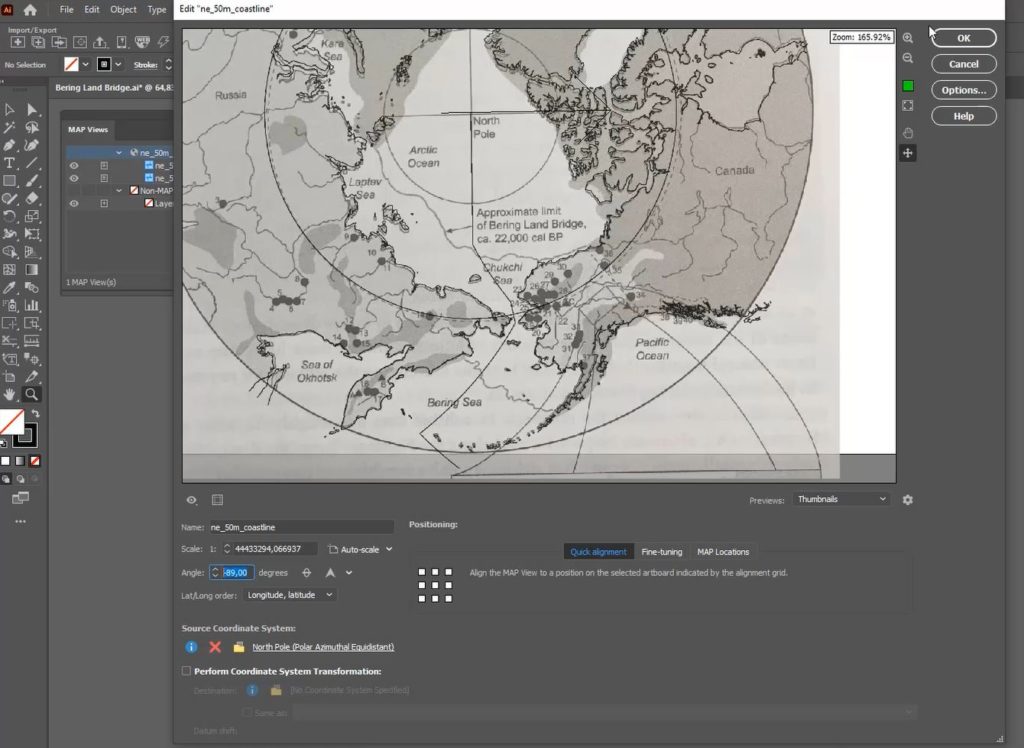
Placing the scanned map layer onto his newly modified MAP view, Hans can then begin the process of manually aligning the map image to match his projected coastline data. One of the easiest ways to support this process is to configure the MAP View editor panel to display layer thumbnails. With this configured, a user can begin manually adjusting the MAP layers until they are suitably aligned.

Hans reiterates that this process is not an exact science. He has made several assumptions on the projection parameters, and the overall accuracy of the original map. He indicates that a user should spend some time trying to get the best possible result, however it will be difficult to achieve a perfect match (especially given the distortions that can occur when a map is scanned from a physical copy). This process can take anywhere from minutes to hours, and requires a lot of manual adjustment, trial and error, and most importantly, patience! The result, however, is that the finalized scanned map layer is correctly projected and georeferenced into a MAP view. From here, adding data layers, annotations, labels, or tracing vector layers from the scanned map can all be completed in a spatially aware mapping environment.

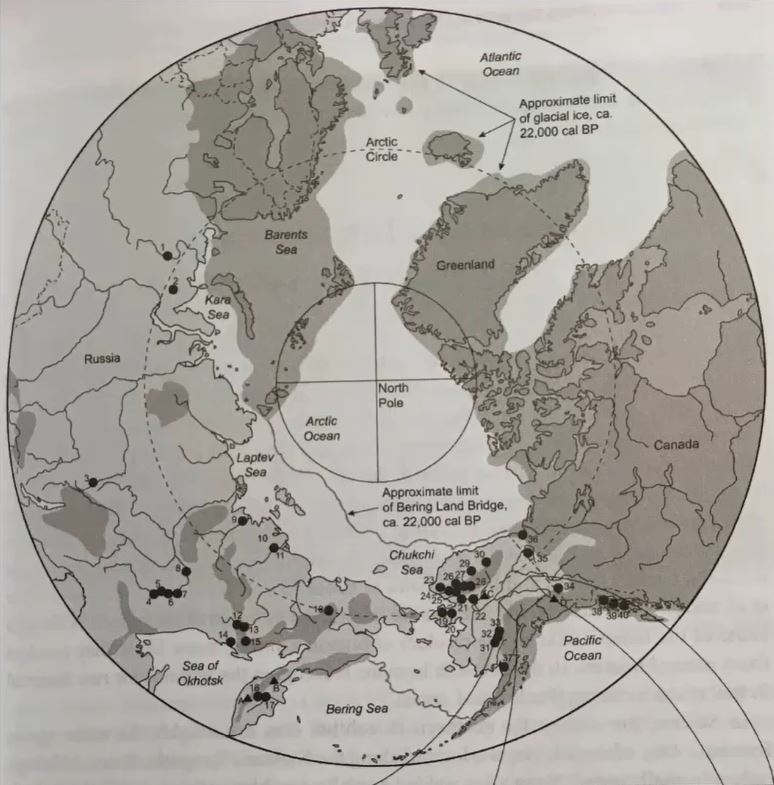
Providing a second example using a slightly different approach, this time Hans uses a map of the Arctic Region. He indicates that although he has been provided with a map of the entire polar region, the client is only interested in the area surrounding the Bering Strait (between Russia and Alaska). As with the previous example, the first step is to identify the best projection to use. Hans correctly guesses that the map provided likely uses the Polar Azimuthal Equidistant Projection based on visual inspection. However, it should be noted that there is room for trial and error here, and users should not be afraid to explore the large coordinate system and projections library included with MAPublisher to try out and test different projections to help narrow down one that fits best.

The first thing Hans notices is that the scanned map image is rotated about -90 Degrees from what is displayed in his reference coastline data. Once again, by visiting the MAP View Editor, Hans can rotate his Map layers without breaking the spatial referencing information of his original map data. By doing this, Hans assures that his map layers are aligned on the same rotational angle, and can then begin to focus on scaling the layers.

Hans uses the MAP view editor panel to apply manual adjustments to the map layers. He notes that a cartographer should always consider the area of the map they are most interested in. For example, although his map covers the entire polar region, Hans indicates the final product will only display the regions surrounding the Bering Strait. Given this, the georeferencing process should be primarily concerned with accurate alignment in the Bering Strait area, while distortion in other areas is seen as acceptable.  In the example below, you can see how Hans has achieved a suitable level of georeferencing accuracy in his primary area of interest, despite the non-important areas (i.e the Canadian Polar region, eastern Siberia, Greenland) having relatively low georeferencing accuracy.

With his newly georeferenced scanned map layers. A cartographer can now use the information contained within these scans to supplement a larger cartographic process. For example, Hans can now use the scanned maps to digitize boundaries, or geographic features that may not be present in modern digital datasets (for example, historical boundaries for different countries, or terrain features that are no longer present)

***

About the Author

Hans van der Maarel is the owner of Red Geographics, located in Zevenbergen, Netherlands. Red Geographics is a long-time partner of Avenza and Hans is a well-known power user of both MAPublisher and Geographic Imager. He uses the products for a wide range of cartographic projects for several international organizations and offers training courses and consultancy expertise aimed at developing workflows for clients. In addition to that, he is currently a board member of NACIS. To find out more about Red Geographics, and to see more work by Hans, visit redgeographics.com

Mapping Class: Georeferencing Techniques Part One – The Basics, with Hans van der Maarel

Welcome back to another exciting edition of Mapping Class, a new video-blog series where we curate tutorials and workflows created by expert cartographers and Avenza power users from around the world. For this article, we are excited to introduce Hans van der Maarel, owner of Red Geographics, and expert cartographer. Joining us from Netherlands, Hans has put together a video tutorial showcasing tips and tricks for tackling Georeferencing in a variety of different mapping scenarios. In this first part, Hans goes over the basics of georeferencing in MAPublisher, using a neat city map of Zevenbergen. Tune in for Part Two, coming soon, which will reveal how Hans approaches more challenging georeferencing tasks, including dealing with unknown projection information and working with historical maps.

Hans has produced a short video walkthrough detailing part one of his georeferencing process. The Avenza team has produced video notes (below) to help you follow along.

***

Georeferencing Techniques Part One: The Basics
by Hans van der Maarel (video notes by the Avenza team)

Georeferencing is the process of taking imagery or map data that lacks geographic location information and associating it with specific coordinates on Earth. Georeferencing is a very common, but sometimes challenging step that is necessary for producing accurate, meaningful cartographic products. By georeferencing map data, cartographers can ensure that the features on their maps are located correctly, and in a way that accurately represents the real world. Georeferencing also makes it easy to add and update maps with new data layers, as location information stored within the new map layers will be accurately overlaid in the correct position on older map projects. The process for georeferencing maps can be complicated, but Hans has outlined some easy-to-follow steps for quickly performing and validating simple georeferencing tasks with vector map data.

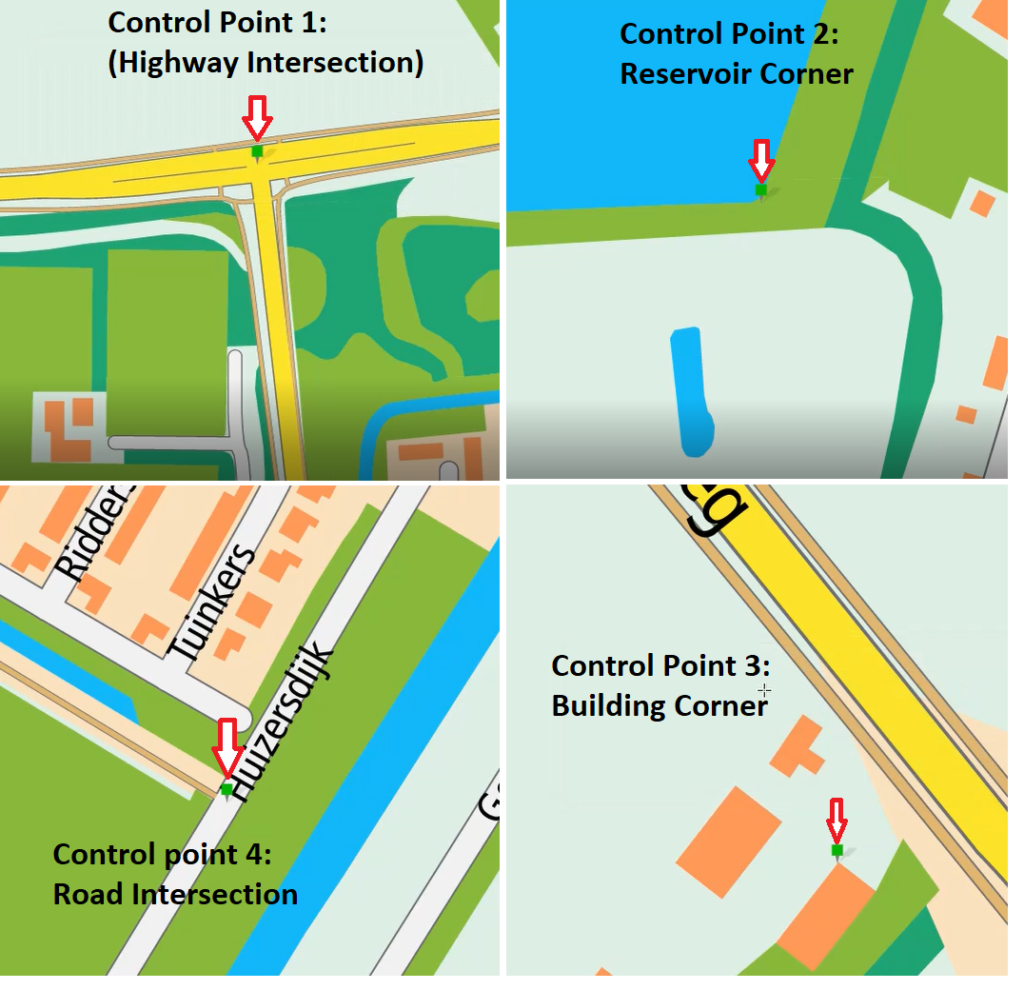
In general, effective georeferencing needs to include at minimum three known control points. In this example, Hans has included an additional fourth control point to provide additional accuracy. 

When locating control points, it is a good idea to choose points that roughly approximate the four corners (quadrants) of your map area. Doing so can ensure the georeferencing result is accurate for the entire coverage of the map area and minimizes distortion/shearing effects as the map layers are matched to the final coordinate system. Cartographers should take time to ensure the chosen control points are as accurate as possible, as errors in control point placement will propagate across all locations in the map. Poor control point placement can lead to overall poor georeferencing accuracy. 

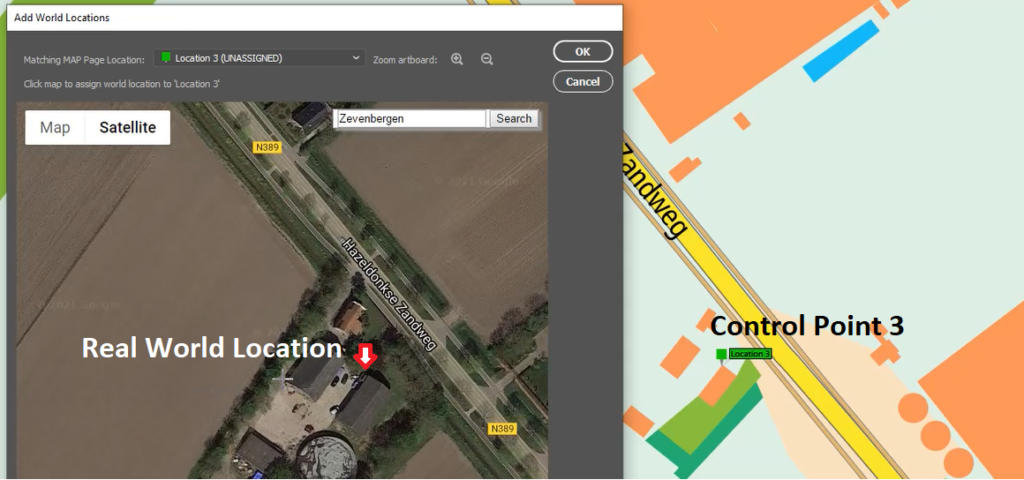
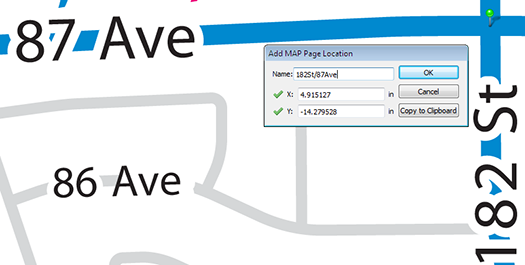
Using the MAP Page location tool, place four control points at known, easily identifiable locations. Hans recommends placing control points at recognizable map features that can be easily seen on the reference imagery. For this example, Hans chose to use the corners and edges of major structures (i.e larger buildings/reservoirs) or the centers of well-known major road intersections. When using road features as reference control points, Hans recommends using the center of the feature rather than the edge. This can compensate for variation in road edge placement that can occur when the vector line layer does not completely match the true road/lane width in the imagery.

Mapping Class Georeferencing control point

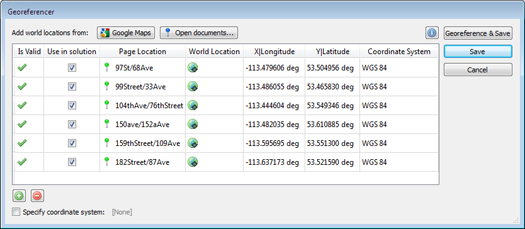
Next, open the Georeferencing tool and select the “Add World Locations” option. From here, use the built-in web map to calculate latitude/longitude coordinates for each of your known control points. Using the satellite imagery view can make this process easier, especially when dealing with physical features on the map (i.e building corners). Repeat this for each of the four control points.

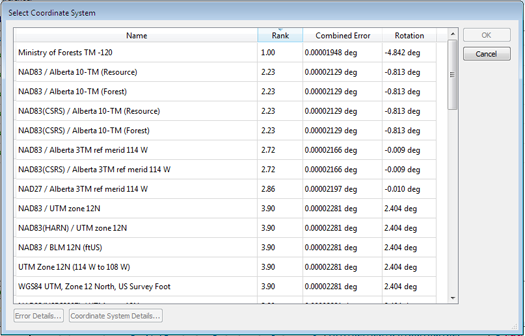
The resulting table will show a list of set coordinates for each of these control points. From here, if you already know the projection the map data is already in, you may set this coordinate system at this stage. If you are unsure, the georeferencer tool will automatically provide a suggested list of coordinate systems that match the control points you have set. These “best” matches are provided based on measuring the error between your user set coordinates and the real-world locations on the web map. Ideally, you want the lowest combined error value. In general, the suggested coordinate systems at the top of the list are often the best choice.

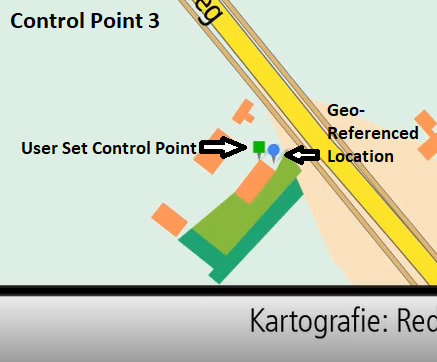
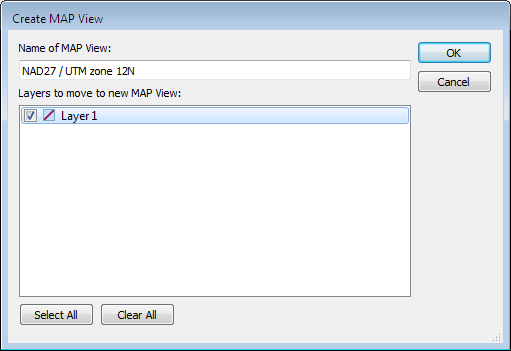
Once you select the desired coordinate system, the tool will automatically create a new MAP View where you can house your newly georeferenced map data. You will notice that the MAP Page Locations you created earlier will be displayed alongside the newly georeference control points. This is a great way to help validate your georeferencing as you will be able to observe the accuracy (or inaccuracy) of your placed control points.

Finally, it is a good idea to use the Find Places tool to validate your georeferencing results. Try searching for identifiable landmarks or major features on your map (i.e. train stations). Simply search for a location using the Find Places tool, and compare this to the georeferenced locations on your map.

This concludes Part One of “Georeferencing Techniques with Hans van der Maarel“. Now that you have covered the basics of Georeferencing in MAPublisher, tune in for part two in the next edition of Mapping Class. There you will see how Hans tackles more complex georeferencing projects, including what to do when you have small-scale maps that come from scanned or printed images, or where projection or referencing information is unavailable. Hans will be using a beautiful historical map of northwest Africa to demonstrate this problem. Look for it in the Avenza Resources Blog next month.

***

About the Author

Hans van der Maarel is the owner of Red Geographics, located in Zevenbergen, Netherlands. Red Geographics is a long-time partner of Avenza and Hans is a well-known power user of both MAPublisher and Geographic Imager. He uses the products for a wide range of cartographic projects for several international organizations and offers training courses and consultancy expertise aimed at developing workflows for clients. In addition to that, he is currently a board member of NACIS. To find out more about Red Geographics, and to see more work by Hans, visit redgeographics.com

7 GIS terms To Know: Map Making for Designers

Many of our MAPublisher clients are cartographers and GIS professionals, but a growing number are graphic designers who are tired of the tedious work of making maps without specialized tools. Making a map is part art and part science and while we help bridge the gap between Geographic Information Systems (the science) and graphic design (the art), as a graphic designer, you may not be familiar with the wonderful world of GIS.

So on this GIS Day, we have compiled the definitions to a few common GIS terms that you may encounter; GIS Day, celebrated each year, in November to help educate non-GIS professionals about the importance of geospatial information systems and the benefits that GIS brings to our lives.

1. Spatial Analysis

Any good and useful design involves analysis. This process of stacking layers, inspecting and interpreting model results seeks to solve complex location-oriented problems. This can be used for predictive analysis, estimating the level of suitability and for further understanding of the geographic location. 

spatial analysis

2. Layer 

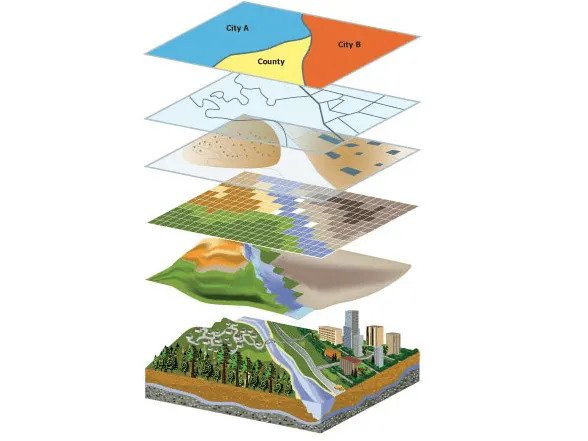
Maps contain several layers, each representing a set of spatial features. Layers are laid atop one another for viewing or spatial analysis. This lends itself to working with the map layers in Illustrator, as they can be treated similarly to a layer containing artwork.  

3. Attributes

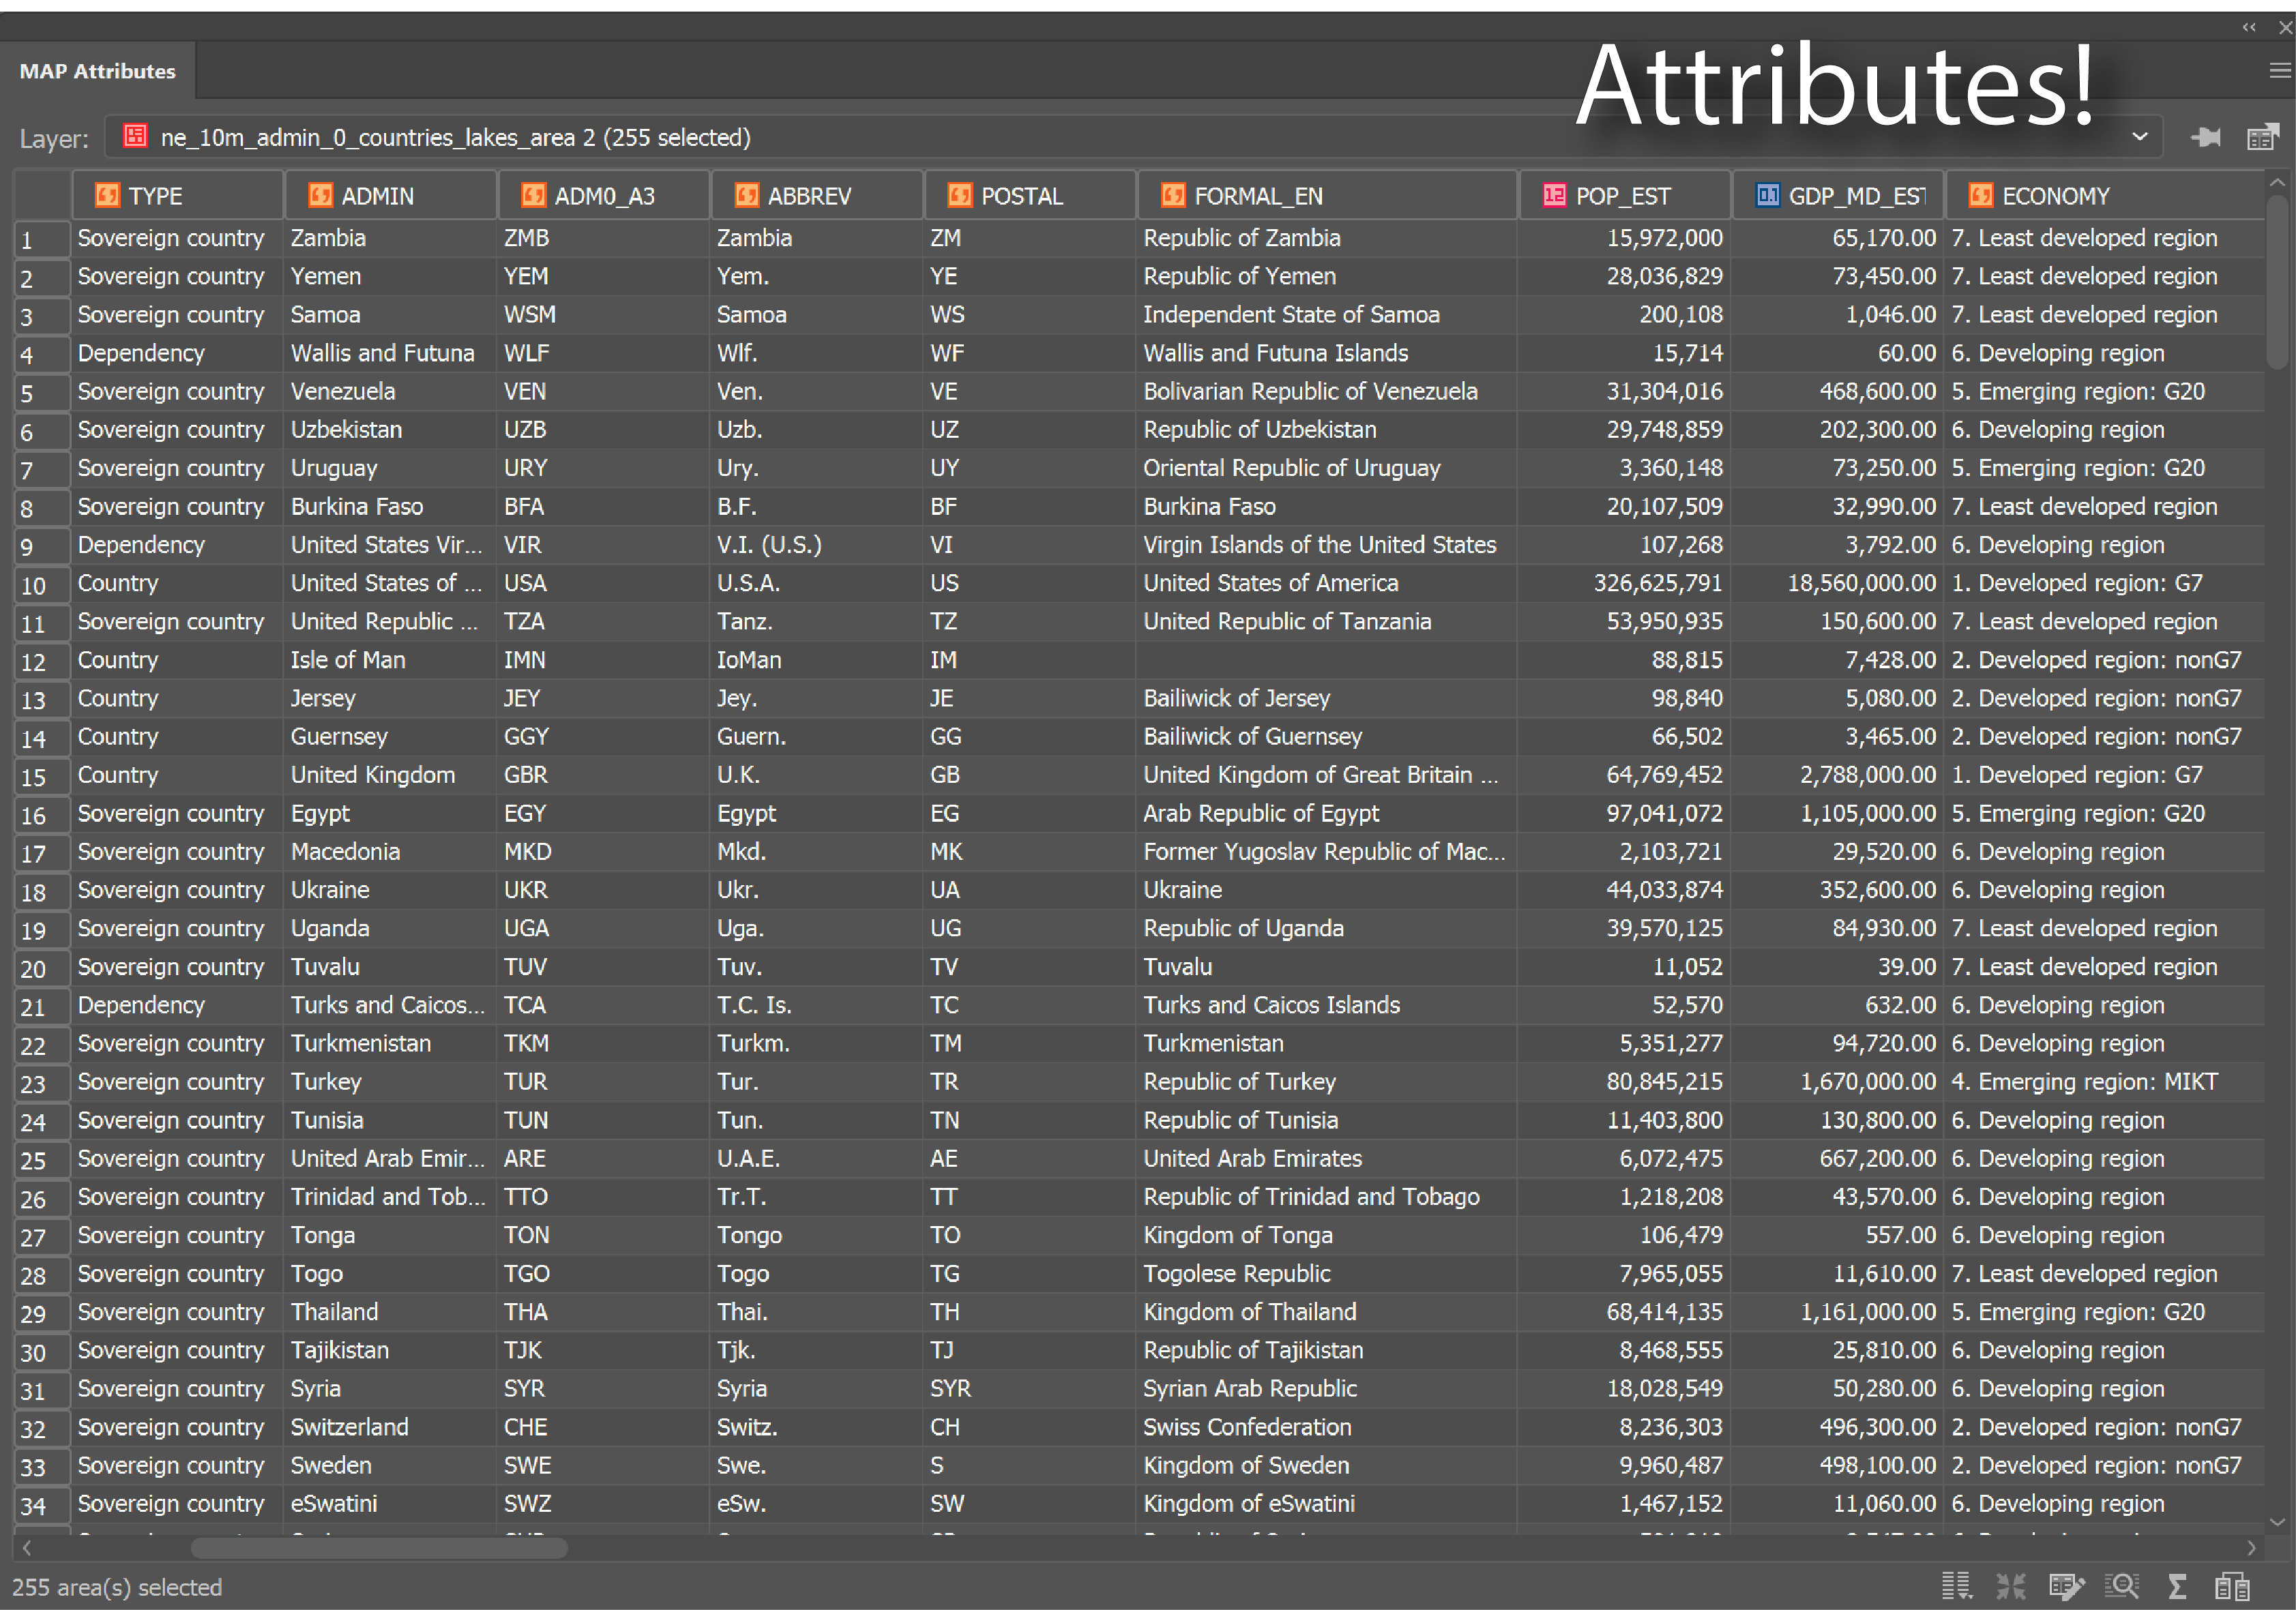
Attributes denote a geographic feature on a map. The information is typically stored in a tabular format that is linked to the feature. For instance, the attributes of a well-represented point along a river may include the name, the course of the river/ length, sediment load, etc. 

When you are familiar with the attributes associated with the map data, you can do things like applying rules to style your map according to attributes in the table.

4. Geocoding

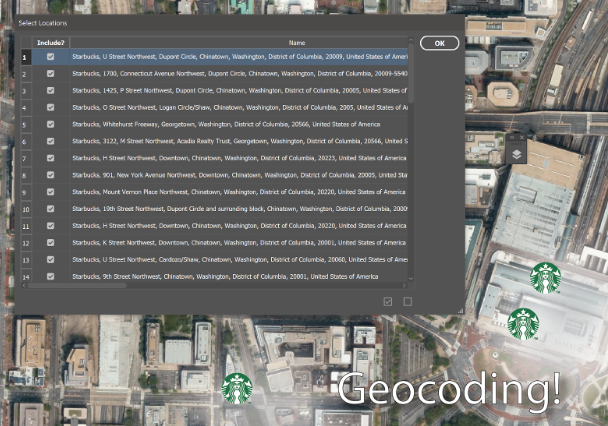
Geocoding

The process identifies a location by its geographic coordinates (latitude and longitude). This is used to position places and features on a map as well as to reference the map itself. 

5. Buffers

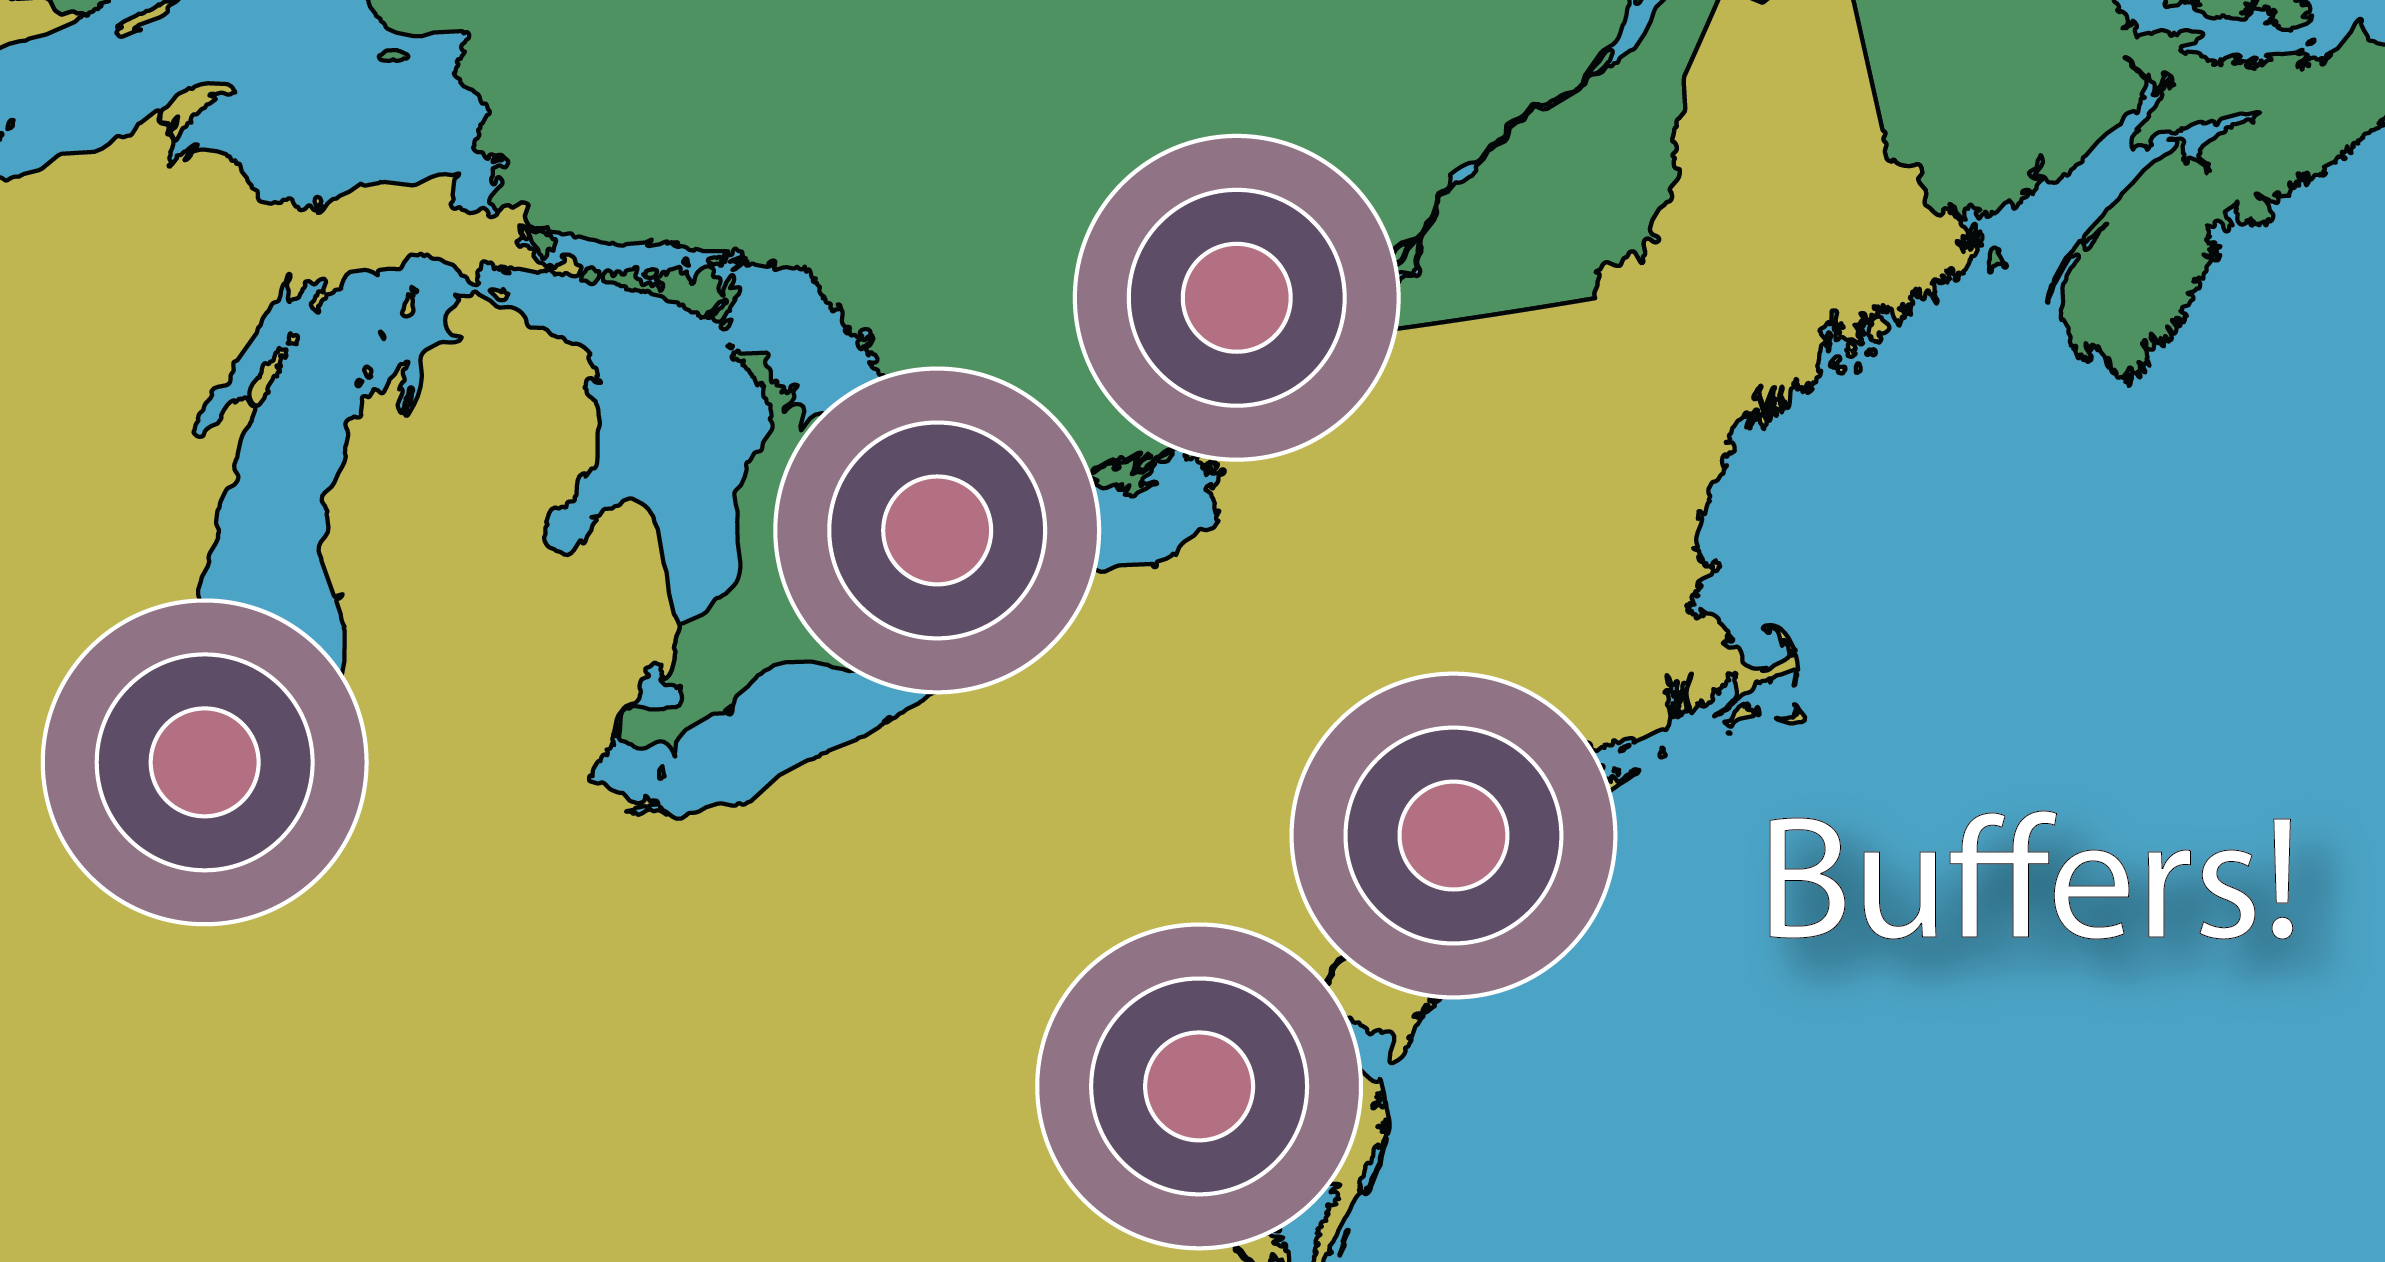
Buffer

A buffer is a zone around a specific map feature, that is measured in units of time or distance. A buffer is useful for proximity analysis or visualizing the areas that are within a certain distance from another feature (i.e. within school zones, or floodplains) 

6. Polygons/Areas

Areas / Polygons on a map

Enclosed Polygons on a map are often referred to as areas. Polygons can have attributes associated with them to represent a particular real-world entity such as postal code, economic identifiers, population demographics, environmental factors, or social behaviors.

The image above depicts areas on a map.

7. Coordinate systems

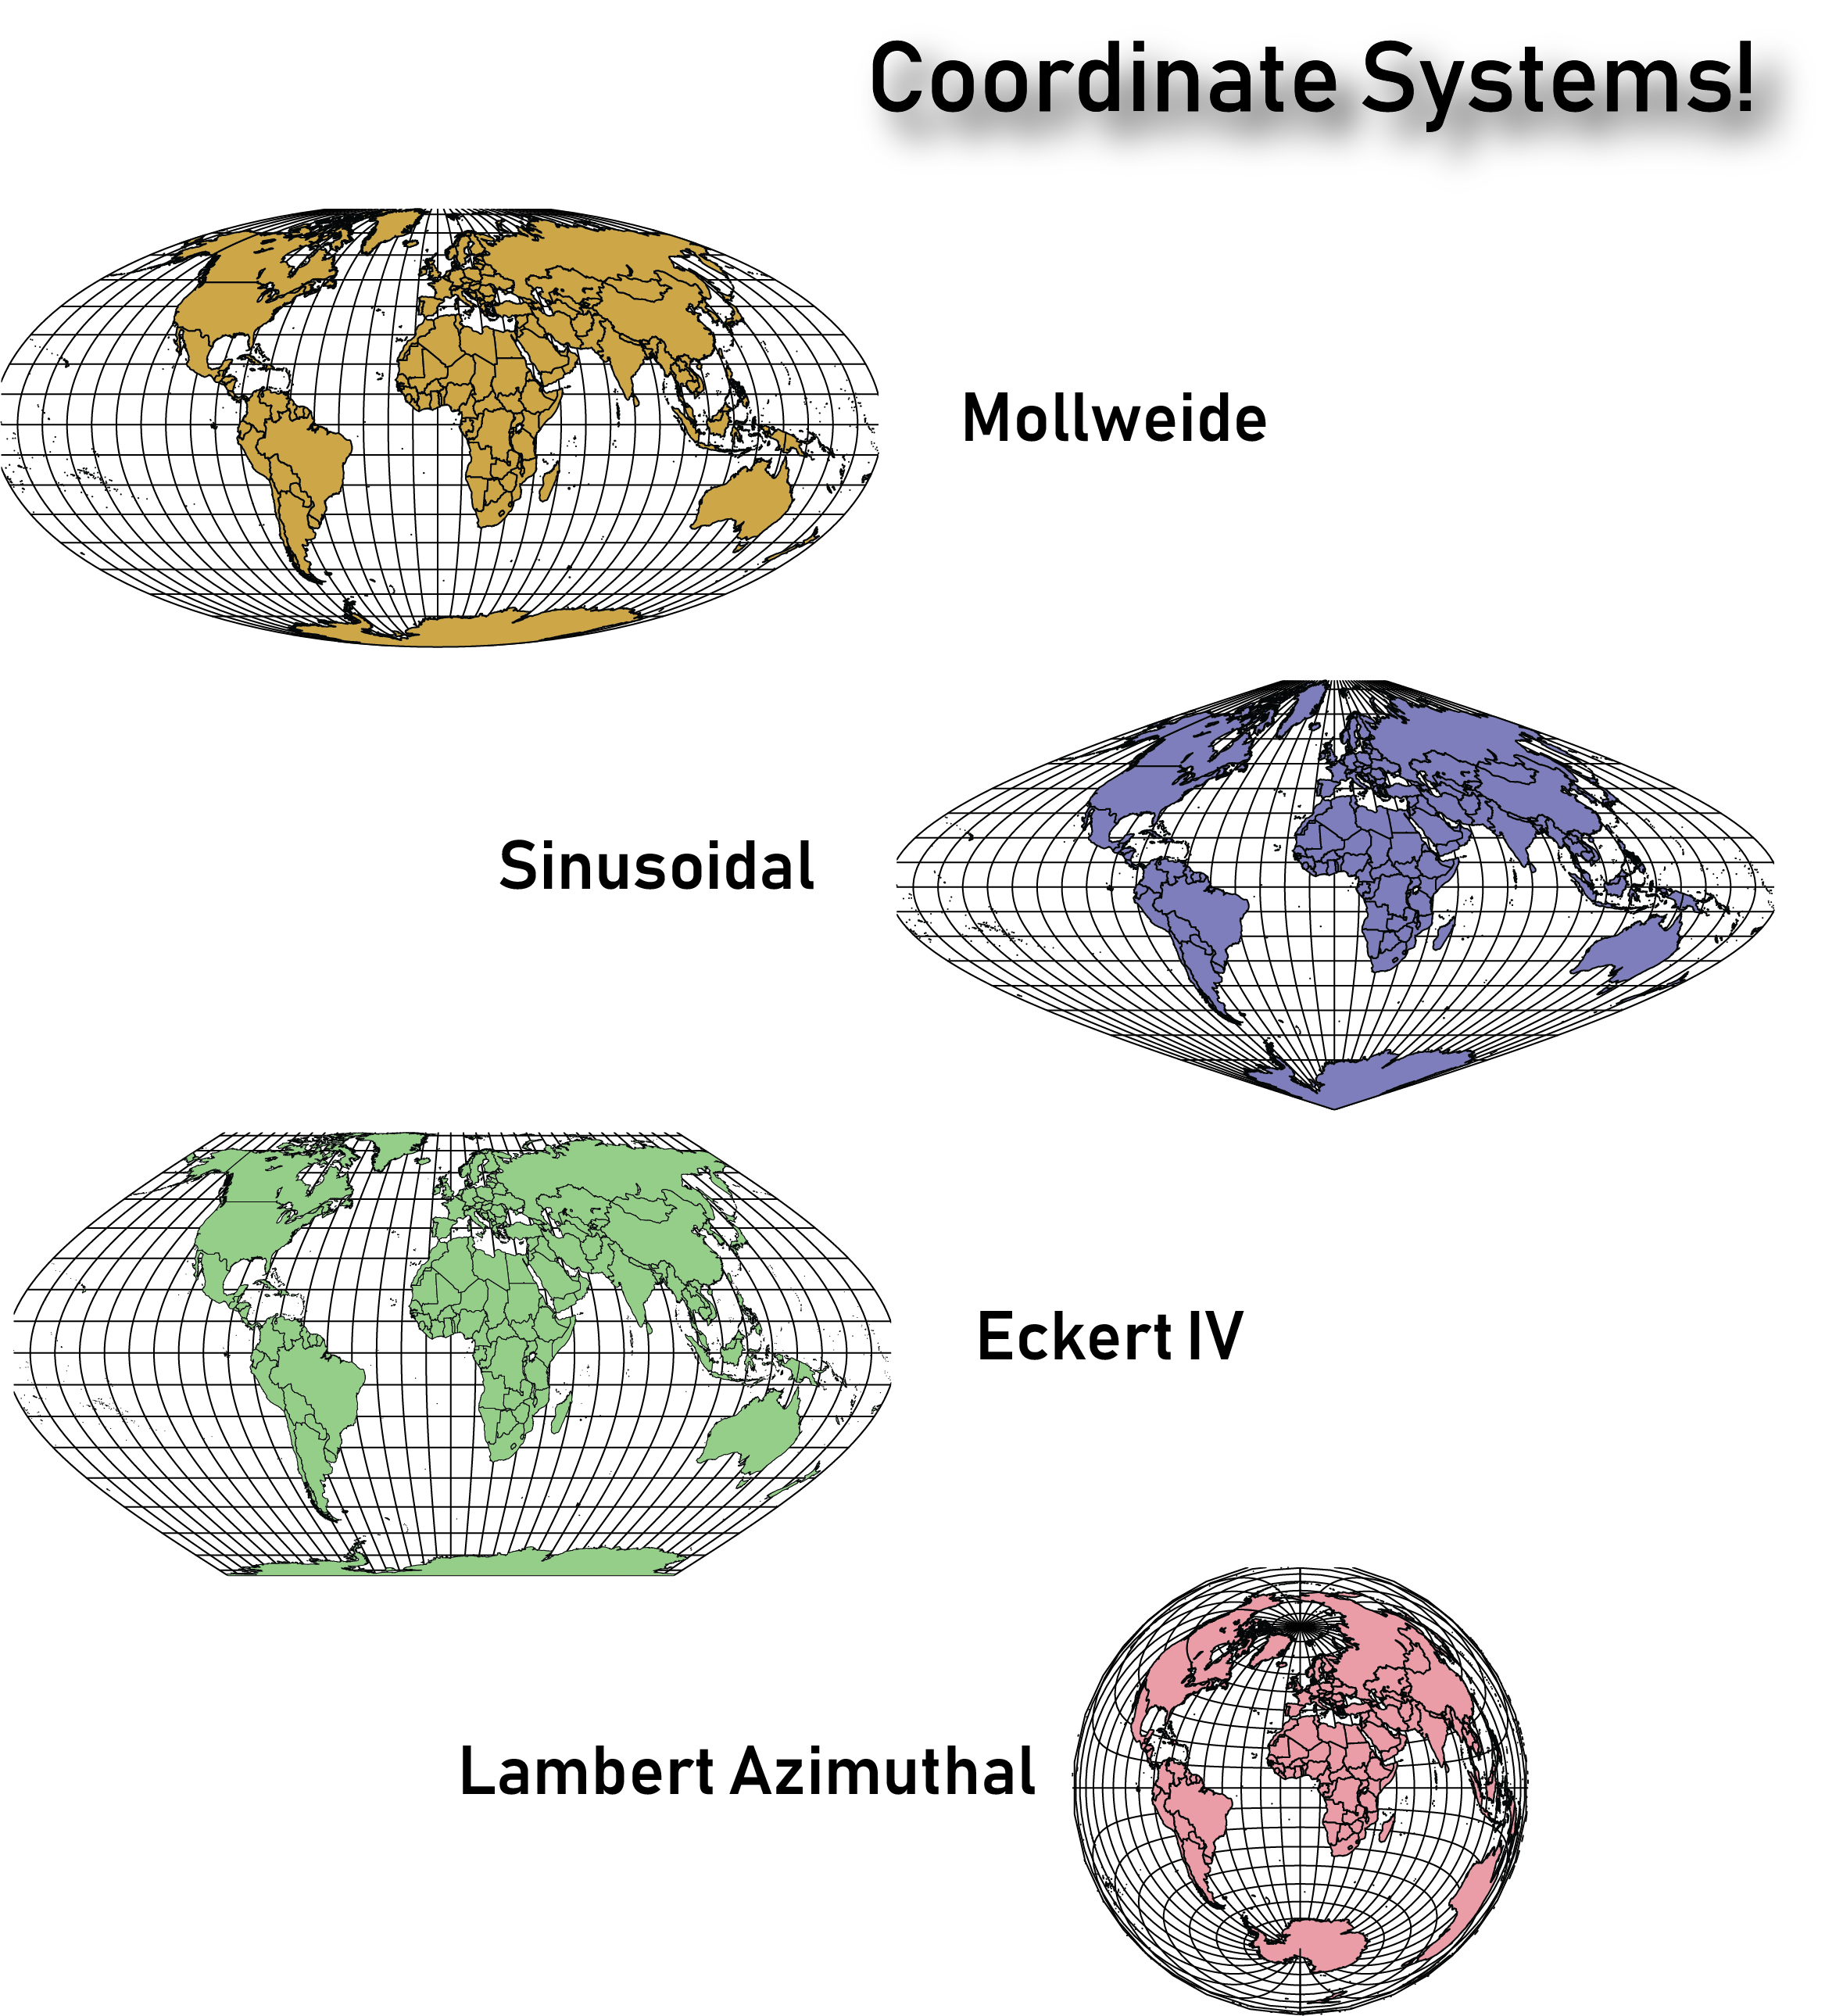
The planet is not flat, however, we routinely try to represent it in 2 dimensions on paper and screens. The Coordinate systems act as a reference framework that helps position features in order to make a map more useful for the purpose desired.

Coordinate Systems

It is important to note that there are thousands of coordinate systems, so it’s important to take the time to figure out which would work best for the type of map you intend on creating. Sometimes you’ll need to change the coordinate system from the one defined in the underlying map data, to help the map make more sense to the end-user. 

They say an artist is one who gives people something they didn’t know they were missing. If you happen to be an artist or know an artist (graphic designer) who seeks to give people direction – literally ‘direction’ – you’ve landed in the right place. Go ahead and share this article with like-minded map enthusiasts to begin learning and delivering high-quality maps the easy way. 

Sources:

https://researchguides.dartmouth.edu/gis/spatialanalysis

https://en.wikipedia.org/wiki/Buffer_(GIS)

Validating Georeferencing in Geographic Imager

When georeferencing a map in Geographic Imager, there are two tools which can be used to check spatial accuracy: Validate and Show Image Extents Online. With Validate, click a point on the image and it will show the corresponding location on the web map service so that you can compare the difference between them. Show Image Extents Online will display a rectangle representing the spatial extent of the image on the web map.

The image below shows the Validate tool in action. Selecting the tool and clicking on the road intersection brings up the same intersection in the web map, displaying how accurate the georeferencing may be. It is good practice to test several known points on the image. Choose features that will be easy to identify on the web map such as road intersections, coastlines, buildings, and landmarks.

The Show Image Extents Online tool is shown in the image below. Use this tool to see the full area covered by the image. Note that the rectangle shown on the web map will include the non-map areas of the page (borders, legend, etc).


Georeference Any Map in MAPublisher 8.7 with the New Georeferencer Tool

The new MAPublisher 8.7 Georeferencer is a fast, easy, and accurate way to update your current unreferenced map collection or data to prepare it for PDF Maps or other digital formats.

The first step is to open your unreferenced document in Adobe Illustrator. If the document is a vector PDF it is often advantageous to rasterize the document and save it as a TIFF to avoid any conflicts with text.

Once the map is open, we can use the Map Locations tool to place reference points or Page Locations on our unreferenced map. It is recommended that known points, or points that are unlikely to move such as the intersections of road ways, are used as reference because these locations will be easily recognizable (as seen in the following steps). Tip: You will also want to zoom in as close as possible to the point to ensure the best possible accuracy.

Place MAP Locations

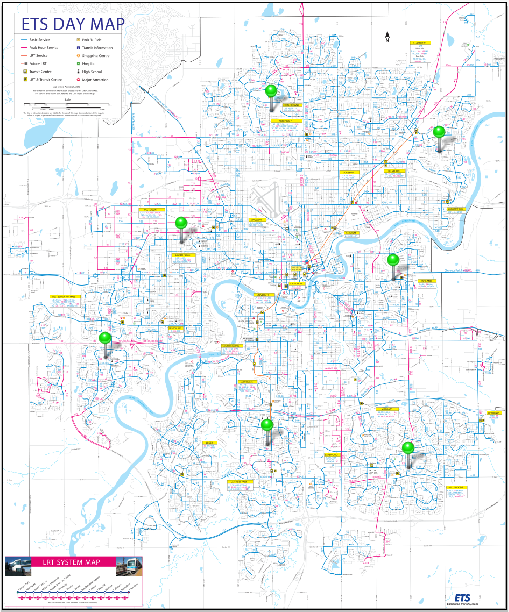
After we have given a name to our page location we will continue to place page locations until there is four or more spread as evenly across the map as possible. Having greater than four reference locations could help to improve the overall georeferencing accuracy.

Place MAP Locations

The next step is to find the real world counterparts, or World Locations, for each of our Page Locations using the Georeferencer tool. World locations can be sourced from an online map service, an open referenced document or entered manually. In this example we will use the built in Google Maps service to find our World Locations.

Place MAP Locations

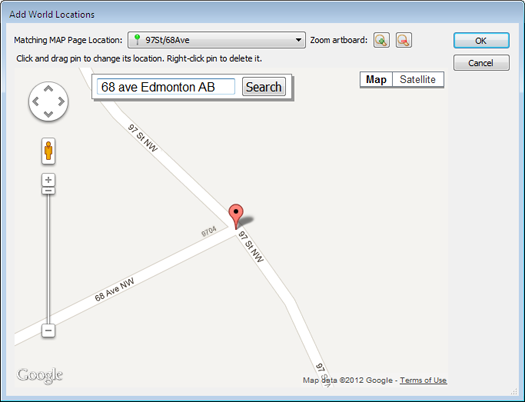
The Google Maps option opens the Add World Locations dialog box. Choose a Page Location from the drop-down list and use the map to find the corresponding world location. Use the Google search bar and zoom buttons to zoom as close as possible to the corresponding world location. Place the cross hairs over the location, click, and confirm the world location with the page location.

Place MAP Locations

If the point is accurate, we will continue to add world locations for each page location. If not, the world location position can be changed by clicking and dragging it to a more accurate location. Right-click the pin to delete it.

If you’re unsure about the position of the original page location, you can drag the Add World Locations dialog box to the side and use the Zoom to artboard tool to help locate it.

After we have placed all of the World Locations with the corresponding Page Locations, we may now either specify a coordinate system (if one is already known) or click on Georeference and Save.

Place MAP Locations

After clicking Georeference and Save, a list of possible projections will be presented. Select the projection which most accurately represents your map. With each projection we see an associated error. This error is based on the combined accuracy of our Page and Map locations.

Place MAP Locations

As in this example, the first ranked projection is not always the best fit for our map, so it is best to use your best judgment when selecting a projection.

Click OK and add your map to a Map View and save. Your map is now referenced!

Place MAP Locations

We can check the accuracy of our georeferencing by zooming in closely to our Page (green) and Map (blue) locations. The further the distance between the two points, the less accurate a given georeferenced map is.

Place MAP Locations

You can also see a video of the Georeferencer in action on our YouTube Channel.

Geospatial PDF in Adobe Acrobat: Examining latitude and longitude values

After creating a map with MAPublisher or Geographic Imager, you might want to export it as a geospatial PDF file. You want to ensure that the georeference information of your Geospatial PDF files are correct before bringing them into the field for use. A great way to use geospatial PDF maps (and GeoTIFFs) is to load them onto an iPhone, iPad, or iPod touch with PDF Maps installed.

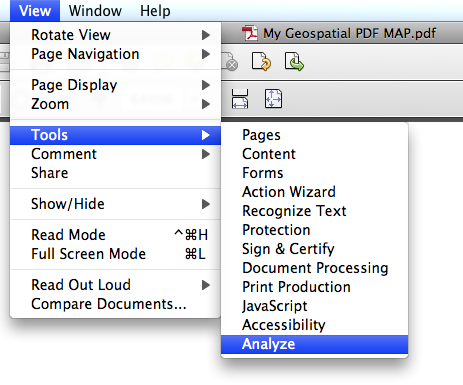
One way to check for georeference accuracy of geospatial PDF files is to use Adobe Acrobat. Open the “Analysis” tool from View > Tools > Analyze.

Adobe Acrobat: Opening Anlysis Tool

Click the “Geospatial Location Tool” from the Analyze panel.

With the Geospatial Location Tool enabled, you can see the latitude and longitude values of the map while you move the mouse over the opened Geospatial PDF file.

Geospatial PDF viewed in Adobe Acrobat

An important tip you should keep in mind: you need to set the preference option for this tool correctly depending on the coordinate system of the map in the geospatial PDF file.

Open the Preference dialog window:

Acrobat X on Windows: Edit > Preferences > General …
Acrobat X on Mac: Acrobat > Preferences …

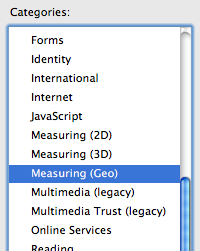
In the Preference dialog window, find the preference category “Measuring (Geo)” from the list of categories.

Adobe Acrobat Preference dialog window

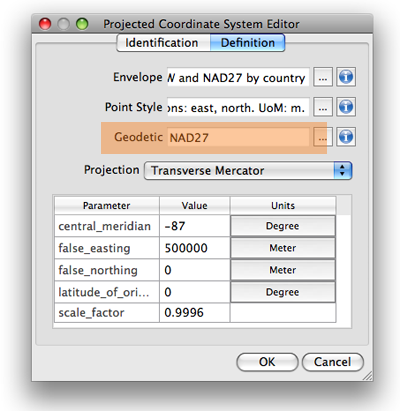
In the “Measuring (Geo)” category, take a look at the right side. There are many options for the georeferencing tool. One of the options is “Latitude and Longitude Format”. In this section, you have a checkbox option “Always display latitude and longitude as WGS 1984”.

Adobe Acrobat Preference option for Latitude Longitude Display

This option is very important. If the coordinate system of the map is “NAD 27 / UTM Zone 16 N”, which geodetic system would you like to have to show the latitude and longitude values in Adobe Acrobat? For example, if you are checking the latitude and longitude values in the WGS 1984 geodetic system, you should keep this option selected. However, if you are checking the latitude and longitude values in NAD 1927 geodetic system, then you should de-select this option. The difference in the distance at the same spot between two different geodetic systems may be small or large. If you would like to see the correct latitude and longitude values, you should be aware of this option.

Georeferencing an Image in Adobe Photoshop with Geographic Imager

Today's topic: making an image georeferenced

As of Geographic Imager 5.0, there’s an updated workflow for georeferencing images. Learn more about Georeferencing and work through the tutorial.


Nowadays, it’s common to find great orthophotos and satellite imagery on the Web. However, after downloading these (sometimes) large files, you might find that some don’t have any georeferencing. Most likely these files are in an image format supported by Adobe Photoshop(e.g. JPG or TIF) and you can georeference it using the Geographic Imager Georeference tool.

These are the requirements to georeference an image:

  1. Knowing the coordinate system of the image (e.g. Mercator projection, State Plane system Alabama East, UTM system NAD 83 Zone 17 N..etc)
  2. Finding three or more points from the image to assign coordinate values to each of them. These points are known as ground control points.

The first thing you need to know is the coordinate system or projection of the image you are georereferncing. If you are unsure about which coordinate system the image uses, contact the data provider or search the metadata of the image on the Internet. If you cannot get the information of the coordinate system assigned to the image, you might want to try georeferencing with different coordinate systems to make the map as precise as possible.

The second requirement is working with the ground control points. One ground control point consists of several values: 1) Pixel X coordinate, 2) Pixel Y coordinate, 3) Ground X coordinate (e.g. longitude), and 4) Ground Y coordinate (e.g. latitude). Furthermore, to make georeferencing easier, ground control points must be clearly identifiable in the image. Cultural features such as road intersection, a sharp corner of a lot or boundary are good examples of locations used as ground control points.

Now that you know what you’ll need, we’ll demonstrate a georeference workflow using the Geographic Imager Georeference tool and Google Earth.

Step 1: Obtain a non-georeferenced image

This image is in JPEG format and there is no georeference information associated with it. In order to transform it to another coordinate system or projection, mosaic with other images, or align the image to vector work using MAPublisher for Adobe Illustrator, the image must first be georeferenced.
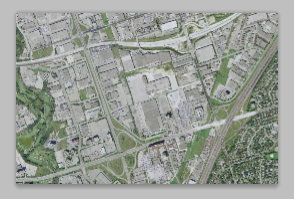
An example image collected

Step 2: Obtain the required information

As indicated above, two key pieces of information are required to georeference an image: a) the coordinate system of the image and b) defining ground control points

a) The coordinate system of the image

The image, collected from Google Earth, is projected in a coordinate system called WGS84 / Pseudo Mercator (this projection is common to Web based mapping systems and is also known as Web Mercator or Google projection).

b) Defining ground control points

We’ll need to define at least three ground control points for georeferencing. Below are the steps for finding out one of the ground control points.

On the non-georeferenced image, decide which spot to use as a point of reference. It should be available on Google Earth where you’ll find the X,Y coordinate values. For the first point, we’ll use the corner boundary between the pavement and a golf course.
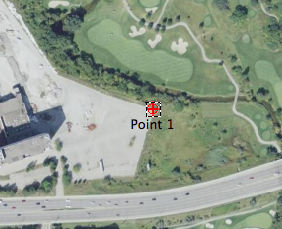
a ground control point selected on my image

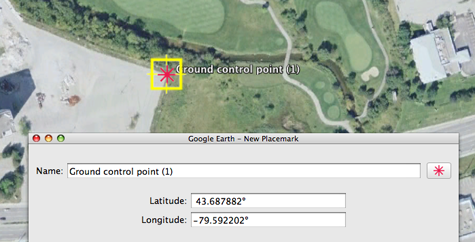
Using Google Earth, find the exact same spot as the one decided in the non-georeferenced image. Place a point symbol to help identify the coordinate values. Record the collected latitude and longitude values. The latitude and longitude values are at the centre of the point symbol symbol in the Google Earth window.

collecting the latitude and longitude values from Google Earth

Find the coordinates of two additional ground control points. The latitude and longitude values are in decimal degree format and the coordinate system of those values are in the geodetic system “WGS84”.

collected three ground control points

Step 3: Georeference in Geographic Imager

In Geographic Imager, click the Georeference tool button Geographic Imager: Georeference in the Geograhpic Imager main panel (or choose File > Automate > Geographic Imager : Georerence). The Georeference dialog box will open.
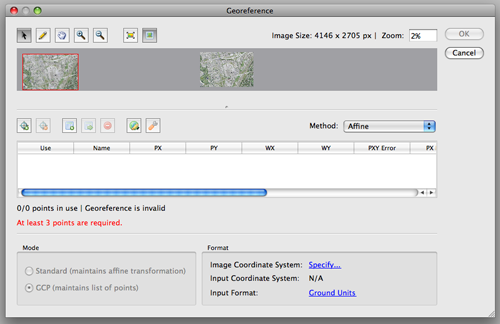
Geographic Imager: Georeference window

First, we’ll need to set the proper image coordinate system and input coordinate system (the information from Step 2a). In the Format section, click the blue “Specify” link to open the Input Format dialog box.

Georeference: Input

Here we’ll specify two parameters: Image Coordinate System and alternate input coordinate system. The image of the coordinate system is WGS84 / Pseudo-Mercator as found at Step 2a. Click the “Specify” button to find the coordinate system from the coordinate systems list.

The option “Use alternate input coordinate system” will not have to be selected if the X,Y coordinate values are collected in the Eastings/Northings in the WGS84 / Pseudo-Mercator coordinate system. When those latitude and longitude values are collected, those values are collected in the decimal degree format and the values are in degree in WGS84. We will use those latitude and longitude values for the georeferencing. Specify the destination coordinate system as WGS84.
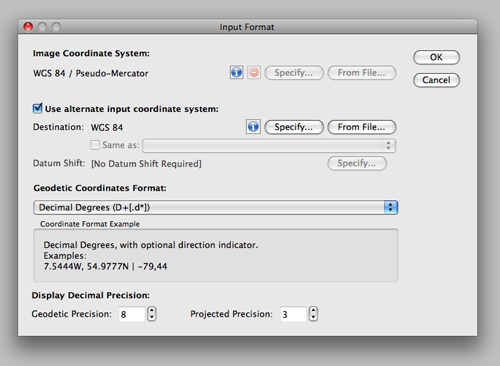
When the settings are made, click OK to close the Input Format dialog box. All the selected coordinate system for each setting will be indicated in the Format section of the Georeference dialog box.

Georeference : Input image coordinate system and input coordinate system

The next step is to enter the three ground control points collected from Google Earth. Click the pencil tool at the top of the Georeference dialog box and click a point for one of the ground control points collected at the previous steps Georeference : Pencil tool.

a ground control point selected on my image

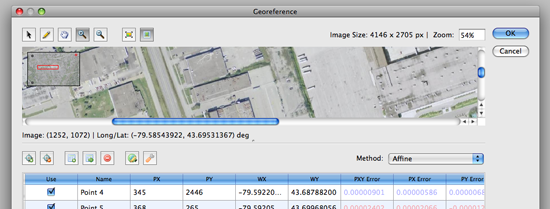
As soon as one point is clicked on the preview image, it will add one row in the Georeference table. This row contains the point name, PX (Pixel x coordinate), PY (Pixel y coordinate), WX (World X coordinate), and WY (World Y coordinate).

Ground control point 1

For WX and WY, enter the longitude and latitude, respectively, for the first ground control point.

ground control 1: completed

Repeat the same steps for the second and third ground control points.
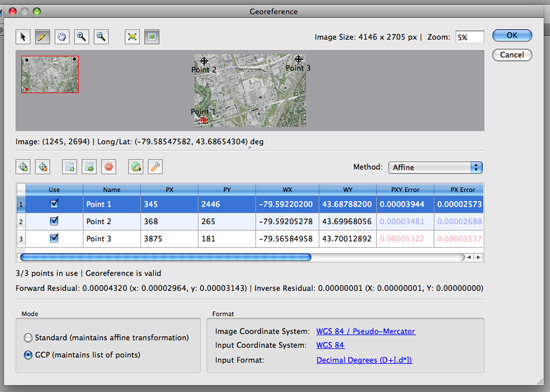
All three ground control points are entered

As soon as you enter three points, Geographic Imager will display the residual error values on the table for the accuracy assessment.

GCP Error

A residual error is the computed difference between an observed source coordinate and a calculated source coordinate. It is the measure of the fit between the true locations and the transformed locations of the output control points. A high residual error indicates possible error in either the observed source coordinates or the reference coordinates of the reference point in question.

When the error is particularly large, you may want to remove and add control points to adjust the error. As a general rule, apply several different transformation methods, select/deselect questionable points and select the method and reference points that yield the minimum residual error, assuming that the defined reference points are correct. Residual values are calculated via the associated error values between computed values and entered values through either the affine or various polynomial methods.

Once completed, the Geographic Imager main panel will indicate the georeference information of the image. Don’t forget to save the file once it is complete. Now your image is ready for any Geographic Imager function. You can also bring this image into MAPublisher for Adobe illustrator and align it to other GIS data.
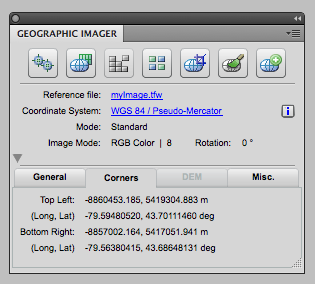
Georeference information displayed on the Geographic Imager Main panel

News Archive