My Account     Contact Us     Cart

Mapping Class: Georeferencing Techniques Part Two – Working with Scanned Maps, with Hans van der Maarel

Welcome back to another exciting edition of Mapping Class, a video-blog series where we curate tutorials and workflows created by expert cartographers and Avenza power users from around the world. Today we release Part Two of our Georeferencing Techniques tutorial with Hans van der Maarel, owner of Red Geographics. In Part Two, Hans demonstrates some techniques he has developed for working with more challenging georeferencing tasks, including dealing with unknown projection information and working with scanned maps. If you missed Part One, in which Hans covers the basics of Georeferencing in MAPublisher, check it out here.

Hans has produced a jam-packed video walkthrough detailing his georeferencing process. The Avenza team has produced video notes (below) to help you follow along.

***

Georeferencing Techniques Part Two: Working with Scanned Maps
by Hans van der Maarel (video notes by the Avenza team)

As we discussed in last month’s Mapping Class, georeferencing is the process of taking imagery or map data that lacks geographic location information and associating it with specific coordinates on Earth. Previously, Hans showed us how MAPublisher provides a few tools that make georeferencing simple vector map data a painless process (Check out part one here!). Best of all, using the built-in georeferencing tools, this can be done entirely within the Adobe Illustrator environment.

However, what can you do if you are working with historical maps or scanned images that lack spatial referencing or detailed projection information? This can present a challenge for many cartographers, as the projection information is necessary to create an effective cartographic product that will minimize distortion and maximize the spatial accuracy of the final result. To tackle this problem, Hans shares a series of tips and tricks that he uses for working with scanned historical maps. He uses a beautiful historical map of Northwest Africa to demonstrate his approach.
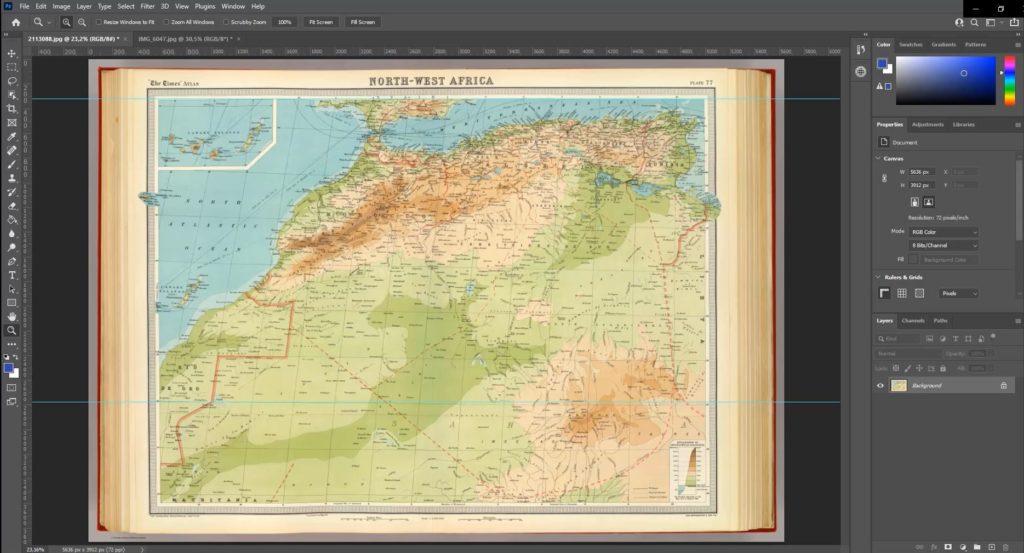
Right away, Hans identifies a few obstacles. First, he notices that the scan is not a perfect copy of the original map. Due to natural curves and bends in the physical paper version of the map, there is minor distortion in the digital image that arose when the map was scanned. This could create problems for georeferencing the image, as the “fitting” process can be susceptible to image distortions, even when a suitable projection is determined. Thus it is always a good idea to examine your scanned map prior to beginning the georeferencing process. Becoming aware of potential issues with the scanned map data can help inform decisions on the data’s suitability for a particular mapping task. Acknowledging that the distortion is relatively minor in this scanned map, Hans chooses to proceed with the georeferencing process.

Hans notices that the scanned map image does not provide any details on the original projection information. Instead, Hans must make an “educated guess” on which projection was being used. With a bit of research, he discovers another map from roughly the same era and displaying a similar region. Recognizing the similarities between this map, and his scanned map, Hans decides to implement a Lambert Zenithal (Azimuthal) Equal Area Projection.
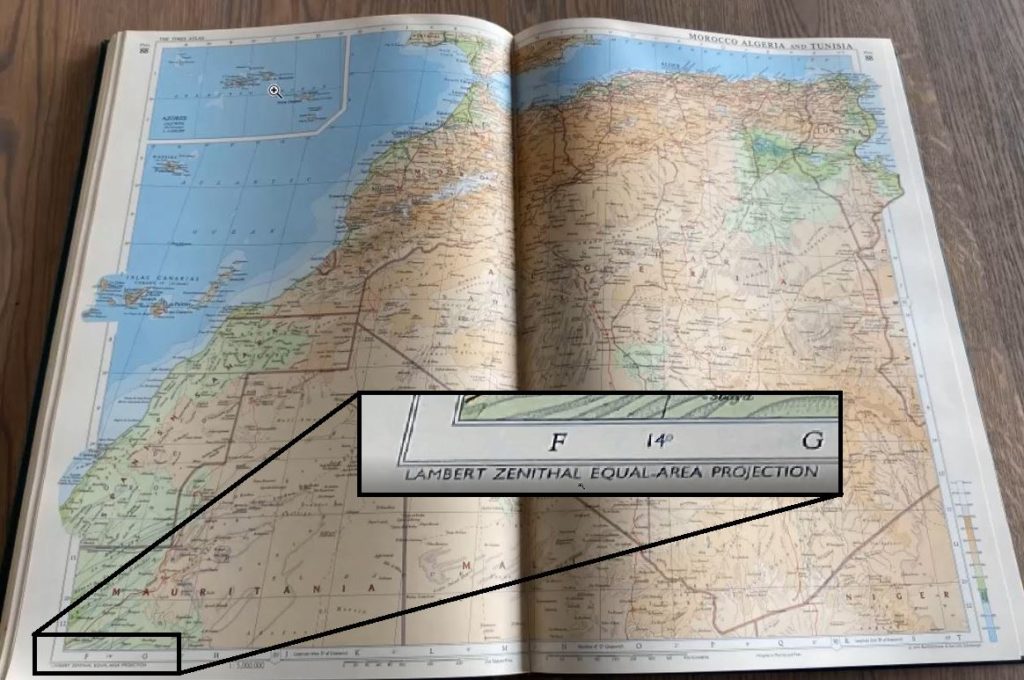
Hans discovered this map from 1968, which displays approximately the same area. He chooses to use the projection information from this map to help with the georeferencing process of his scanned map.

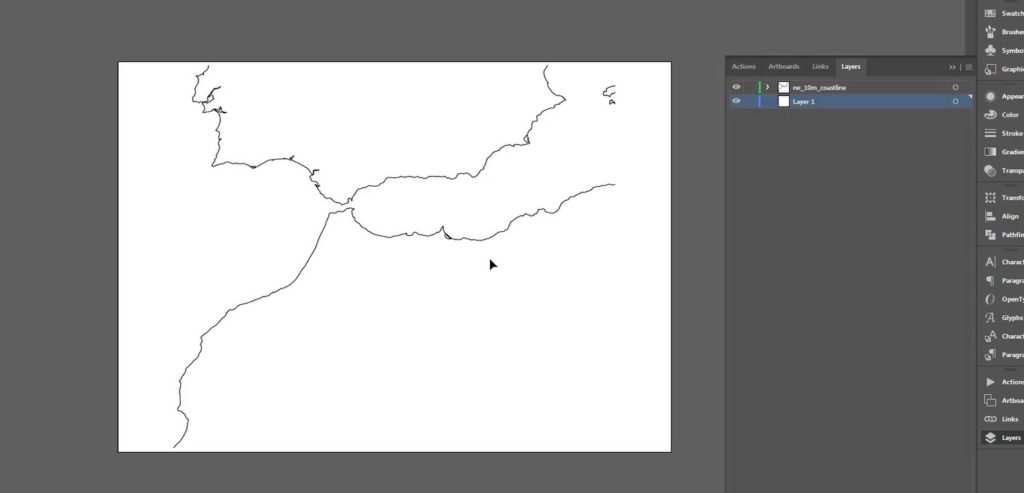
Hans can begin his georeferencing process by first setting up a new MAP View with the Lambert Azimuthal Equal Area Projection, a conical projection used in many atlas-style maps. To help with the georeferencing process, Hans has used the Import tool to display a vector line layer of coastlines using Natural Earth DataHe can use this coastline data as a guide to help align his scanned map during the georeferencing process.
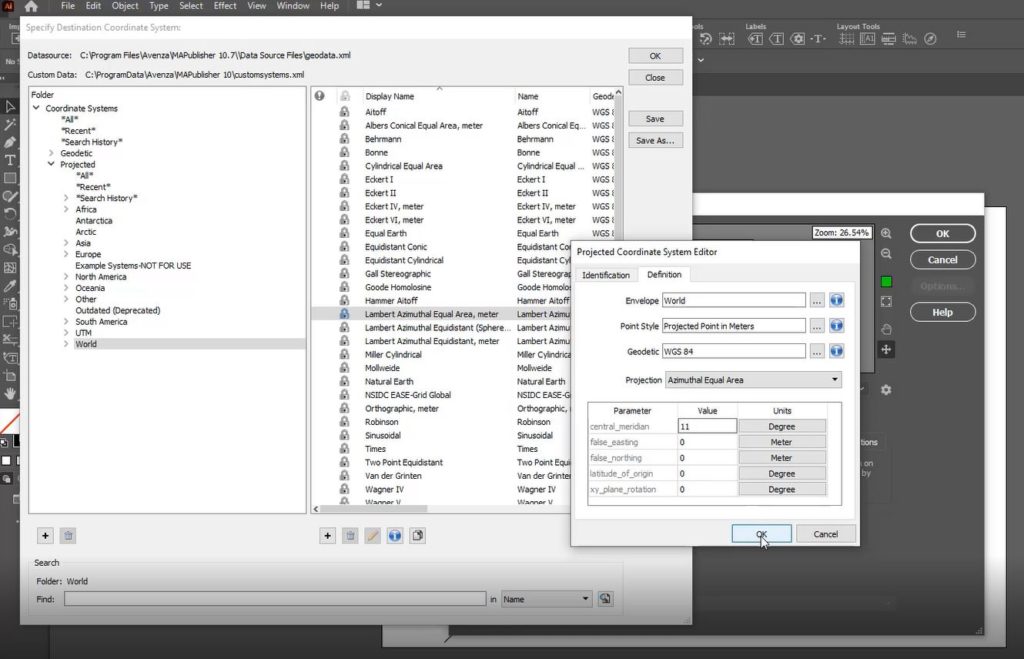
Before moving on, Hans brings up two important things one must consider when working with conical projections: the central meridian and the latitude of origin. When working with scanned maps that include graticule lines, a quick and easy way to help identify the central meridian is to look for the meridian line that closest approximates a straight line. Using the graticules on the scanned map, Hans can approximate a central meridian of about 11 Degrees. In the MAP View Editor, a user can open the projected Coordinate System Editor and modify the definition for the lambert azimuthal equal-area projection to have a central meridian that matches his estimation.
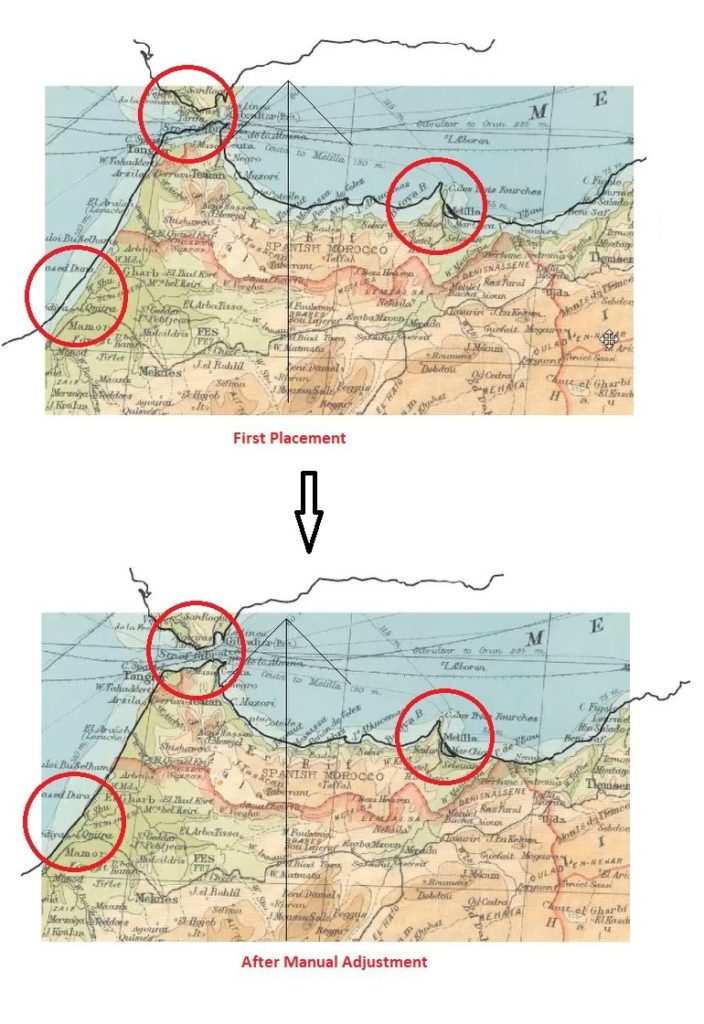
Placing the scanned map layer onto his newly modified MAP view, Hans can then begin the process of manually aligning the map image to match his projected coastline data. One of the easiest ways to support this process is to configure the MAP View editor panel to display layer thumbnails. With this configured, a user can begin manually adjusting the MAP layers until they are suitably aligned.

Hans reiterates that this process is not an exact science. He has made several assumptions on the projection parameters, and the overall accuracy of the original map. He indicates that a user should spend some time trying to get the best possible result, however it will be difficult to achieve a perfect match (especially given the distortions that can occur when a map is scanned from a physical copy). This process can take anywhere from minutes to hours, and requires a lot of manual adjustment, trial and error, and most importantly, patience! The result, however, is that the finalized scanned map layer is correctly projected and georeferenced into a MAP view. From here, adding data layers, annotations, labels, or tracing vector layers from the scanned map can all be completed in a spatially aware mapping environment.
Providing a second example using a slightly different approach, this time Hans uses a map of the Arctic Region. He indicates that although he has been provided with a map of the entire polar region, the client is only interested in the area surrounding the Bering Strait (between Russia and Alaska). As with the previous example, the first step is to identify the best projection to use. Hans correctly guesses that the map provided likely uses the Polar Azimuthal Equidistant Projection based on visual inspection. However, it should be noted that there is room for trial and error here, and users should not be afraid to explore the large coordinate system and projections library included with MAPublisher to try out and test different projections to help narrow down one that fits best.
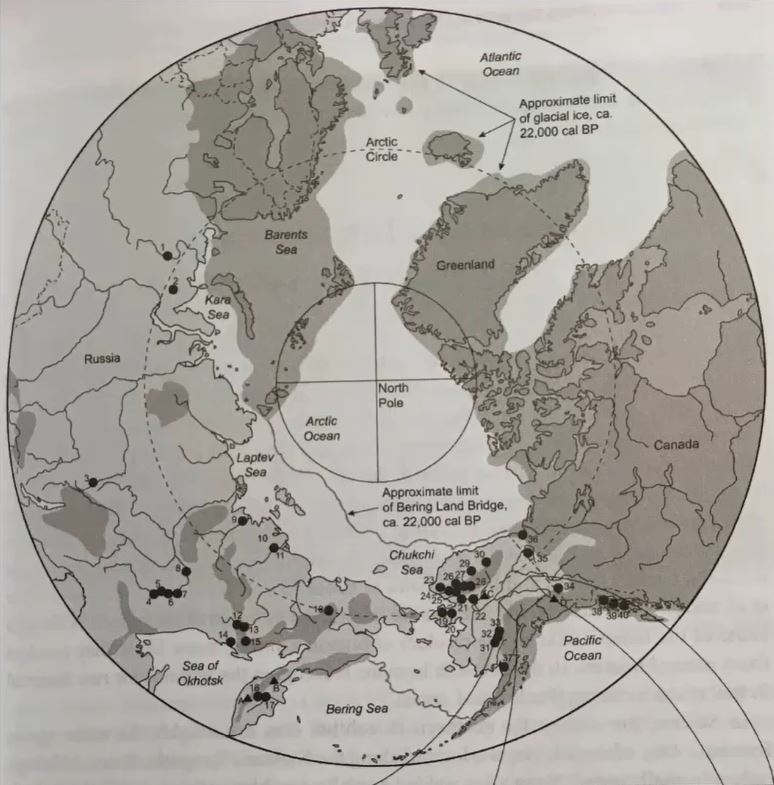
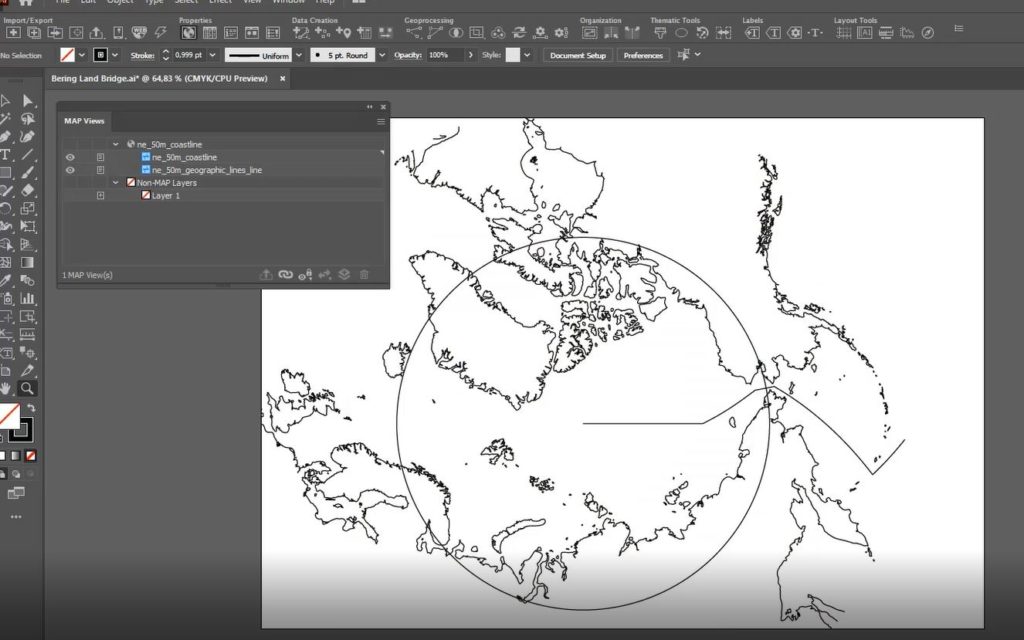
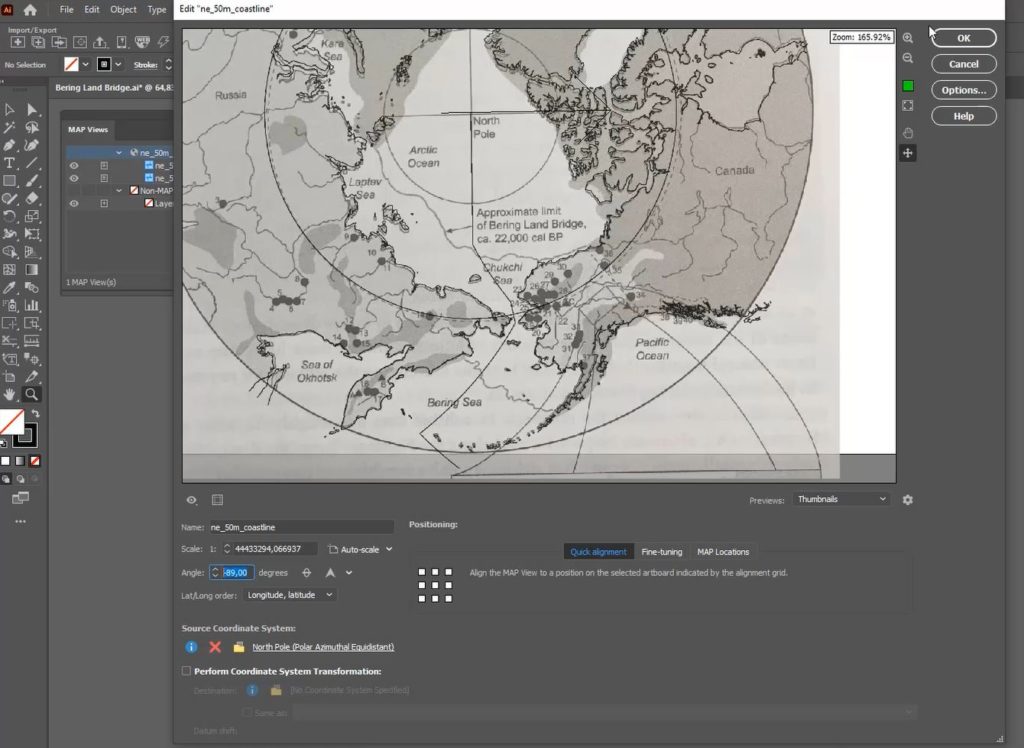
The first thing Hans notices is that the scanned map image is rotated about -90 Degrees from what is displayed in his reference coastline data. Once again, by visiting the MAP View Editor, Hans can rotate his Map layers without breaking the spatial referencing information of his original map data. By doing this, Hans assures that his map layers are aligned on the same rotational angle, and can then begin to focus on scaling the layers.
Hans uses the MAP view editor panel to apply manual adjustments to the map layers. He notes that a cartographer should always consider the area of the map they are most interested in. For example, although his map covers the entire polar region, Hans indicates the final product will only display the regions surrounding the Bering Strait. Given this, the georeferencing process should be primarily concerned with accurate alignment in the Bering Strait area, while distortion in other areas is seen as acceptable.  In the example below, you can see how Hans has achieved a suitable level of georeferencing accuracy in his primary area of interest, despite the non-important areas (i.e the Canadian Polar region, eastern Siberia, Greenland) having relatively low georeferencing accuracy.
With his newly georeferenced scanned map layers. A cartographer can now use the information contained within these scans to supplement a larger cartographic process. For example, Hans can now use the scanned maps to digitize boundaries, or geographic features that may not be present in modern digital datasets (for example, historical boundaries for different countries, or terrain features that are no longer present)

***

About the Author

Hans van der Maarel is the owner of Red Geographics, located in Zevenbergen, Netherlands. Red Geographics is a long-time partner of Avenza and Hans is a well-known power user of both MAPublisher and Geographic Imager. He uses the products for a wide range of cartographic projects for several international organizations and offers training courses and consultancy expertise aimed at developing workflows for clients. In addition to that, he is currently a board member of NACIS. To find out more about Red Geographics, and to see more work by Hans, visit redgeographics.com

Mapping Class: Importing OpenStreetMap data using Overpass Turbo with Steve Spindler

We are back with another exciting addition to our Mapping Class tutorial series. The Mapping Class tutorial series curates demonstrations and workflows created by cartographers and Avenza software users. For this article, we are welcoming back Steve Spindler, a longtime MAPublisher user, and expert cartographer. He has shared with us an excellent tutorial on creating a map from scratch using openly available geographic data from OpenStreetMap, and accessed through Overpass turbo. Steve shows how you can create query statements to filter and export the data, and demonstrates how you can import the data into MAPublisher before using a selection of cartographic styling tools to create a visually appealing map.

Steve has produced a short video walkthrough detailing his map-making process. The Avenza team has produced video notes (below) to help you follow along.

***

Importing OpenStreetMap data using Overpass Turbo
by Steve Spindler (video notes by the Avenza team)

Finding and accessing good quality data is often the first challenge for any cartography project. OpenStreetMap (OSM) can be an excellent source of open vector data describing land cover features (roads, parks, rivers, buildings, trails, infrastructure, boundaries). Once collected, cartographers can use OSM data to create highly detailed maps using the MAPublisher plug-in for Adobe Illustrator. Steve will demonstrate his process of collecting raw data from OSM and using it to craft a beautiful map of the Niagara Falls Area. The following video notes summarize Steve’s approach. 

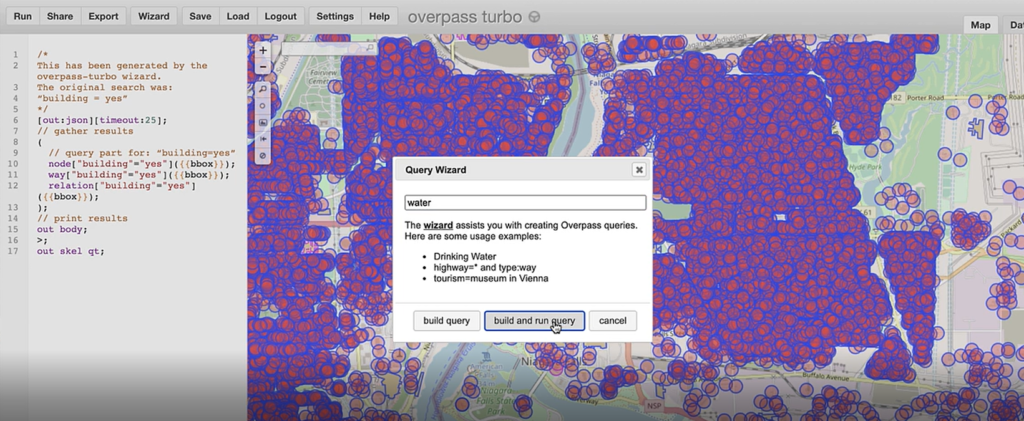
First, you will need to extract some data from the OSM database. Since OSM is a massive repository of geographic data, you’ll need a way to filter through and extract only the data needed for your specific map project. Overpass turbo is a web-based data mining tool that can make querying and exporting OpenStreetMap datasets easy. The tool allows users to apply query statements that filter the OSM database based on attribute and location information. Using the Overpass turbo “Wizard”, a user can enter simple queries (i.e. “water”) and automatically filter and select all features that match the query statement, making it easy to export specific data for your map.

Steve uses a simple query to obtain all map features that are considered “water”. This includes both natural and man-made features

The tool allows the user to export the filtered datasets into geoJSON format, an open standard format for storing and representing geographic data and attributes.

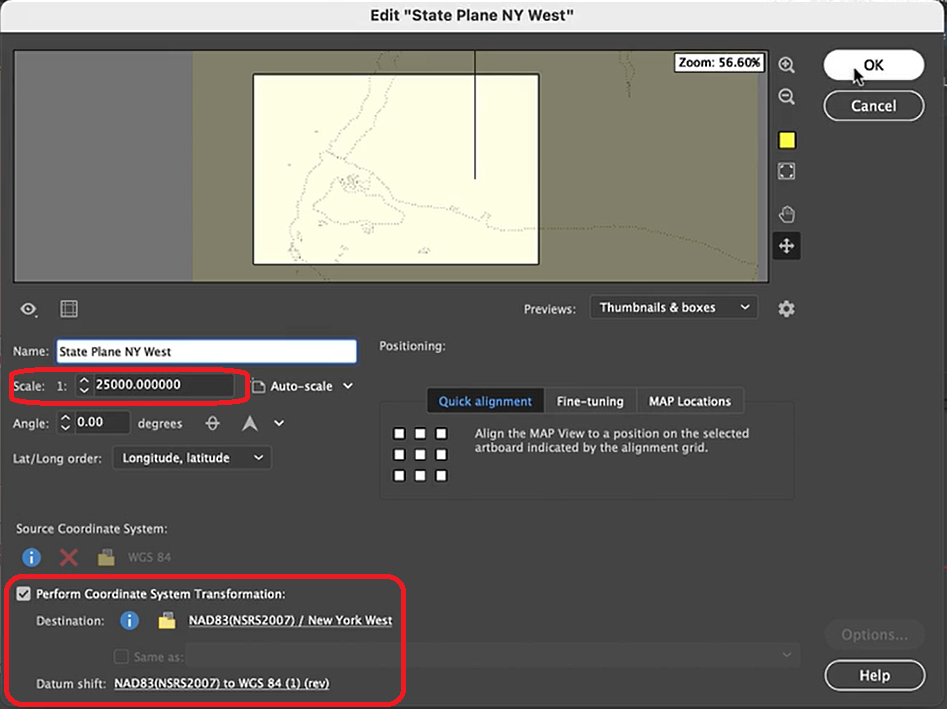
The geoJSON datasets collected from Overpass turbo can then be imported directly into MAPublisher for styling into a finished map. Use the Import tool to load the data onto an Adobe Illustrator artboard. From here, you can open the MAP View editor to adjust the scale and projection information for each map data layer. For this map, reproject the data into State Plane NAD 83 to preserve an accurate spatial scale. Set the scale option to 25,000 and customize the position of the map data on the artboard.

If needed, use the Vector Crop tool to trim the map data down to a specific area of interest, and simplify the layer to create smoother lines by removing excess vertices.

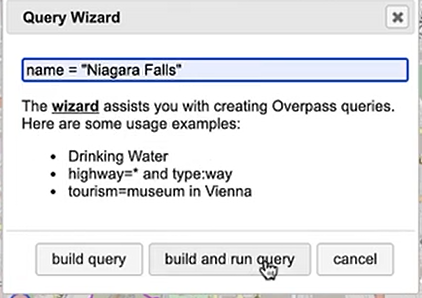
Back in Overpass turbo, you can build more specific query statements to extract individual features from larger data categories. Use the statement: name = “Niagara Falls”, to select polygon features specific to the waterfalls in that area.

Import this new data into MAPublisher, and drag and drop it into the same MAP View as the water layer. The data will be automatically scaled and projected to align with the water layer. Apply a graphic style fill for the water bodies and waterfall area.

Next, we can go back to Overpass Turbo and extract road and highway data. You can build out more complex query statements using basic database operators (i.e. and/or). For longer, complex query statements it helps to create saved queries that you can re-use. This map uses a saved query statement called “selected roads with residential” to extract line features covering most road types:

(highway=primary or highway=secondary or highway=cycleway or highway=path or
 highway=motorway or highway=trunk or highway=tertiary or
 highway=neighborhood or highway=footway or highway=service)


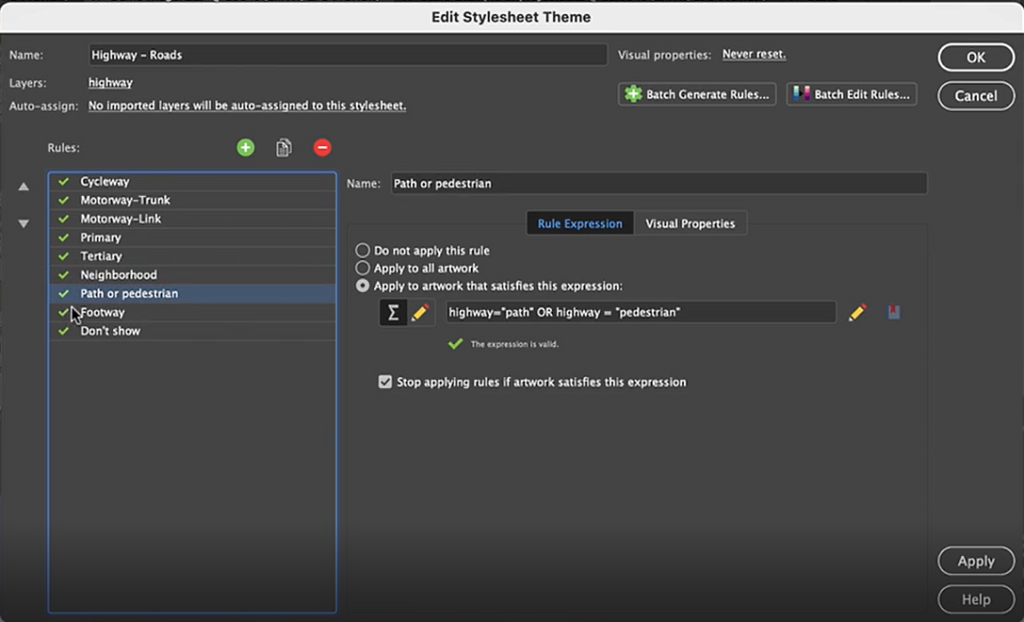
Import the roads data into the same MAP View as the other datasets. If you look at the MAP attributes you can see the road data is split into several different types. Steve use’s MAP Themes to create rules-based stylesheets to visualize the different road lines based on their road-type attributes. Steve designed a rule-set that made minor roads more subtle in appearance, while major roads and highways became more prominent. He also used colour to distinguish between pedestrian and vehicle network links.

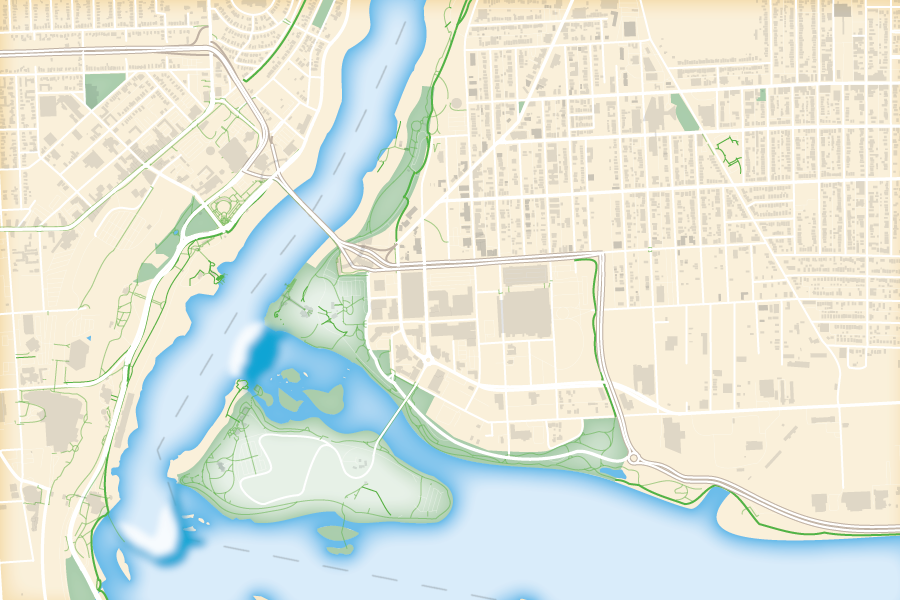
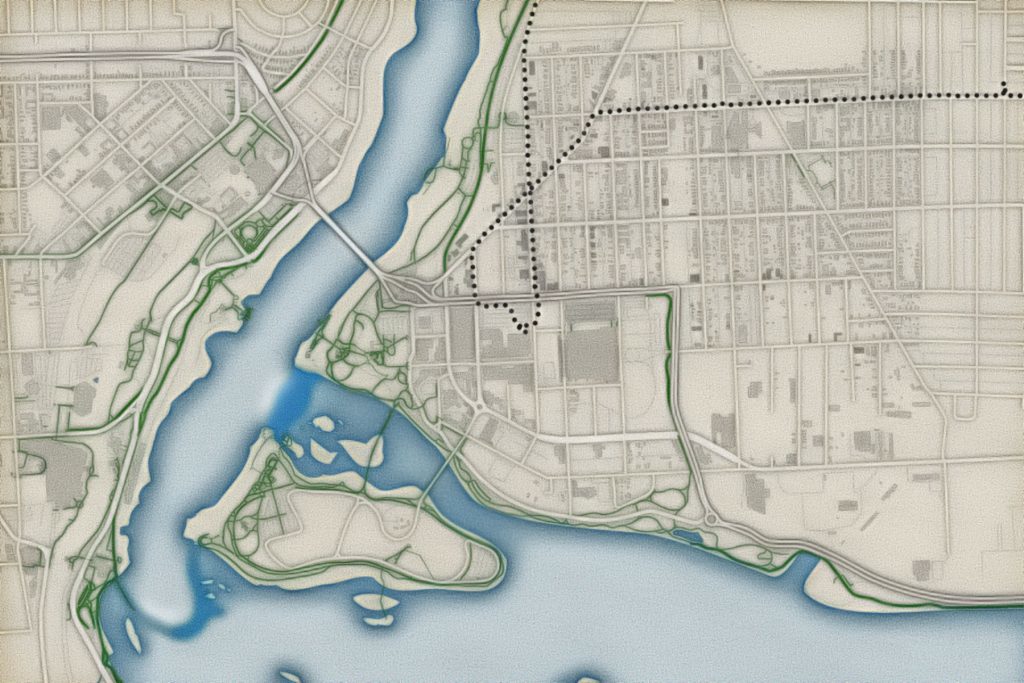
Repeat this process with a building footprint layer and crop all layers in the final map to the artboard extent. The finished product is shown below (top). Some final touch-ups in photo editing software can be used to create a more stylized appearance (bottom).

Exported map from Illustrator

Stylized version modified with Photo editing software

***

About the Author

Steve Spindler has been designing compelling cartographic pieces for over 20 years. His company, Steve Spindler Cartography, has developed map products for governments, city planning organizations, and non-profits from across the country. He also manages wikimapping.com, a public engagement tool that allows city planners to connect and receive input from their community using maps. To learn more about Steve Spindler’s spectacular cartography work, visit his personal website. To view Steve’s other mapping demonstrations, visit cartographyclass.com

Making a Map Without Knowing What the Final Extent or Scale Will Be

Ever have the problem that you want to make a map and you are waiting on the final extent or scale, but you want to get started adding data and working on the layout? Here are a couple of tips to make your life easier.


1. Move artboards around without moving your data

Geographic features in Adobe Illustrator are generally referenced to a known coordinate system. This coordinate system is mapped to Adobe Illustrator’s “Global Coordinate System” which has its origin at the top-left corner of the first artboard in a document. What this implies is that artboards can be moved around within this reference system in order to show different geographic data on the page. However, by default, moving an artboard moves any art that overlaps it as well. Obviously moving any referenced data around is going to ruin its spatial accuracy so this is something we want to avoid. Luckily there are two ways of doing this.

The first is to select the Artboard tool and click the Move/Copy artwork with artboard button to the right of the artboard name in the control panel above the document window.

Active artboard tool at the top left.
Deactivated Move/Copy artwork with artboard button at right.

With this option turned off, you are free to move the artboard around without disturbing any of the geographic data.

There is one downside to this though: you may have map elements such as titles, legends, grids, masks etc. that you want to stay locked in place on the artboard while you move it around the geographic data. The easiest way to do this is to simply lock any layers that contain geographic features, unlock the map elements, and activate the Move/Copy art with artboard option.

Non-map layers are unlocked while the layer that contains geographic data is locked.
Activated Move/Copy artwork with artboard button at right.

When the artboard is repositioned, your data will stay in the correct geographic location and your map elements will move with the artboard, keeping the same relative position.

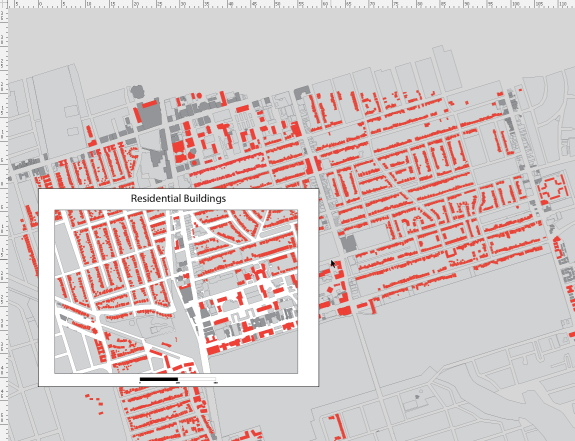
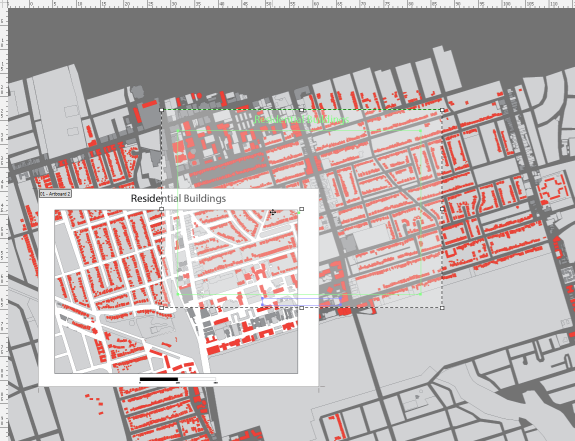
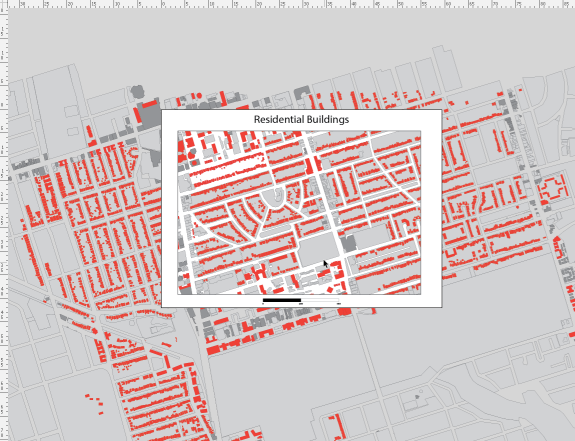
Three images showing an artboard moving while the geographic data stays put.

2. Set up a clipping mask in conjunction with a grid

The previous example used a white polygon with a hole in the middle as a mask to provide whitespace around the edge of the map. Another way to achieve this is to use a clipping mask to hide geographic features outside the extent of the mask. This works well by itself, or when combined with a grid or graticule layer.

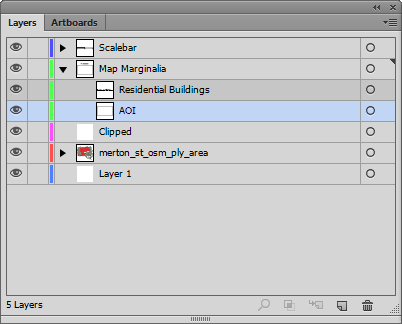
We have taken the previous example, deleted the mask and adjusted the colour of the background polygons slightly. We have also added an AOI polygon that will serve as the clipping mask extent.

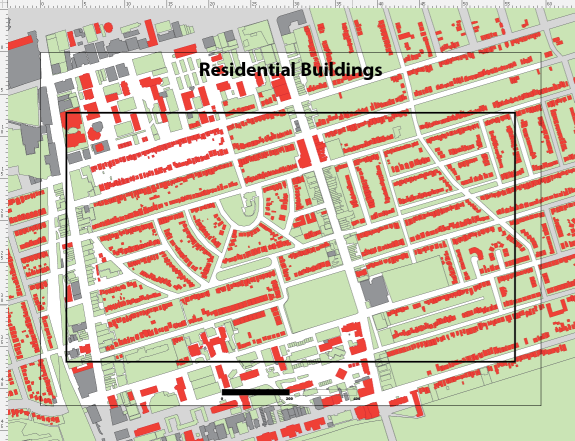
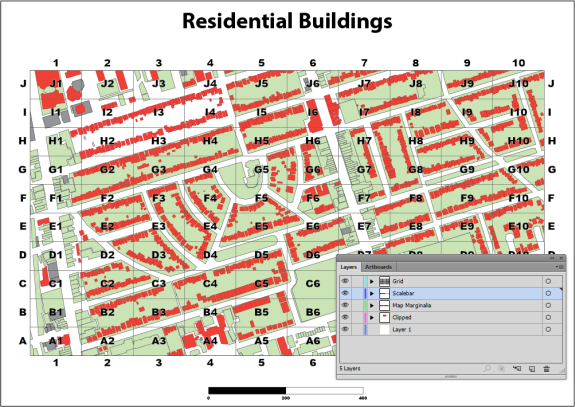
Artboard extents are visible along with some data, a title, a scalebar and the clipping polygon.

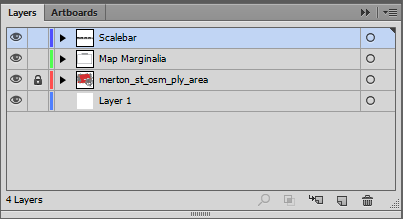
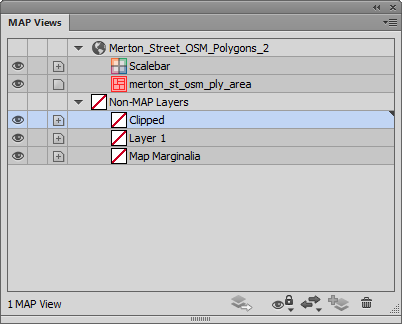
To create a clipping mask, the first thing we’ll make a new layer called Clipped. Make sure that it is a non-MAP layer (verify this in the MAP View panel).

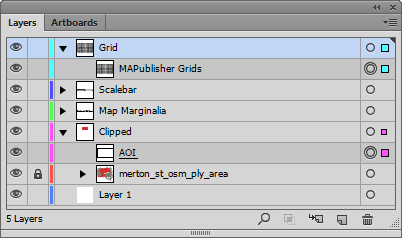
The new Clipped layer can be seen in both the Layers panel and the MAP Views panel.

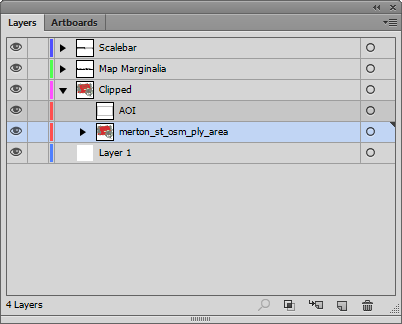
Next, drag both the AOI layer and layers that contain geographic data into the Clipped layer making sure that the AOI rectangle is above the layer holding the geographic features.

The AOI layer and the MAP Layer are added to the Clipped layer.

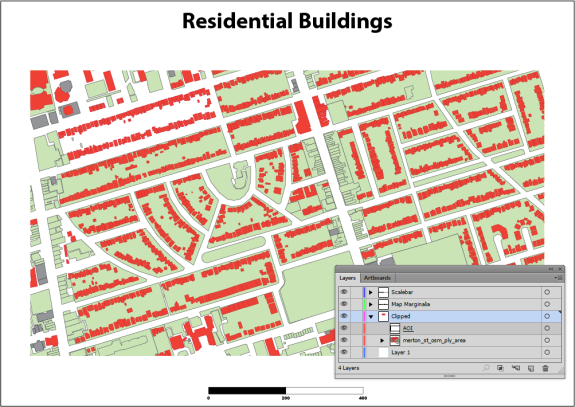
Now if we select the Clipped layer and click on the Make/Release Clipping Mask button (Second from the left at the bottom of the panel) we should see the AOI rectangle become invisible and the MAP layer is visible within the extent of this path.

The clipping path gets underlined in the Layers panel and the geographic features are clipped to its shape.

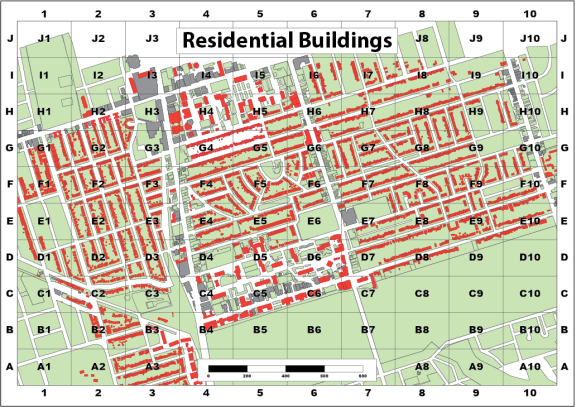
We can now add a grid over the top of the clipped area using the Grids & Graticules tool. You will find that the default extent of the grid is the same as the spatial data. You will need to resize the grid to match the clipping mask.

Index/reference grid overlaid on the map.

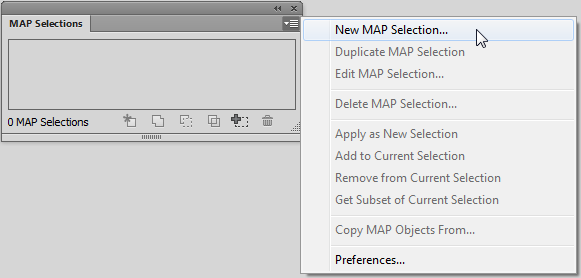
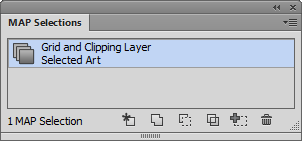
If you want to change the spatial extent of the map you have to adjust both the clipping polygon and the grid. It would be nice to group them and resize it together, but Adobe Illustrator doesn’t allow groups to span multiple layers. One way around this is to use a saved selection. To do this, select the clipping mask and the MAPublisher Grids, then choose Select | Save Selection. Give the selection a name like Grids and Clipping Mask.

Grid and Clipping Mask selected.
New MAP Selection
Art Selection

Now if you need to adjust the spatial extent of the map you can quickly choose the saved selection and resize the clipping mask and grid or move them both around the artboard simultaneously.

The saved selection can be applied by clicking the Apply as New Selection button on the left.
Map grid and clipping mask have been enlarged together. The scale has also been made smaller.

Defining the Projection or Projecting the Data?

Have you ever imported data that doesn’t quite line up how you’d expect? It may be that you’ve fallen victim to a common workflow error when importing GIS data. Some file types such as CSV can be used for GIS data but don’t contain coordinate system information. When you are importing data from this format, you first have to define the correct coordinate system.

In this example, we’re going to look at the common mistakes people make and how to avoid them. We’ll start with a world map in the Robinson projection.

Robinson mapWe have a CSV file containing points for large cities that we’d like to add to the map. We know from our data source that the CSV uses the WGS84 coordinate system. After selecting the file for import, the MAPublisher Import dialog box helpfully notifies us that some required settings are missing. We’ll click the blue ‘Required settings are missing’ link to continue.

required settingsSetting up the import, the coordinate column settings are easy since we have an X_COLUMN and a Y_COLUMN, but we can’t forget to check that the format is correct. The default is Projected units, but we know the file uses WGS84, and can tell by the numbers in the column that the coordinates are in decimal degrees, so we’ll change the format to reflect this information and click OK.
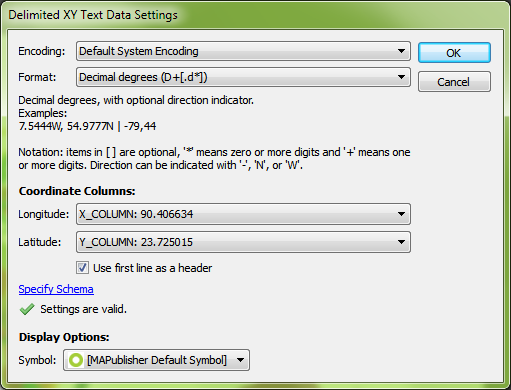
csv correct settingsBack at the import window, we see the message ‘Data loaded successfully’. Great! Let’s click OK and add the large cities to the map.

csv settings are okThe data has been imported but the result isn’t what we expected. The new layer has been added to a new MAP View, so let’s try dragging it into the Robinson MAP View with the world map.
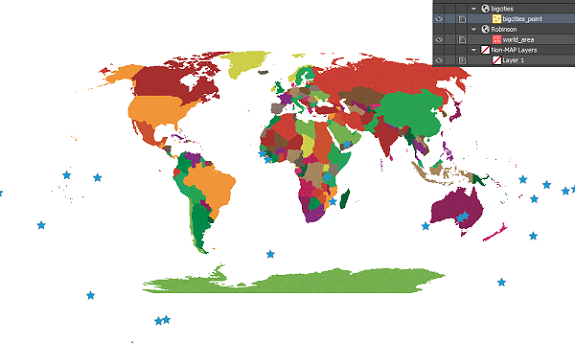
import incorrectWe get a prompt saying that there isn’t any coordinate system information. We want it to be in Robinson like the rest of the map so we’re going to leave the default setting of Same as: Robinson.
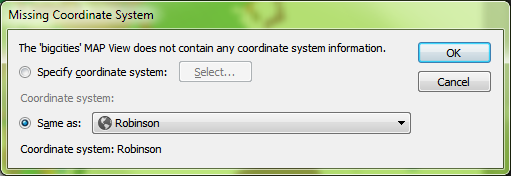
coordinate system undefinedThe data has moved, but it still doesn’t look like we were expecting. Where did we go wrong here?
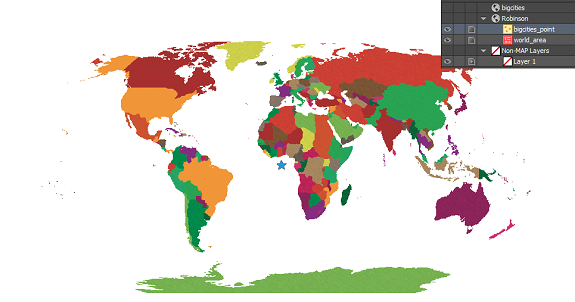
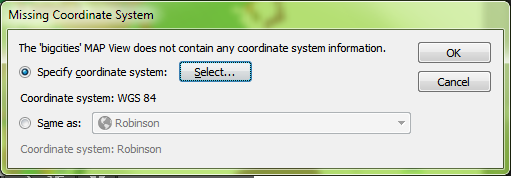
transformation incorrectThere are actually two places in the workflow where we could have avoided this common mistake. When we dragged the point layer into the Robinson MAP View, the pop-up dialog box prompted that a coordinate system wasn’t specified. We specified Same as: Robinson, thinking this was the correct choice, but we had already determined during import that the CSV was in WGS84. What we should have done here was to specify the coordinate system as WGS84.
missing coordinates correctThe other place where we could have avoided this error was right after setting up the CSV file for import. In MAPublisher 9.4, there’s a new button on the Import dialog box that allows you to see more detailed information about files being imported. By clicking the Advanced button in the Import dialog box, we would have noticed that there was no coordinate system specified.
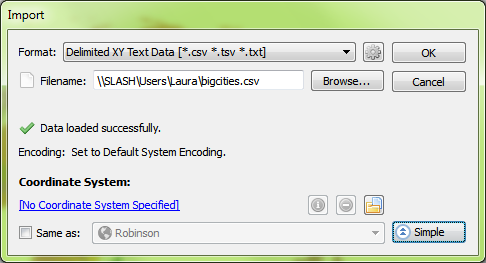
advanced import windowEven here, it might have been tempting to choose Same as: Robinson to add it to the Robinson MAP View, but this would import the points exactly the same as before – all in one location in the middle of the map. Instead, what we want to do is click the blue ‘No Coordinate System Specified’ link and choose WGS84. After this is set up, we’ll click OK to add the data to the map.
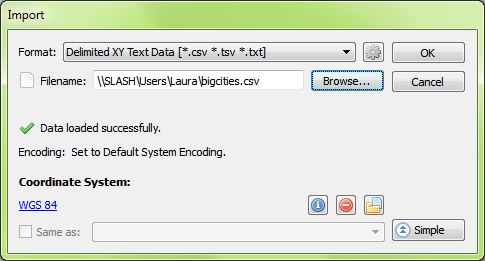
correct import settingsThe data still isn’t quite right – it looks the same as when we first imported it. But again we notice that it has been imported into a new MAP View, so we’re going to drag the layer into the Robinson MAP View and see what happens.
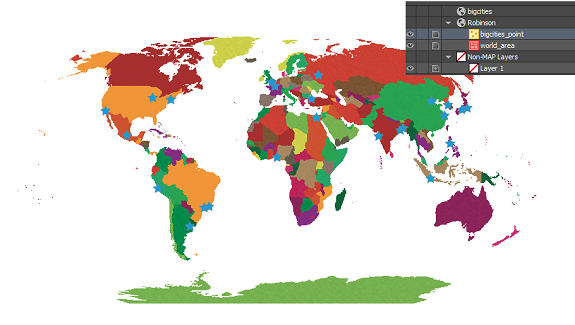
import incorrectPerfect! By assigning the correct coordinate system to the data during import, the points have been imported correctly!

correct map with pointsMistakes during data import are common amongst GIS users, especially those who are just starting out. In the first scenario, when we imported the CSV and added the data directly to the Robinson MAP View, we thought we were telling MAPublisher that we’d like it to match up with the map. What we really did was tell MAPublisher that the data was already in the Robinson projection, even though we knew it was in WGS84. What we should have done first was to define the projection by telling MAPublisher what coordinate system the data is already using. Once MAPublisher knows what system the data is starting in, we can then ask it to project or transform the data into the coordinate system that we’d like to use.
When working with data that doesn’t have coordinate systems already defined, it is very important to follow the workflow in the correct order to avoid frustration when the data doesn’t line up as expected. Always check your sources when using data that isn’t defined, and make sure you’re assigning the correct coordinate system before performing any transformations or projections.

Aligning data with different coordinate systems in MAPublisher

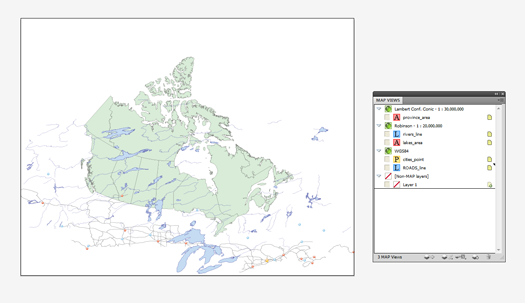
When first creating a map, very often you will find yourself having to align GIS data, especially if it is found or supplied by various sources. You might find that the coordinate systems assigned to each of the datasets might be different. This can prove challenging for many cartographers and GIS users. However, with MAPublisher, you can transform and align your datasets to one coordinate system very easily using the MAP Views panel.

Imported maps have different coordinate systems

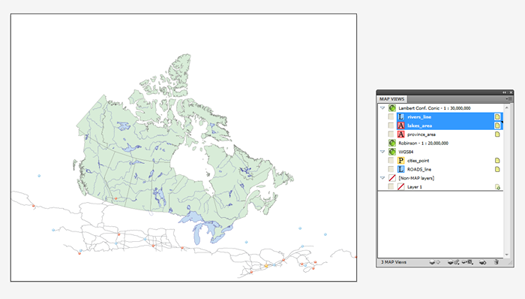
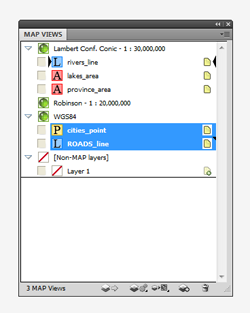
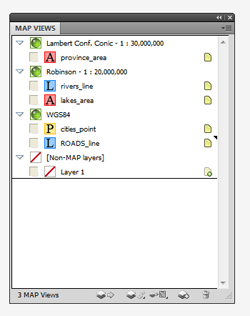
For example, we have five layers with three different coordinate systems. After importing them into MAPublisher, the result is three different MAP Views. The MAP Area layer (Province) is in a Lambert conformal conic projection. The MAP Line Layer (river) and MAP Area layer (lake) are in a Robinson projection. Lastly, the MAP Point layer (cities) and MAP Line layer (roads) are in a geodetic coordinate system WGS84.

5 MAP Layers with 3 different MAPViews

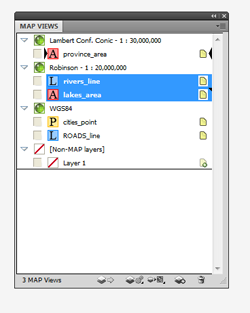
Let’s decide that the map we are creating here will have a Lambert conformal conic projection (the MAP View with the province area layer). Now, simply select the two layers in the Robinson MAP View, then drag them to the “Lambert Conf. Conic – 1: 30,000,000” MAP View.

MAPublisher trick: Drag and Drop Transformation

The rivers and lakes layers are now transformed and aligned to the province boundary layer.

Two map layers are transformed and aligned properly.

We will do the same for the cities and roads layers in the “WGS84” MAP View. Select the two map layers (cities and roads layers) then drag them to the “Lambert Conf. Conic – 1: 30,000,000” MAP View.

MAPublisher trick: Drag and Drop transformation for two map layers

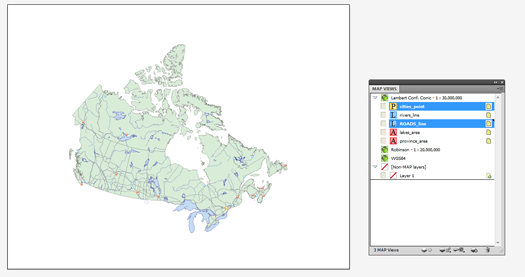
The cities and roads layers are projected on-the-fly. Now every layer is transformed to a Lambert conformal conic projection and aligned appropriately.

Every map layer is transformed and aligned properly


Related topics

Creating a Custom Coordinate System from a Predefined Coordinate System

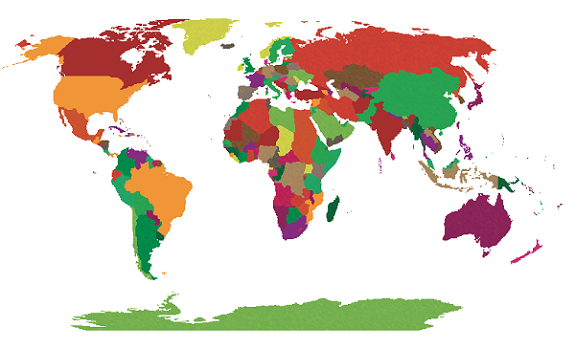
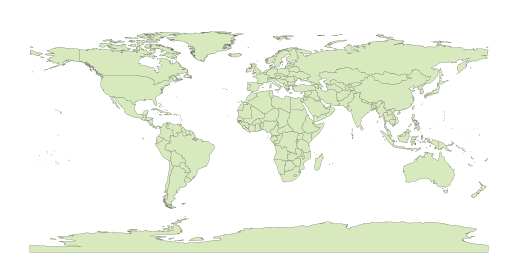
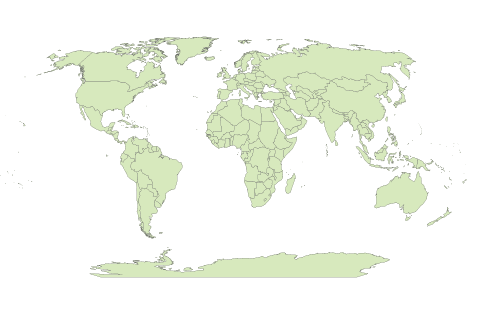
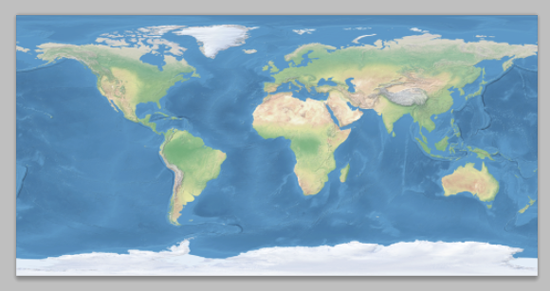
When transforming a world map in a geodetic system (such as WGS84) to a predefined projection (such as Robinson) using MAPublisher, the central meridian of the predefined projection should be set to 0 degree longitude as shown below.

Image 1: world map in WGS84

World map in WGS84 geodetic system

Image 2: world map in a predefined Robinson Projection

World map with the Robinson Projection with default settings

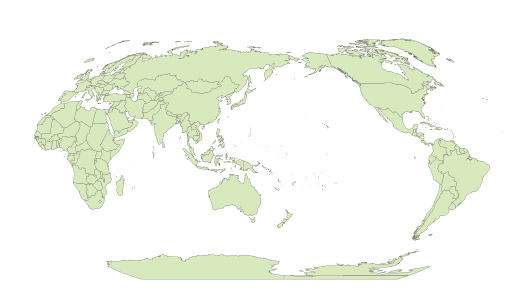
However, you might want to have a map with a different region centred on your map. For example, Image 3 below shows a world map with a part of Asia centred. In this case, the central meridian was set to 160 degrees East.

Image 3: world map in a custom Robinson Projection with a central meridian value set to 160 degree East

World map in a custom Robinson projection

Today we’ll introduce how to create a custom coordinate system by modifying a predefined coordinate system. We’ll use an example using a GIS dataset world.mif available in the MAPublisher Tutorial folder. We are going to transform a world map to a custom central meridian value with the Robinson projection.

Step 0 : import the “world.mif” file from MAPublisher tutorial folder.

step0:: import World.mif

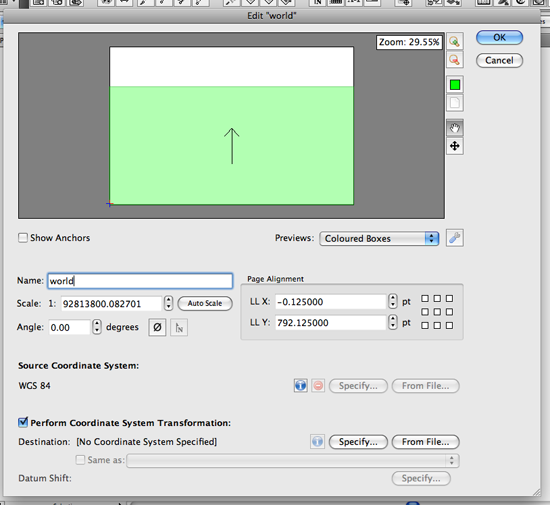
Step 1 : Open the MAP View Editor window from the MAP Views panel.

In the MAP View Editor window, you can see that the scale of the map, position of the map extent with respect to the current document extent, and most importantly the current coordinate system assigned to the MAP View.

step 1: MAP View Editor window

We are going to transform the MAP View from WGS84 to the Robinson projection with a custom central meridian value. Check the “Perform cordinate System Transformation option.

Click the Specify button under the “Perform Coordinate System Transformation” section. It will open the “Specify Destination Coordinate System” dialog box.


Step 2: Creating a custom coordinate system with the Robinson projection

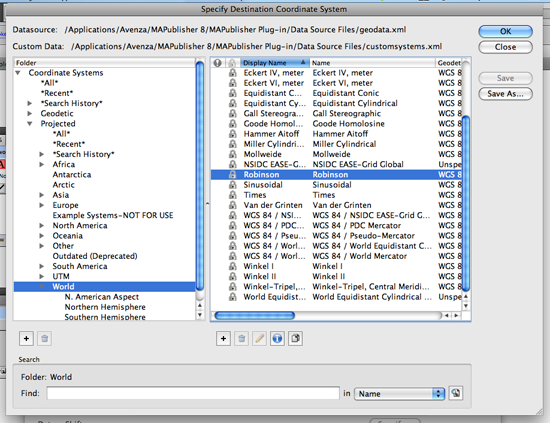
We are going to create a custom coordinate system based on the Robinson projection by modifying the existing Robinson projection. Find the existing Robinson projection from the list.

On the left side, navigate to Coordinate system > Projected > World. Highlight the folder “World”. You will see the list of the predefined coordinate systems available on the right side of the window. Find the “Robinson” and highlight it.

Step 2: Finding the predefined Robinson Projection

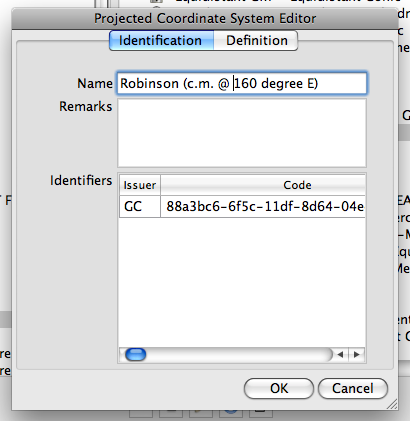
Once the predefined Robinson projection is highlighted, click the Copy button copy button at the bottom. It will duplicate the existing coordinate system and will open the “Projected Coordinate System Editor” dialog box for the duplicated coordinate system.

In the Projected Coordinate System Editor dialog box, there are two tabs: Identification and Definition. In the Identification tab, enter a new name for this customer coordinate system. This name will be used when you are searching the object.

Step 4: Projected Coordinate System Editor

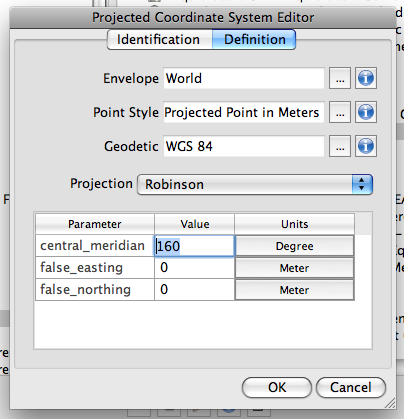
Click the Definition tab. Change the value of central_meridian from 0 (default) to 160. Click OK to apply this new setting. You have just made a custom coordinate system based on the existing Robinson projection.

step 5: Projected Coordinate System Editor (Definition)

Step 3: Complete the Transformation

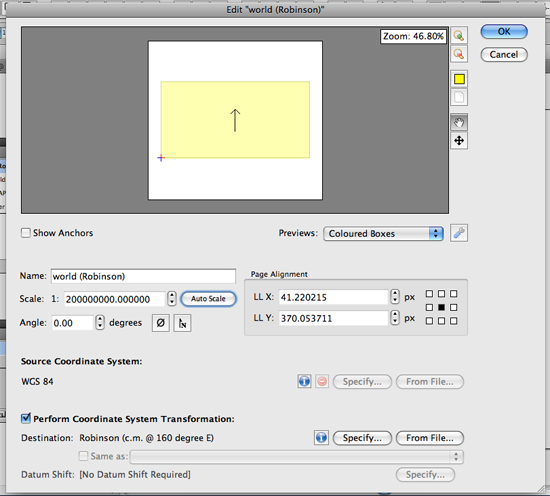
Under the “Perform Coordinate System Transformation”, the new custom coordinate system just created is indicated. Now you are ready to transform your map.

step 6: MAPView Editor with a transformation option

Now the world map is successfully transformed into the custom coordinate system (Robinson with the central meridian set to 160 degree East).

Transformed Robinson

You might want to take a look at this other blog about the new transformation engine implemented in MAPublisher 8.3.

Transforming an image into a custom coordinate system with Geographic Imager

You can use the same approach to transform your image into a custom coordinate system.

First, we open a world image that has a WGS84 coordinate system.

a world image in WGS84

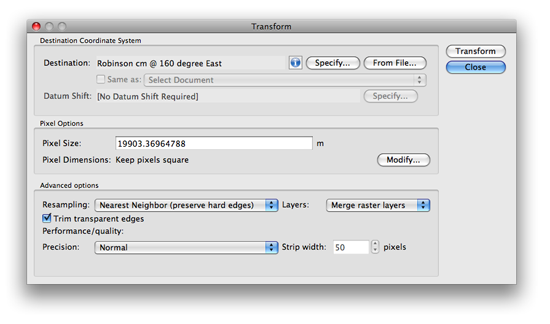
Click the Transform button in the Geographic Imager main panel. It will open the Transform dialog box.

Click the Specify button. Now repeat Step 2 illustrated above to create a custom coordinate system. Once you select the custom coordinate system in the “Specify Coordinate System” dialog box, it will be indicated in the Transformation dialog box (in the example below, a custom coordinate system “Robinson cm @ 160 degree East” is selected as a destination coordinate system).

Geographic Imager: Transform dialog box

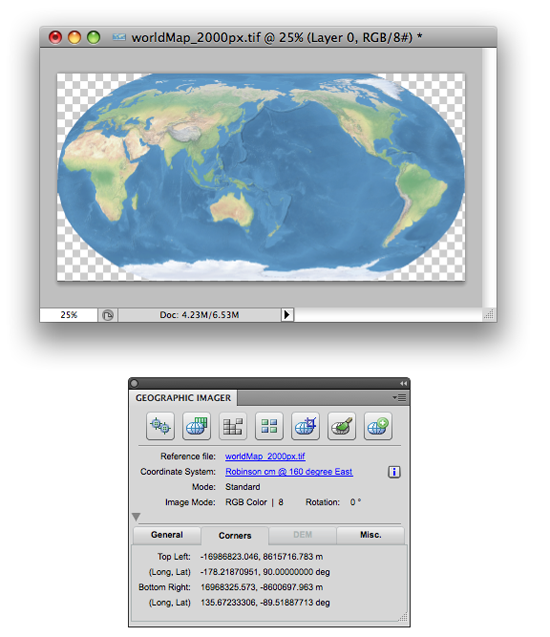
As soon as you click the Transform button, the transformation process will start. Once the transformation process is completed, the Geographic Imager main panel will indicate the new custom coordinate system name.

Transform completed.

Create a New MAP View For Adobe Photoshop Paths in MAPublisher 8.3

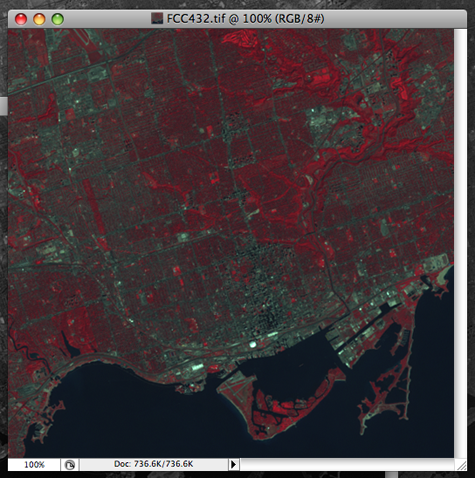
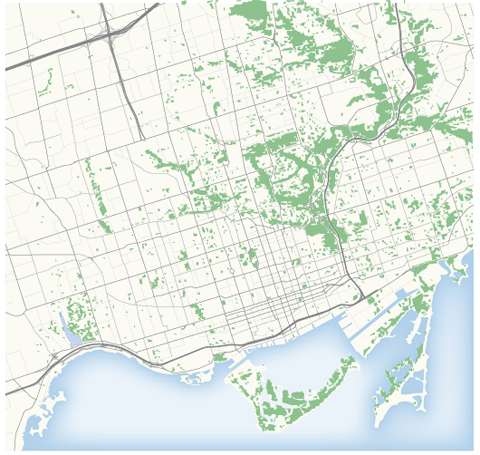
In our previous blog, we introduced you to a quick technique for remote sensing imagery: to depict a type of land types (green area) from a Landsat image. Below is the false composite image created in the previous blog. Basically, the red area indicates a lot of green vegetation (i.e. trees, shrubs, etc).

False color composite image produced in the previous blog

Now, you may be wondering how those red areas can be extracted from Adobe Photoshop and Geographic Imager and brought into Adobe Illustrator and MAPublisher?

An overview of the steps involved in this technique:

In Adobe Photoshop & Geographic Imager:

  1. Select the red areas with Adobe Photoshop tools.
  2. Save the selected pixel areas as “work path”.
  3. Export the saved work path as an Adobe Illustrator file.
  4. Export the georeference information from Geographic Imager option menu.


In Adobe Illustrator & MAPublisher:

  1. Import the exported Adobe Illustrator file with the work path.
  2. Assign the georeference information to the imported work path objects.
  3. If you have already made a map with vector dataset, open the AI file.
  4. Import MAP Objects from the AI file with the workpath to another AI file with a map.
  5. Drag and Drop transformation to align the workpath objects geospatially.


Below are the detailed step-by-step intructions.

In Adobe Photoshop and Geographic Imager:

1. Select the red areas

Open the false color composite image in Adobe Photoshop. Now, all the red areas must be selected using any of the following Adobe Photoshop tools.

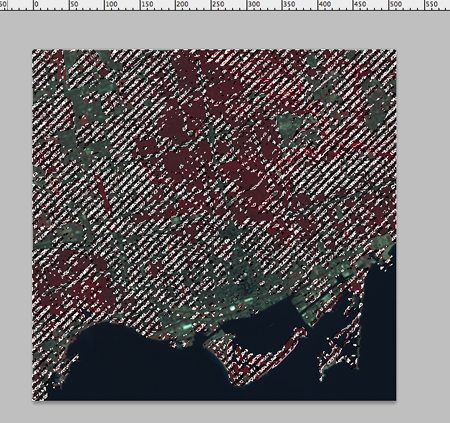
Selected red areas

For example, you can select the red areas using the Magic Wand Tool. You may want to adjust the tolerance values as you begin to select the areas so that only the approriate areas are selected. If you disable the “Contiguous” option from the settings tool bar, it selects all the areas with the same color as the one you collected.
Magic wand tool settings

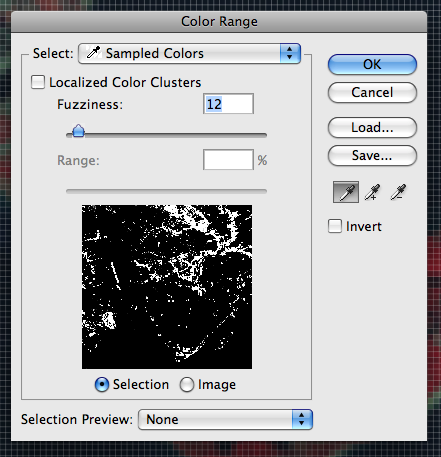
If you want to more precisely select red areas with a preview window, use the Color Range Tool (Select > Color Range). With this tool, sample the color of interest first. In this example, you might want to pick only the areas with the bright red color or you might want to be within a specifc range of red. Using this, you will have more control on which areas are selected.

Photoshop Tool: Color Range

Of course, there are other techniques you can use to collect the pixels with a specific color. The two suggested above are used quite commonly in our workflows.

2. Save the selected pixel areas as “work path”

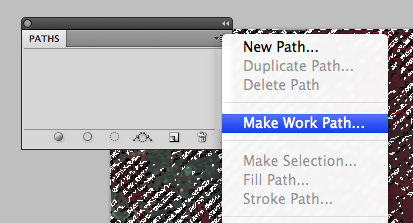
After all the red areas are selected, save the selected area as “work path”. This option is available in the Paths panel options menu.

Save the selected areas as Work Path

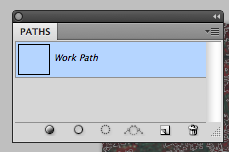
The selection is now saved as a “work path” in the Paths panel.

Saved work path in the Paths panel

3. Export the saved work path as an Illustrator file

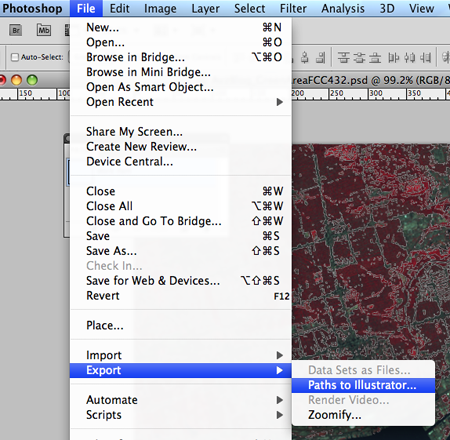
Once the work path is saved in the Paths panel, export it as an Illustrator file (File > Export > Paths to Illustrator).

Save the work path as an Adobe Illustrator file

4. Export the georeference information from Geographic Imager option menu

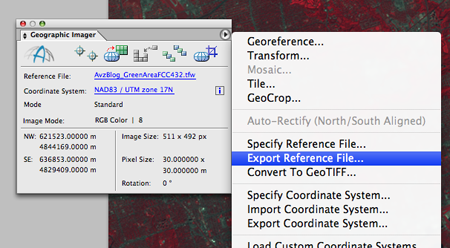
As you saw in the Geographic Imager panel for the false color composite file in the previous blog, this image was georeferenced. Furthermore, we need to export the georeference information that will coincide with the Adobe Illustrator file we just exported.. You can export this georeference information as a MapInfo TAB file or Blue Marble Reference RSF file from the Geographic Imager panel options menu.

Export the georeference information from the Geographic Imager panel

In Adobe Illustrator & MAPublisher

5. Import the exported Illustrator file with the work path

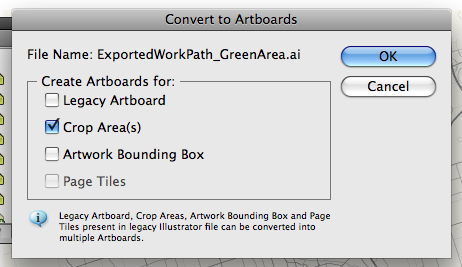
In Adobe Illustrator, open the Adobe Illustrator file exported from Adobe Photoshop (Step 3). Upon opening, a prompt appears to convert the exported file to Artboards. Select the second option “Crop Area(s)”.

Opening the exported Adobe Illustrator file.

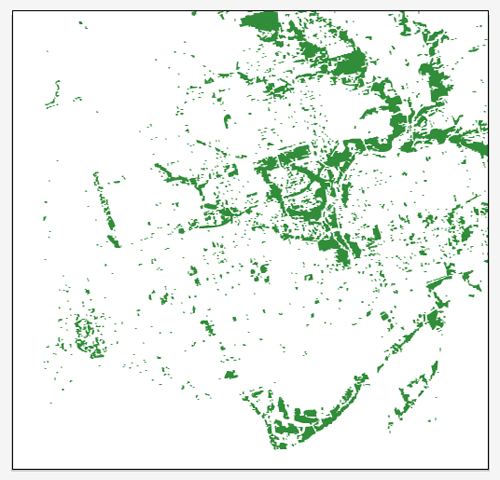
When the artboard is opened, it seems like there is nothing on the artboard. It is simply because there is no color assigned to the fill and stroke. I put a green color for the work path objects.

Imported exported Adobe Illustrator file.

6. Assign the georeference information to the imported work path objects

The imported work path objects do not have the georeference information yet. We exported the reference file in Step 4 using Geographic Imager. We are going to use the exported reference file to assign the georerefernce information to those work path objects.

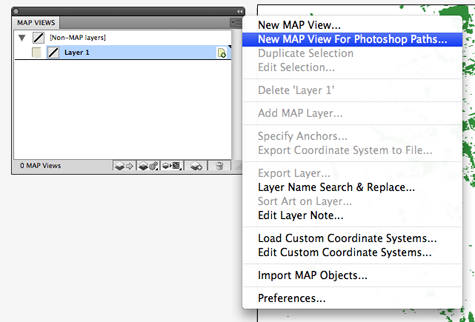
In the MAP Views panel options menu, click “New MAP View For Photoshop Paths…”

MAP Views option: Create a MAPView from Photoshop path

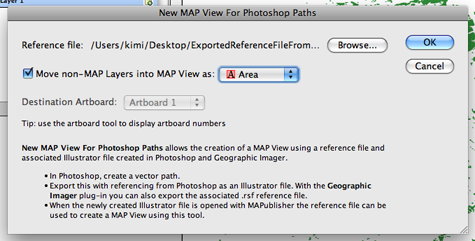
Browse for the exported reference file (either *.tab or *.rsf format from Step 4). Then select “Area” as the feature type for the MAP layer to be created.

MAPublisher dialog: New MAPView For Photoshop Paths

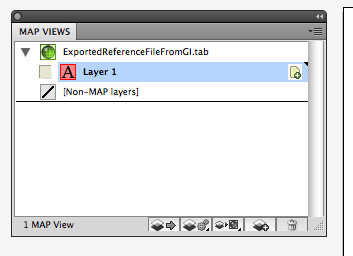
The georeference information from the original image is now inherited by the work path objects in the Adobe Illustrator file.

A created new MAPView

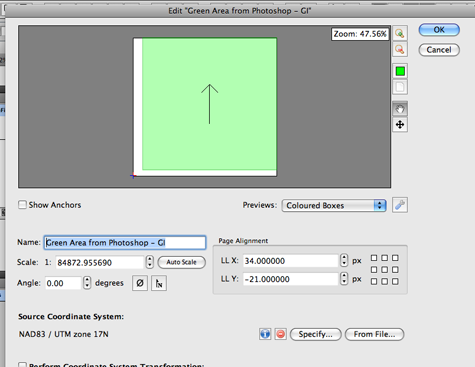
In the MAP View Editor window, you can see all the spatial information such as the coordinate system, scale, and map extent within the artboard. The name for the MAP View is renamed to “Green Area from Photoshop – GI” for Step 8.

At this point, if you have GIS dataset, you can import them to this document. However, I will show you one more MAPublisher trick to bring this green area into an existing MAPublisher file.

The georeference information in the MAPView editor

7. If you have already made a map with vector dataset, open the Adobe Illustrator file

Keep the Adobe Illustrator file with the work path objects open, then open another Adobe Illustrator file with MAPublisher MAP Objects. Now you have two Adobe Illustrator documents open.

8. Import MAP Objects from the AI file with the workpath to another AI file with a map

Make the Adobe Illustrator document with the map (not with the work path objects) the current document.

On the MAPublisher Toolbar, click the “Import MAP Object” button.

In the “Import MAP Objects” dialog box, select the MAP View “Green Area from Photoshop” and click OK.

Imported MAPView with a MAP layer

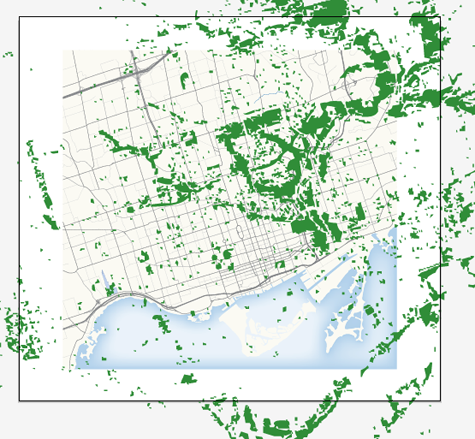
All the path objects are imported to the other Adobe Illustrator file with the base map.

Imported green area from another Adobe Illustrator document

However, the imported objects and the base map do not line up appropriately. It is because the scale of the MAP View with the work path and the MAP View with the base map do not match. You can line up those green areas with a simple step.

9. Drag and drop transformation to align the workpath objects geospatially.

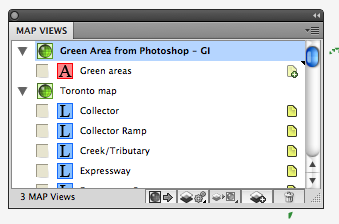
In the MAP Views panel, there are two MAP Views: “Green Area from Photoshop – GI” for the work path imported from another AI file and “Toronto map” for the base map.

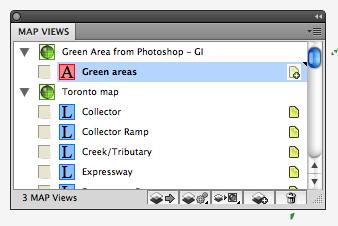
Click the MAP Layer “Green areas” in the MAPView “Green Area from Photoshop – GI” …

MAPublisher special trick: Drag and Drop transformation

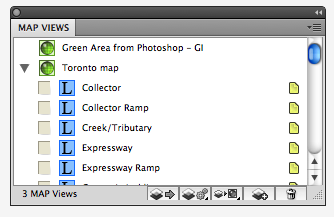
… then drag the map layer to the MAPView “Toronto map”.

Transformed MAP Layer

Now all the green areas (work path objects) are lined up nicely with the base map.

Green areas in Toronto nicely lined up with the base map.

Try this out with your own workflow to see how it may improve your maps.

Avenza State Plane Coordinate System Map

MAPublisher and Geographic Imager provide an extensive library of predefined coordinate systems available for referencing or transforming mapping projects.

In the United States, the NGS (National Geodetic Survey), a department of NOAA (National Oceanic and Atmospheric Administration) has established a system that divides the United States into 124 zones, each with its own custom projected coordinate system. This system is known as the State Plane Coordinate System. It is important to note that there are two sets of State Plane coordinate systems defined in the United States, one based on the North American Datum of 1927 and the other based on the North American Datum of 1983. In addition to NAD 83, the NAD83 HARN and NSRS2007 adjustments are available for use. All three versions of NAD83 are available in metres, feet or international feet.
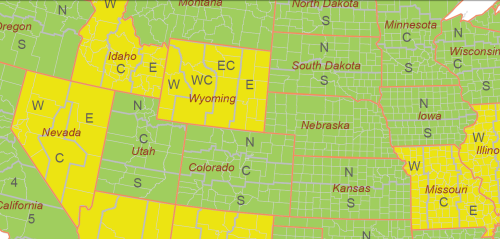
State Plane Coorindate Systems projections

There are four projections for SPCS. The geometric direction of each state determines the projection utilized. For states that are longer in the east-west direction, the Lambert Conformal Conic is used. States which are longer in the north-south direction use the Transverse Mercator projection. The panhandle of Alaska, which has the sole distinction of lying at an angle, garners the use of the Oblique Mercator projection, while Guam uses a Polyconic projection.

These coordinates systems are all defined in the MAPublisher and Geographic Imager library, however the initial question “which one do I need to use for my map” cannot be answered by the software itself.

There are a number of ways to determine in which zone your American area of interest lies. One online resource, searchable by latitude and longitude coordinates, can be found on this NGS website.
In an effort to better assist mapmakers in their selection of the appropriate system, the Avenza support team has prepared a searchable interactive map using MAPublisher 8.2 MAP Web Author tool. View the SPCS map here.
A MAPublisher geospatial PDF of the same map is also available for download here.

Transform into State Plane Coorindate Systems using MAPublisher

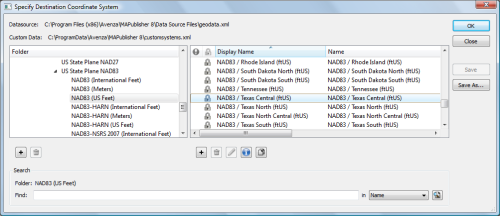
When it comes time to transform your data into the appropriate State Plane Coordinate System zone, use the MAP View Editor Perform Coordinates System Transformation option. When you specify the destination coordinate system for the transformation, navigate to Coordinate Systems > Projected > North America > United States > US State Plane NAD 83 – on the right hand list, you’ll find all the state plane zones sorted by state name and zone name: select the right one!

Note: similarly you can select the NAD27 state plane systems from Coordinate Systems > Projected > North America > United States > US State Plane NAD 27 if appropriate.

Easy Transformations in MAPublisher

MAP Views are designed to provide an easy method of accessing settings for specifying and transforming coordinate systems, for editing scale and data placement on the page and for exporting to GIS formats. The MAP Views panel allows for merging Adobe Illustrator layers, georeferencing existing Adobe Illustrator artwork, changing multiple layer names, and reprojecting data on the fly.

That said, it’s possible to create multiple MAP Views that each contain a different projected coordinate system in a single map document. The MAP Views panel can be used to move Adobe Illustrator layers from one MAP View to another, enabling to reproject vector art quickly. Layers can be moved via drag-and-drop or with the new Switch MAP View button. This is useful when testing how a variety of projections may fit into your layout. It’s also useful for creating inset or key maps.

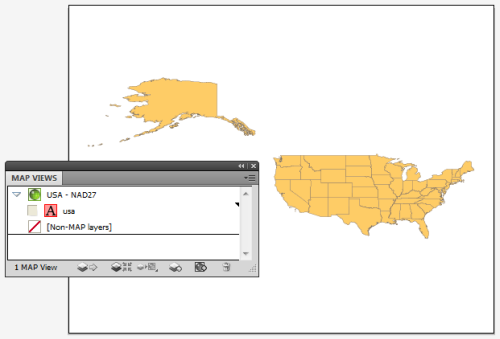
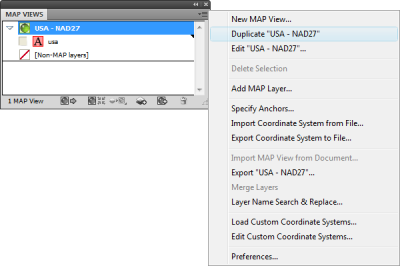
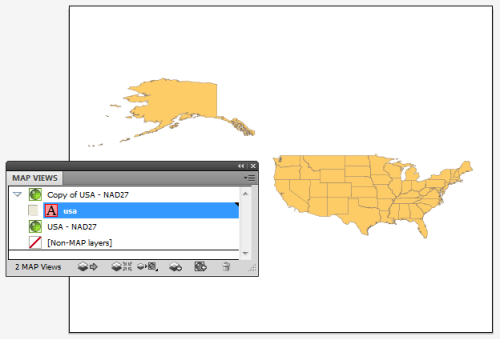
Here we have one MAP View called USA – NAD27. As the name of it implies, it is in a NAD27 projection. Let’s go ahead and make another MAP View so that we can perform an easy transformation.

USA in NAD27

Click the USA – NAD27 MAP View to highlight it, then click the panel option menu (upper right corner) and click Duplicate “USA – NAD27”.

Duplicate MAP View

This creates a Copy of USA – NAD27 MAP View. Double-click the Copy of USA – NAD27 MAP View to edit it.

Copy MAP View

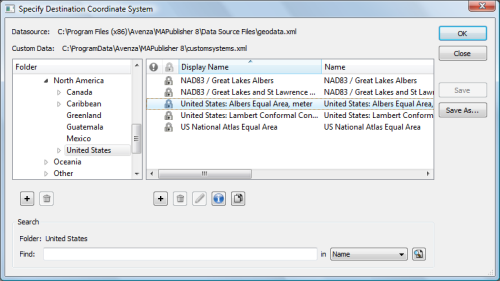
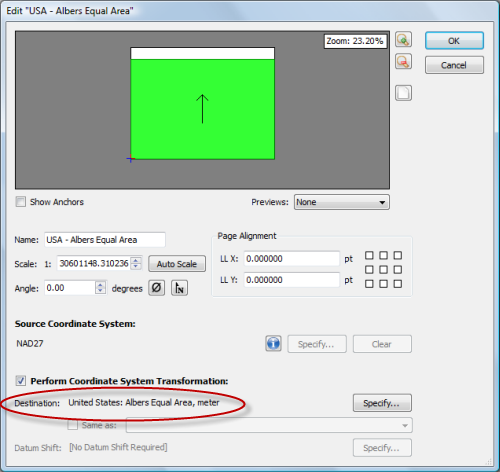
In the MAP View editor, change the title to USA – Albers Equal Area in the Name box. Below you can see that it is currently in NAD27. Check the Perform Coordinate System Transformation check box and click Specify. In the Specify Coordinate System dialog box, in the Folder list, navigate to Projected > North America > United States and click United States: Albers Equal Area, meter in the right-hand pane. Click OK.

Choose Albers Equal Area

Back in the MAP View editor box, you’ll see that the Destination is updated to show the United States: Albers Equal Area projection. Click OK.

MAP View editor

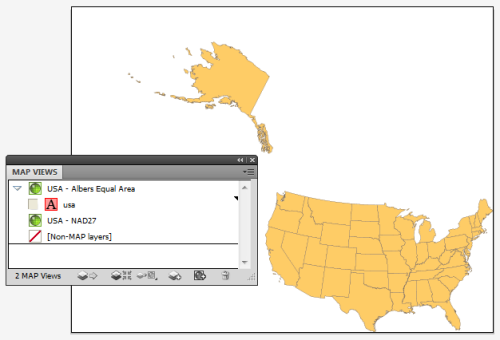
The map is reprojected from NAD27 to Albers Equal Area.

Albers Equal Area projection

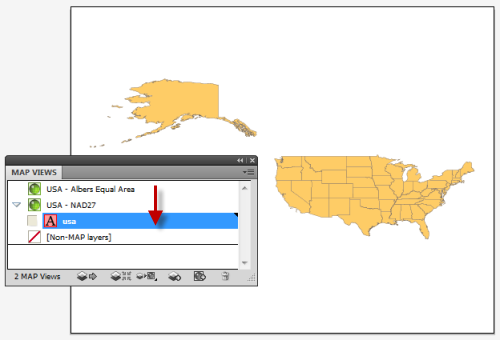
To reproject-on-the-fly by drag-and-drop, click the usa area layer and just drag it to the USA – NAD27 MAP View. Now you can switch back and forth between projections. You may want to duplicate the usa area layer in the Layers panel so that you can have two different projections at the same time. Remember to use the MAP View editor if you want to move a MAP view to retain spatial referencing.

Back to NAD27

To learn more about MAP Views, view Chapter 4 of the MAPublisher user guide.

News Archive