My Account     Contact Us     Cart

Indexing Your Atlas Just Got A Whole Lot Easier

Whether you’re an experienced atlas maker or embarking on your first project, we all know producing an atlas is no small task. In short, an atlas consists of a series of maps and an associated index. Seeing that cartographic content often takes centre-stage, when planning your project it is easy to assume that the map-making process will be the most demanding. However, the proper indexing of map features is often by far the largest individual task when it comes to producing an atlas and can be quite burdensome.

You will be happy to know that MAPublisher 10.1 makes indexing that much easier with the addition of the Include Page Numbers option to the Make Index tool. This advanced option completely automates the indexing of page numbers while also enabling the indexing of two page maps on a single artboard.

For atlas makers, this new addition will streamline and improve the indexing process making it a key enhancement considering the primary function of an atlas index is to help the user locate features and points of interest on map pages.

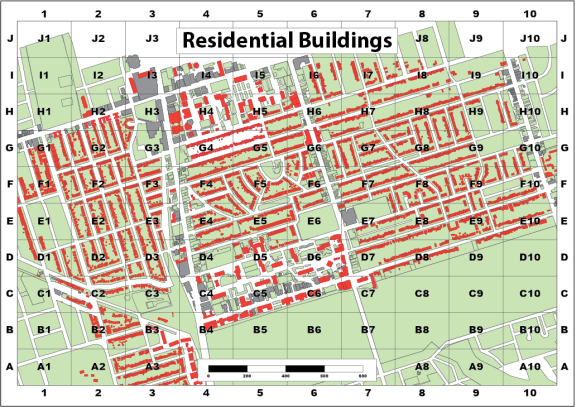
Let’s take a look at a basic street atlas of Cochrane that was created using MAPublisher 10.1. Cochrane is a town located in Northern Ontario which is not only famous for its mascot Chimo but also for being the hometown of Tim Horton, founder of Canada’s largest coffee chain.

The atlas is divided into four sections: grid cells A1, A2, B1, and B2. Each cell contains two separate map pages numbered two through nine.

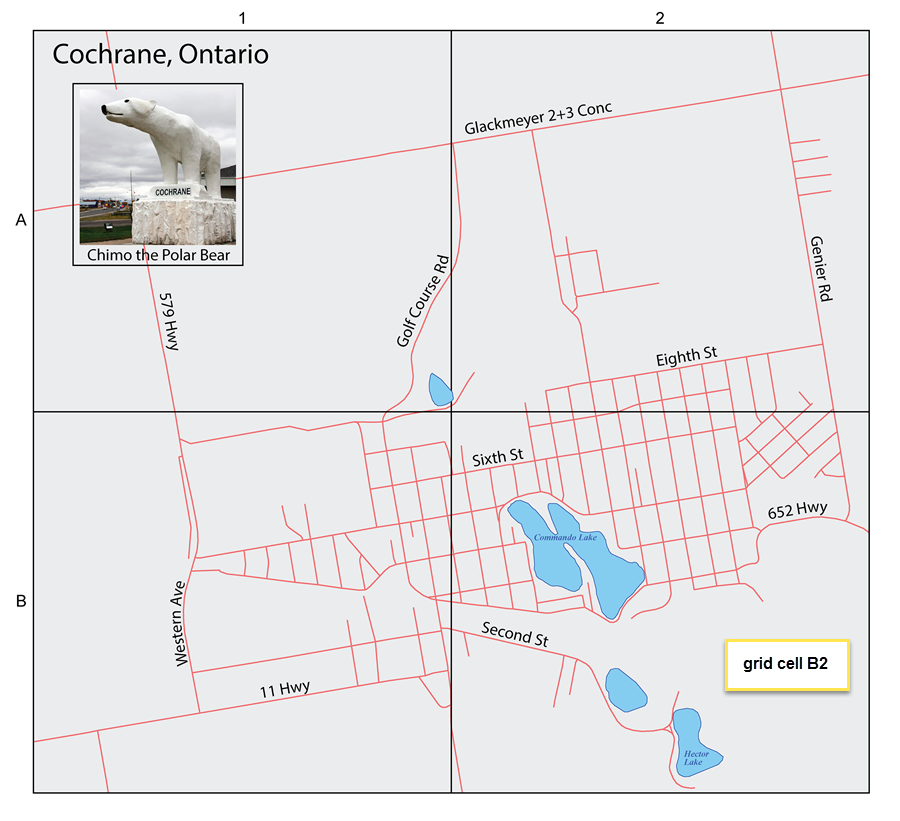
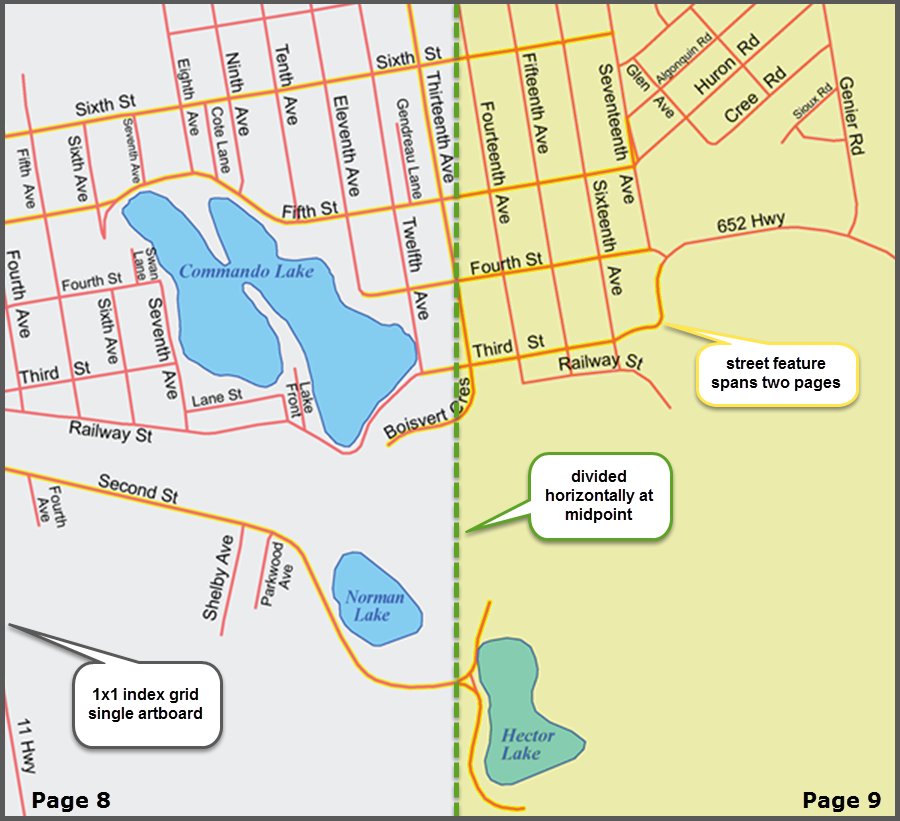
The following is a simple example which demonstrates the page indexing for atlas pages eight and nine found in grid cell B2.

Atlas makers can now index their page numbers as easy as one-two-three!

Step 1

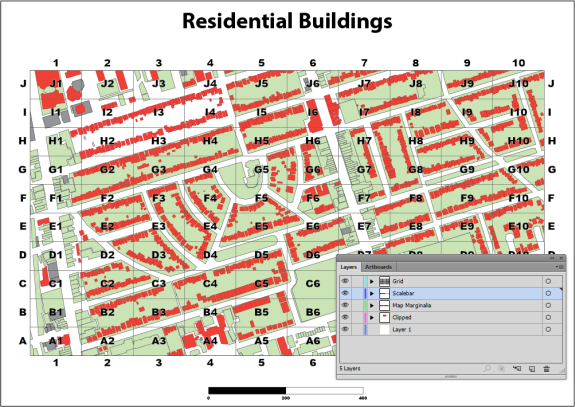
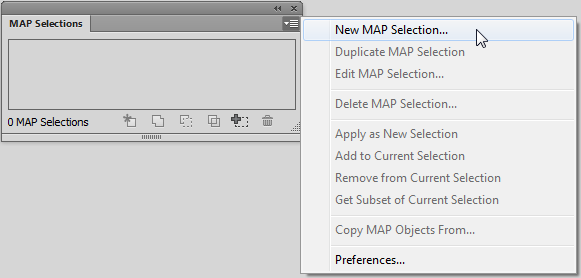
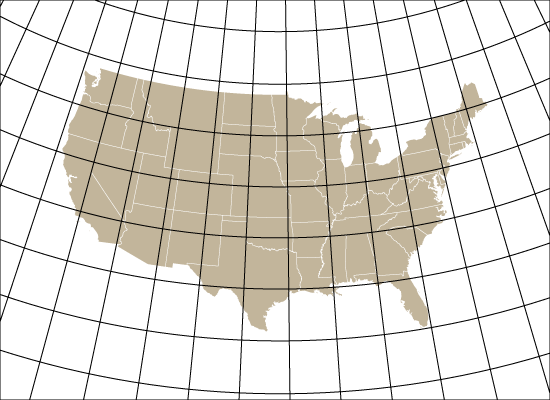
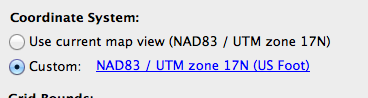
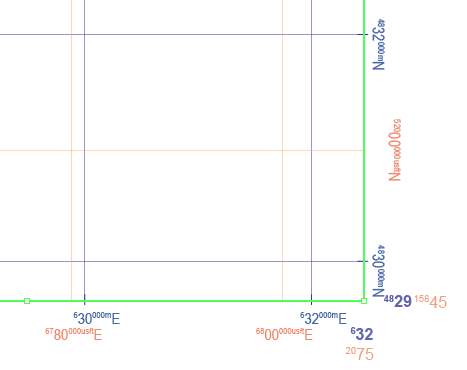
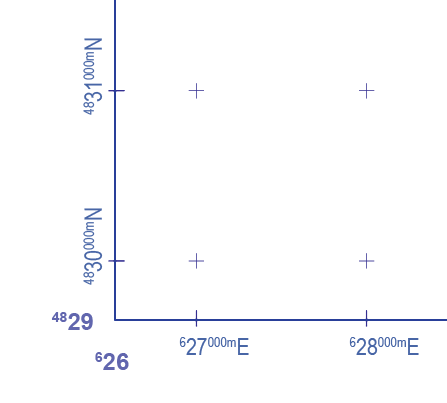
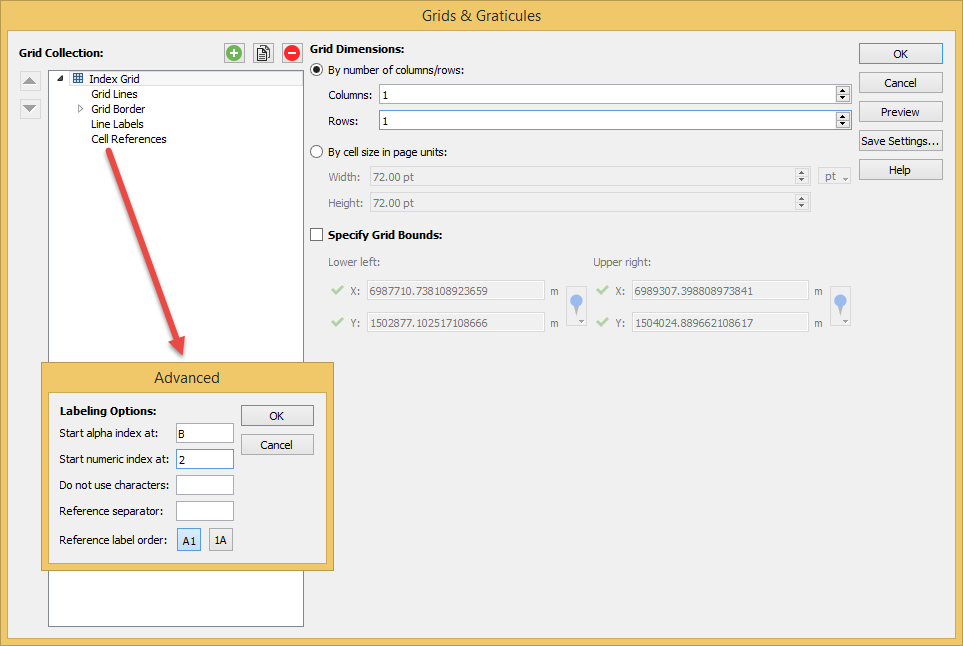
To start, using the MAPublisher Grids & Graticules tool, generate an Index Grid with one column and one row (1×1). Although the Index Grid option was selected, the Graticules or Measured Grid options can also be used if it better suits your atlas design needs. Additionally, Cell Reference Labelling was enabled and the advanced labelling options were set as displayed.

Step 2

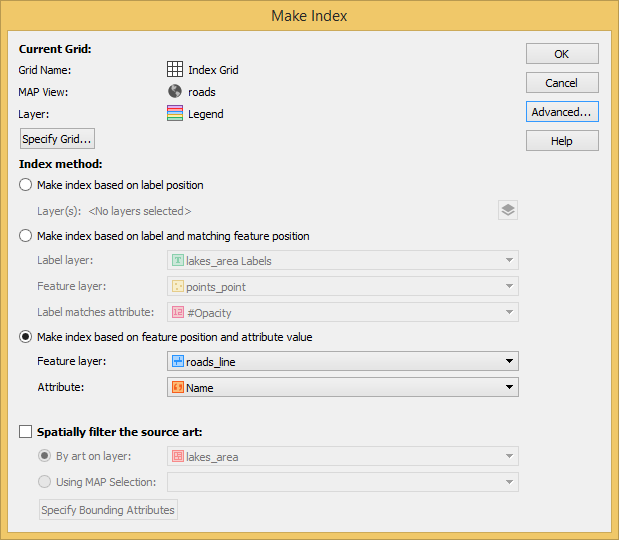
With your Index Grid created, access the Make Index tool which will initiate the map indexing process. Since we’re indexing streets in this example, we’ll go with the Make index based on feature position and attribute value. The feature position will be relative to which page or pages the street falls on while the attribute value will reflect the street’s name. In this example, streets which span two atlas pages have been highlighted with a yellow background on the map.

Step 3

Since a single artboard is being used to map features which span two atlas pages, the Advanced option Include Page Numbers will be enabled with a horizontal page layout dividing the artboard into page 8 and page 9.

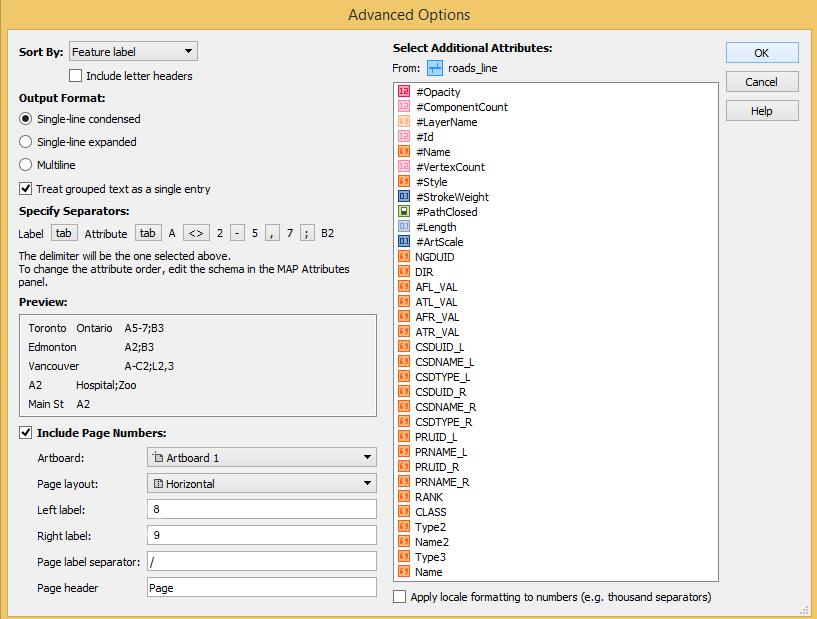
Simply click OK twice and your atlas pages will be indexed with the results written to a delimited text file as displayed below. From here, this file can be formatted and refined within a software like Microsoft Excel, Google Sheets, Quark Xpress, etc.

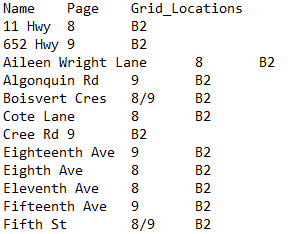
Portion of the delimited text file output:

Same portion imported into Microsoft Excel:

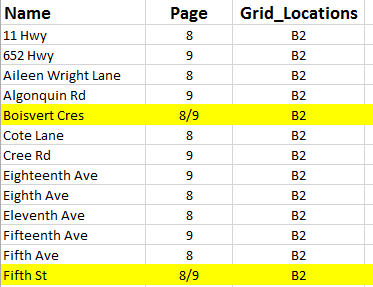
Note: streets which span two pages have been highlighted to correspond to the map example.

By necessity, indexes are created towards the end of each project when atlas delivery deadlines are looming. It is therefore very important that the technology and methods used be robust and efficient. The introduction of the Include Page Numbers option has enhanced and simplified the map indexing process while meeting the specialized needs of atlas cartographers.

For more information see:


The Difference Between Constraints and Bounds in a Graticule

A graticule is the network of lines of latitude and longitude drawn at regular intervals on a map. Graticules are created in MAPublisher using the Grids and Graticules tool. In some maps, you may want to limit the area on the map that a graticule covers. For example, you may want it to cover only the map’s area of interest. The image below is a map of North America with a graticule drawn at 5-degree intervals. US State boundaries are drawn in white. In this post, we’ll modify the graticule three times so it conforms to the edges of the image, so it covers only the Continental United States, and lastly a combination of the previous two modifications.

North America with a graticule of 5 degree intervals.

MAPublisher can limit the geographic extents of a graticule in two ways: using Grid Bounds and using Grid Constraints. In both cases, you’ll specify the lower left and upper right corners of the graticule. Specifying Grid Bounds will limit the extent of the graticule to a rectangular area while specifying Grid Constraints will limit the graticule along lines of latitude and longitude. If both Grid Bounds and Grid Constraints are specified, the graticule will cover an intersection of the two areas. The image below shows bounds and the constraints and the intersecting area which forms the graticule.

Bounds and the constraints and the intersecting area which forms the graticule.

To modify a graticule so that it conforms to the edges of the image, you’ll need to specify grid constraints. In the Grids and Graticules dialog box, click the Specify Grid Constraints check box and set the Lower Left and Upper Right corners to the corners of the image which are -127°, 7° and -50°, 65° respectively.

Specifying Grid Constraints.

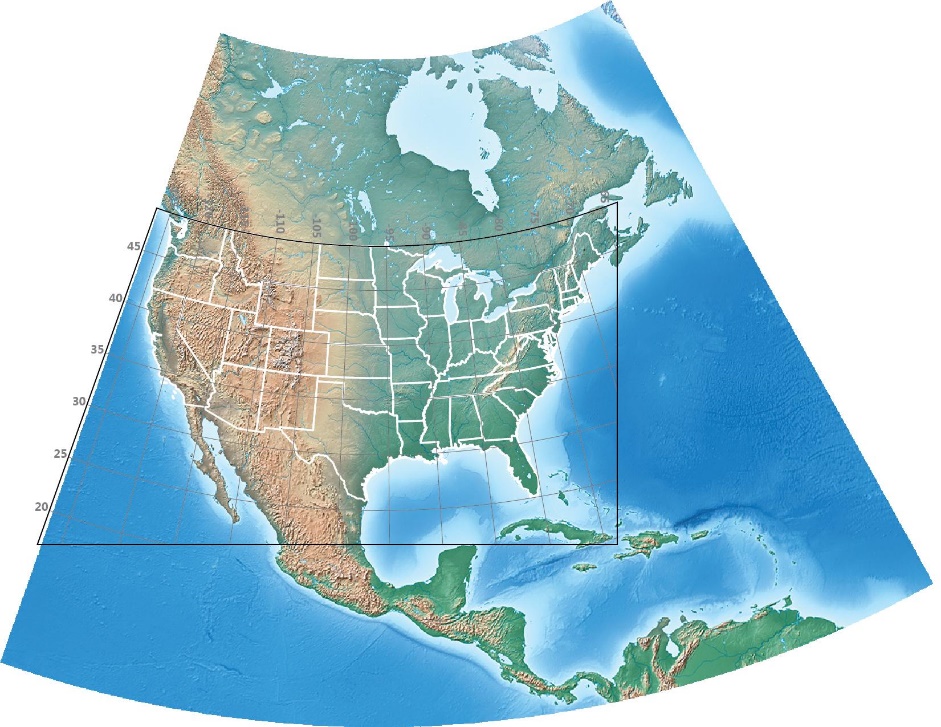
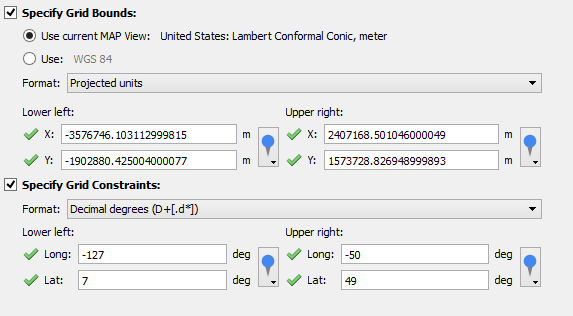
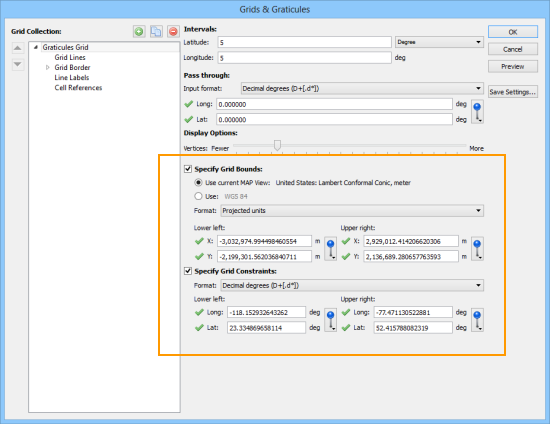
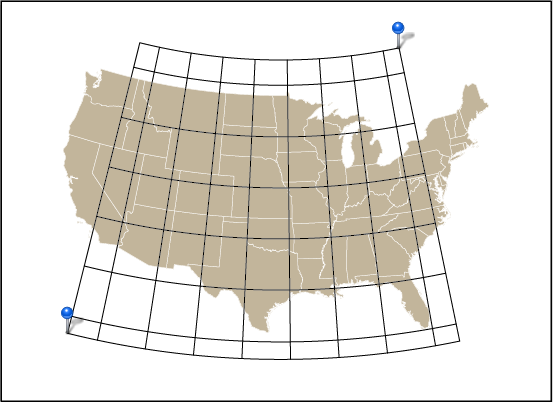
To create a rectangular graticule covering only the lower 48 states, click the Specify Grid Bounds check box and set the Lower Left and Upper Right corners to the corners of that area. Tip: click the MAP World Locations drop-down arrow to choose the values for the lower left and upper right corners.

Specifying Grid Bounds.

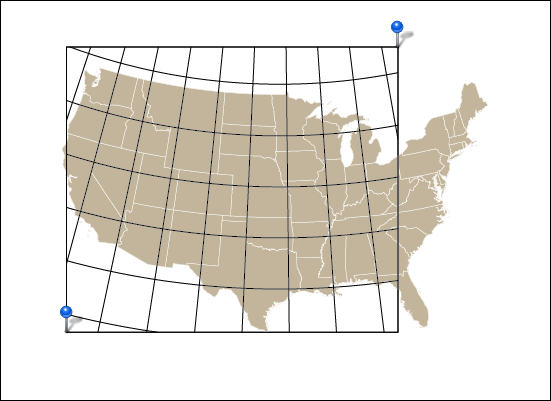
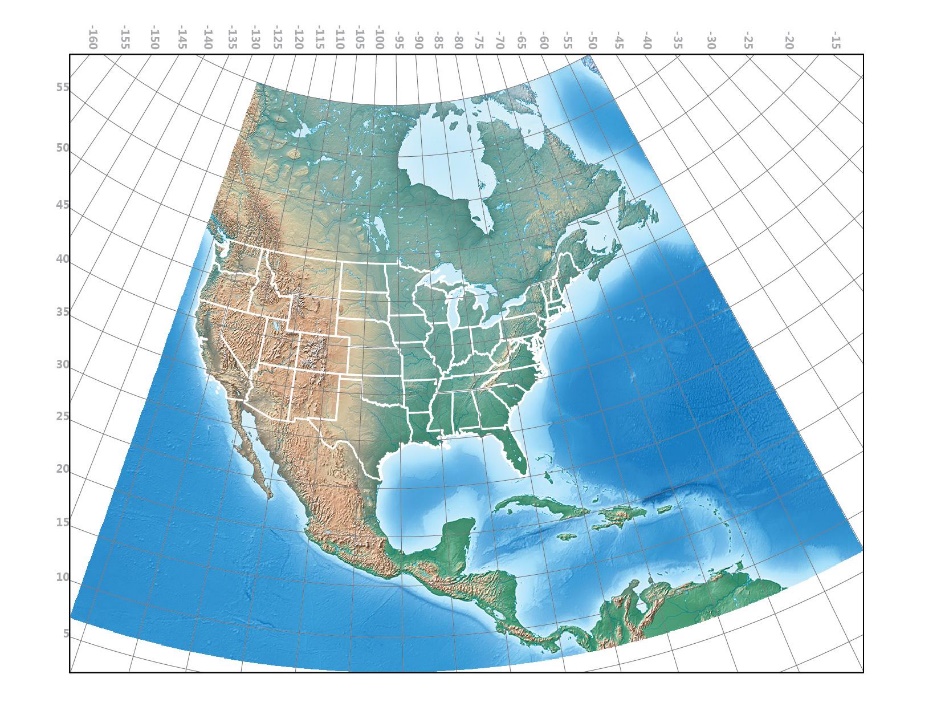
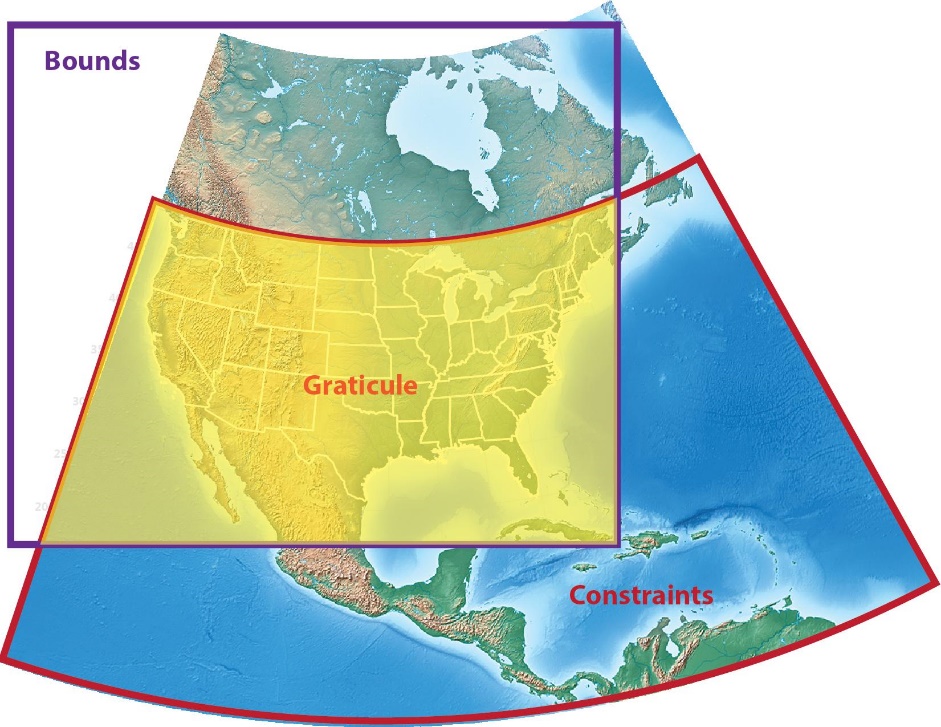
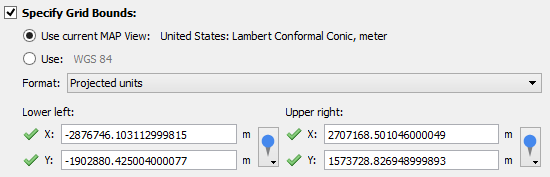
When both Specify Grid Bounds and Specify Grid Constraints check boxes are both checked, the graticule will cover an intersection of each of the extents. For instance, in the map below, the northern extent follows the 49th parallel at the Canadian border, the western extent is at the edge of the image (127° west) and the south and east extents are the same as in the previous map.
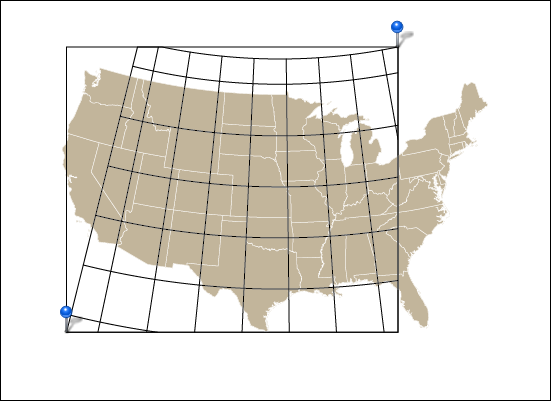
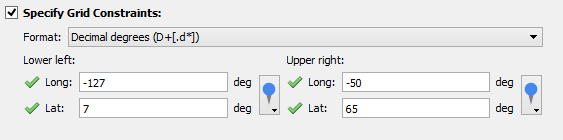
Both Specify Grid Bounds and Specify Grid Constraints selected.


Making a Map Without Knowing What the Final Extent or Scale Will Be

Ever have the problem that you want to make a map and you are waiting on the final extent or scale, but you want to get started adding data and working on the layout? Here are a couple of tips to make your life easier.


1. Move artboards around without moving your data

Geographic features in Adobe Illustrator are generally referenced to a known coordinate system. This coordinate system is mapped to Adobe Illustrator’s “Global Coordinate System” which has its origin at the top-left corner of the first artboard in a document. What this implies is that artboards can be moved around within this reference system in order to show different geographic data on the page. However, by default, moving an artboard moves any art that overlaps it as well. Obviously moving any referenced data around is going to ruin its spatial accuracy so this is something we want to avoid. Luckily there are two ways of doing this.

The first is to select the Artboard tool and click the Move/Copy artwork with artboard button to the right of the artboard name in the control panel above the document window.

Active artboard tool at the top left.
Deactivated Move/Copy artwork with artboard button at right.

With this option turned off, you are free to move the artboard around without disturbing any of the geographic data.

There is one downside to this though: you may have map elements such as titles, legends, grids, masks etc. that you want to stay locked in place on the artboard while you move it around the geographic data. The easiest way to do this is to simply lock any layers that contain geographic features, unlock the map elements, and activate the Move/Copy art with artboard option.

Non-map layers are unlocked while the layer that contains geographic data is locked.
Activated Move/Copy artwork with artboard button at right.

When the artboard is repositioned, your data will stay in the correct geographic location and your map elements will move with the artboard, keeping the same relative position.

Three images showing an artboard moving while the geographic data stays put.

2. Set up a clipping mask in conjunction with a grid

The previous example used a white polygon with a hole in the middle as a mask to provide whitespace around the edge of the map. Another way to achieve this is to use a clipping mask to hide geographic features outside the extent of the mask. This works well by itself, or when combined with a grid or graticule layer.

We have taken the previous example, deleted the mask and adjusted the colour of the background polygons slightly. We have also added an AOI polygon that will serve as the clipping mask extent.

Artboard extents are visible along with some data, a title, a scalebar and the clipping polygon.

To create a clipping mask, the first thing we’ll make a new layer called Clipped. Make sure that it is a non-MAP layer (verify this in the MAP View panel).

The new Clipped layer can be seen in both the Layers panel and the MAP Views panel.

Next, drag both the AOI layer and layers that contain geographic data into the Clipped layer making sure that the AOI rectangle is above the layer holding the geographic features.

The AOI layer and the MAP Layer are added to the Clipped layer.

Now if we select the Clipped layer and click on the Make/Release Clipping Mask button (Second from the left at the bottom of the panel) we should see the AOI rectangle become invisible and the MAP layer is visible within the extent of this path.

The clipping path gets underlined in the Layers panel and the geographic features are clipped to its shape.

We can now add a grid over the top of the clipped area using the Grids & Graticules tool. You will find that the default extent of the grid is the same as the spatial data. You will need to resize the grid to match the clipping mask.

Index/reference grid overlaid on the map.

If you want to change the spatial extent of the map you have to adjust both the clipping polygon and the grid. It would be nice to group them and resize it together, but Adobe Illustrator doesn’t allow groups to span multiple layers. One way around this is to use a saved selection. To do this, select the clipping mask and the MAPublisher Grids, then choose Select | Save Selection. Give the selection a name like Grids and Clipping Mask.

Grid and Clipping Mask selected.
New MAP Selection
Art Selection

Now if you need to adjust the spatial extent of the map you can quickly choose the saved selection and resize the clipping mask and grid or move them both around the artboard simultaneously.

The saved selection can be applied by clicking the Apply as New Selection button on the left.
Map grid and clipping mask have been enlarged together. The scale has also been made smaller.

What is the difference between Grid Bounds vs Grid Constraints?

In MAPublisher, the grid bound is the visual extent of the grid or graticule. The grid constraint is the geographic extent of the grid or graticule. It may be a little confusing since both grid bound and grid constraint are defined by coordinate values. In terms of hierarchy, think of the grid bound as the overall container of the grid and the constraint as being contained within the bound.

MAPublisher Grids & Graticules dialog box

These examples may help you better understand it.

1. In this example, the grid bounds are specified as the lower-left and upper-right of the artboard corners. Notice that the graticule extends all the way to the edge of the artboard (as specified). This is a very typical way to use a grid or graticule.

Grid bound extent set to artboard corners

2. Here, the grid bounds are still the lower-left and upper-right of the artboard. The grid constraint is based on the minimum and maximum longitude and latitude values of the specified MAP Locations. Notice that the rectangular black border of the grid bound is at the edge of the artboard. This is also a common way to use a grid or graticule, especially for larger scale maps.

Grid constraints set to MAP Locations

3. In this example, the grid constraints were disabled and, instead, the two MAP Locations are used to define the grid bounds. Notice that the rectangular black border of the grid bound is defined by two MAP Locations.

Grid bound extent set to MAP Locations

4. When both grid bound and grid constraint are set to the same coordinates (in this case, MAP Locations) you can see the result here. The grid bounds are clipping the grid constraints. This would not be an ideal situation to use grid constraints, but it is definitely possible to use it in this fashion.

Both grid bound and grid constraints set to MAP Locations

MAPublisher Grids & Graticules are highly customizable and we’ll be blogging more about its features.

Creating Grids in MAPublisher with an Alternative Coordinate System

In a previous blog about Grids and Graticules, we quickly introduced one of the major features of the new Grid and Graticule tool. We’d like to share another major feature when creating grids: creating grids with an alternative coordinate system.

For example, the MAP View has a coordinate system “NAD 83 / UTM zone 17N” (in metres). You might want to make grid lines with the same coordinate system but in different units. You can do so by creating a custom coordinate system and then specifying the desired unit (US Foot, for this example), then creating a grid based on custom coordinate system. In this example, a grid with NAD83/UTM zone 17N (metres) coordinate system is created in the blue colour. Another grid with a NAD83/UTM zone 17N (USFoot) custom coordinate system is created with the orange colour.

Specifying alternative coordinate system for grids

Example of grid lines with UTM in metres and US foot

Likewise, you can create multiple sets of measured grids with different coordinate systems in one MAP View (e.g. one set with NAD83 UTM, another with NAD27 UTM, another with some other local coordinate system) without the need to transform the MAP View.

MAPublisher: Enhanced Grids and Graticules Allows You to Share Grid Settings

If you haven’t noticed yet, we released an enhanced version of the Grid and Graticules tool (MAPublisher 8.7 and higher). With the new Grid and Graticules tool, you will find that you can export grid settings and save them. Most importantly, these grid settings files can be shared and imported to another document.

Once a grid is created, save the settings to a *.cfg file. Two configuration files are created per grid: grid settings and label settings.

settings files for grid and graticules

Grid settings configuration files store information for all related grid options (e.g. ticks, intervals, offsets, borders). Label settings configuration files store information for all related label options (e.g. axis labels, fonts, styles), even for multiple grids. Label settings are saved with _labelData suffixed to the file name.

Share the files and load the *.cfg file in the Grid and Graticules dialog box.

exchanging the settings for grid and graticules

Some of the major functions of the new Grid and Graticules tool are adding tick marks along border lines, placing cross hair symbol instead of lines for grid/graticule lines, styling lines and text more flexibly, and having more label options available. You can share the settings by exporting one and importing to another document as well. You can make a set of grid lines looking like this below.


A basic example of grid lines

News Archive