My Account     Contact Us     Cart

Avenza Releases MAPublisher 10.8 for Adobe Illustrator

Toronto, ON, April 27th, 2021 – Avenza Systems Inc., producers of the Avenza Maps® app for mobile devices and geospatial plugins for Adobe Creative Cloud®, including Geographic Imager® for Adobe Photoshop®, is pleased to announce the release of MAPublisher® 10.8 for Adobe Illustrator®. This latest version provides user interface and usability enhancements for several tools, an updated coordinate systems library, raster ECW format support, and other mapping engine enhancements.

MAPublisher cartography software seamlessly integrates more than seventy GIS mapping tools into Adobe Illustrator to help you create beautiful maps from GIS data. Import industry-standard GIS data formats and make crisp, clean maps with all attributes and georeferencing intact using the Adobe Illustrator design environment.

New features of the MAPublisher 10.8 plugin for Adobe Illustrator include:

  • User Interface and Tool Improvements: 
    • Multi-select attribute columns to batch modify attribute properties
    • Line Plotter allows multi-select MAP locations
    • MAP Themes now includes overprint options 
    • Document Summary panels will now provide MAPublisher “last saved with” version information
    • Scale Bar, Create Legend, and Elevation Profile preview panel can now display background colours
  • Raster ECW Support: Import and work with Enhanced Compression Wavelet files 
  • Updated Coordinate Systems: Engine enhancements including an updated coordinate system library


MAPublisher 10.8 is immediately available free of charge to all current MAPublisher users with active maintenance and as an upgrade for non-maintenance users starting at US$649. New licenses are available from US$1499. MAPublisher FME-Auto and MAPublisher LabelPro are also available as add-ons starting at US$499. Academic, floating, and volume licences are also available. Prices include one year of full maintenance. Read more about MAPublisher 10.8 in our release blog, or visit www.avenza.com/mapublisher for more details.

More about Avenza Systems Inc.

Avenza Systems Inc. is an award-winning, privately held corporation that provides cartographers and GIS professionals with powerful software tools to make better maps. Avenza also offers the mobile Avenza Maps app to sell, purchase, distribute, and use maps on iOS and Android devices. For more information, visit www.avenza.com.

For further information contact:  416-487-5116 – info@avenza.comwww.avenza.com

What’s New in MAPublisher 10.8

What’s New? MAPublisher 10.8

We are happy to announce that MAPublisher 10.8, the latest update to the MAPublisher plug-in for Adobe Illustrator, is now available. With this release, we are excited to bring forward new usability enhancements for several MAPublisher tools. We are also thrilled to confirm that MAPublisher now supports raster files in the enhanced compression wavelet (ECW) format. Alongside these enhancements, we have also implemented improvements and added expanded support to our coordinate system library.

Here is what you can expect with the latest MAPublisher 10.8 release:

Usability Improvements for MAPublisher Tools

The Avenza team is always working to improve the capabilities of our vast suite of cartography tools. We work with our users to implement improvements to our tool catalog that truly meet the needs of actual mapping professionals. In this release we are introducing several enhancements to some of our existing tools:

Multi-Column selections in the Attribute Table Editing Schema

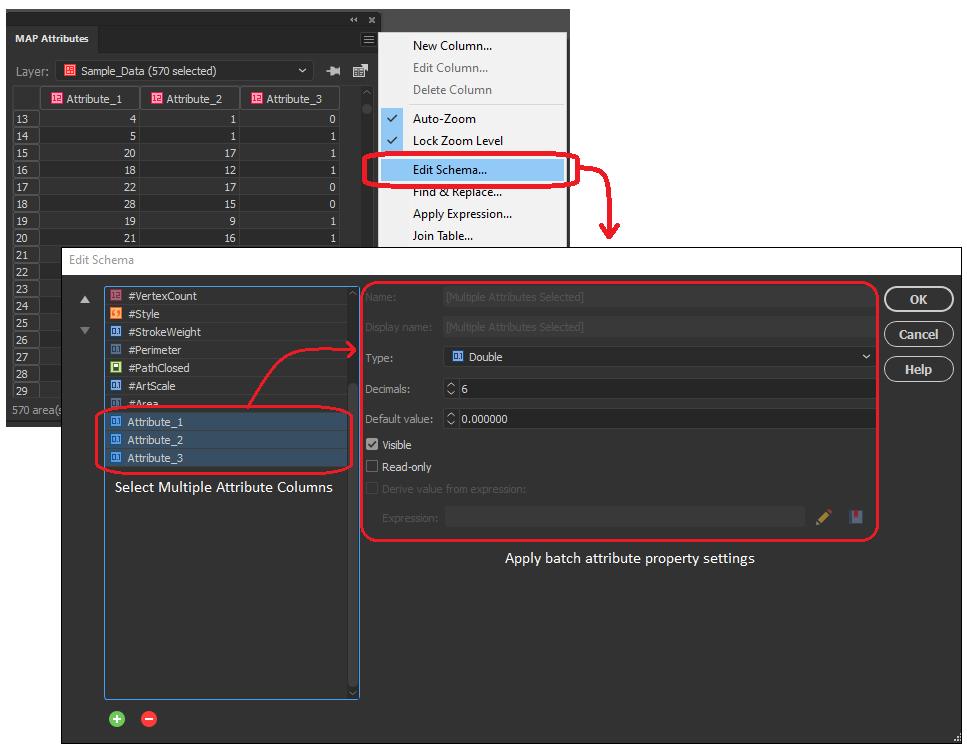
In the early versions of MAPublisher 10, we added the ability to select multiple columns within the Edit Schema window of the MAP attributes panel, allowing users to toggle visibility settings on multiple attribute columns at the same time. Now with 10.8, we are delighted to build on this by implementing the ability to configure data properties across multiple selected attribute columns. Users can not only toggle visibility or remove multiple attribute columns at once, but can now also edit default values, attribute size, and read-only settings for all selected values. Additionally, users can now change the data type (i.e string, integer, boolean, etc) for multiple selected attribute columns all at once, as long as each column shares the same starting data type. 
Select and add multiple MAP Locations in Line Plotter

We continue to bring improvements to the Line Plotter tool, this time by introducing the ability to select multiple MAP locations and add them to the line vertices (node) list. For users familiar with the Point-by-point plotting method in Line Plotter, this will be especially useful for adding a large collection of sequential MAP locations, as previously each point needed to be entered one at a time. 

Document Summary Panel now includes “Last Saved with” Version Info

For users working with MAPublisher projects across different versions of the software, you will be delighted to know that the document summary dialogue now includes information indicating the version of MAPublisher the project was last saved with. This information will help users that frequently share MAPublisher projects with colleagues, allowing them to better establish version standards across collaborative projects. 

Overprint Options in MAP Themes

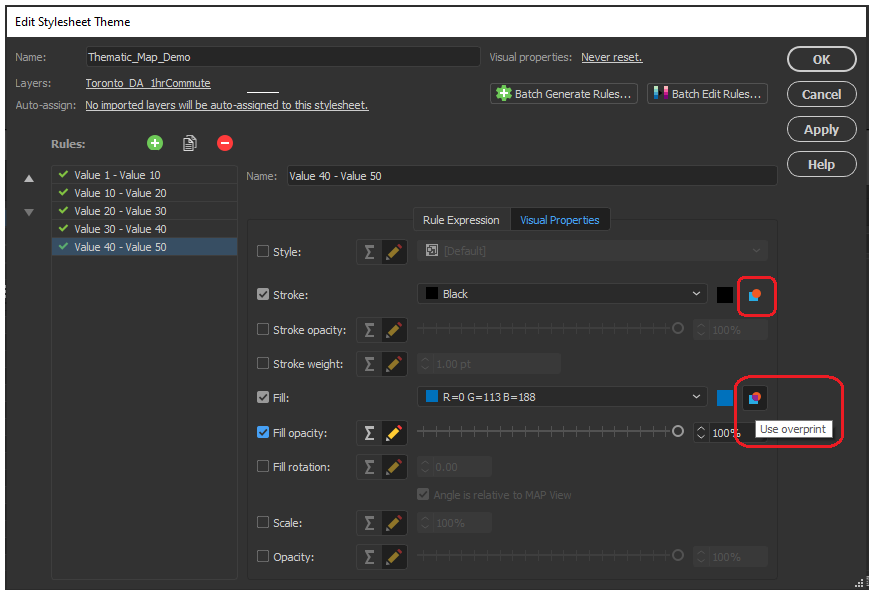
Previous versions of MAPublisher required a user to navigate the Illustrator attributes panel to configure overprint options for each map element individually and refer to these options separately using MAP Themes. Now with MAPublisher 10.8, an overprint option has been implemented directly within the MAP Themes panel, allowing users to configure overprint settings for fills and strokes within each stylesheet in the MAP Themes tool.
Scale bar, Create Legend, and Elevation Profile tool previews with Background Colours

We have added a small improvement to the scale bar, create legend, and elevation profile tool panel. The preview window for these tools, which allows users to adjust and edit their visual properties before adding them to the map, now has the option to configure a preview background colour. This option is helpful when configuring light, or white-coloured map elements which were previously difficult to see against the default white preview background. 

Support for Raster ECW file formats

New to MAPublisher 10.8, we now include Enhanced Compression Wavelet raster files to our growing lists of supported data formats. Users can now import and work with ECW files directly within the MAPublisher environment of Adobe Illustrator, all while retaining necessary spatial integrity, and without needing to convert your data. 

Engine Improvements and Updated Coordinate system catalogue

We are working continuously to improve the back-end MAPublisher engine to ensure our users can continue their work in an optimized, seamless,  design-focused cartographic environment. Along with improvements to our engine and bug fixes, we have built on our current coordinate system catalogue with updates to the coordinate system and projection library. This means our list of supported projections has grown, with new additions including the Natural Earth and Natural Earth 2 Projections created by Tom Patterson. For a full list of our expanded coordinate systems library please check the projections guide in the Avenza Support center.

MAPublisher 10.8 is immediately available today, free of charge to all current MAPublisher users with active maintenance subscriptions and as an upgrade for non-maintenance users. 

Find out more at the Avenza User Conference!

Want to learn more about MAPublisher? Want to see how industry professionals are using Avenza Products in their organizations? Join us on May 12th, 11am – 5pm (EST) for the first-ever Avenza User Conference. Registration is Free!

The event will feature a full day of speaker presentations from the Mapping and Geospatial communities. The Avenza Product teams will also be on hand to answer questions and give you a sneak peek of upcoming developments to the Avenza Platform. Sign up for free at avenza.com/user-conference

Avenza User Conference 2021


Handling GeoJSON Files with Unspecified Projected Coordinate Systems

In the latest GeoJSON specification (2016), the coordinate reference system for all coordinates is a geographic coordinate reference system—using the World Geodetic System 1984 (WGS 84) datum—with longitude and latitude units of decimal degrees. The previous specification (2008) allowed for the use of alternative coordinates systems, but this was removed because of interoperability issues.

MAPublisher still recognizes GeoJSON files with a specified coordinate system even though it is no longer officially supported. However, if no coordinate system is specified, MAPublisher will assume the coordinates are in WGS 84. Occasionally, this may cause a problem of improperly formatted files that contain projected coordinates but have no specified coordinate system. In this case, users will need to either choose a coordinate system during import or modify the GeoJSON file by adding a coordinate reference system (CRS) object manually.

Selecting a Coordinate System on Import

To change the coordinate system using the Import dialog box, click Advanced and select the WGS 84 link under Coordinate System. Ignore the warning about changing the coordinate system by clicking “Replace coordinate system”. Select the correct projected coordinate system from the list.


Modifying the GeoJSON File Manually

Coordinate reference systems can be specified in a GeoJSON file using a CRS object. You can view the contents of any GeoJSON file by opening it in a text editor such as Notepad. Copy and paste the text below after the line: “type”: “FeatureCollection”, (usually on line 2). Change the EPSG number to the correct CRS for your dataset. See Spatialreference.org to lookup an EPSG code.

"crs":
{
   "type" : "name",
   "properties" :
   {
      "name" : "EPSG:[EPSG Code]"
   }
},

Example:

The GeoJSON file can now be read properly by MAPublisher and can be imported as normal.

The Difference Between Constraints and Bounds in a Graticule

A graticule is the network of lines of latitude and longitude drawn at regular intervals on a map. Graticules are created in MAPublisher using the Grids and Graticules tool. In some maps, you may want to limit the area on the map that a graticule covers. For example, you may want it to cover only the map’s area of interest. The image below is a map of North America with a graticule drawn at 5-degree intervals. US State boundaries are drawn in white. In this post, we’ll modify the graticule three times so it conforms to the edges of the image, so it covers only the Continental United States, and lastly a combination of the previous two modifications.

North America with a graticule of 5 degree intervals.

MAPublisher can limit the geographic extents of a graticule in two ways: using Grid Bounds and using Grid Constraints. In both cases, you’ll specify the lower left and upper right corners of the graticule. Specifying Grid Bounds will limit the extent of the graticule to a rectangular area while specifying Grid Constraints will limit the graticule along lines of latitude and longitude. If both Grid Bounds and Grid Constraints are specified, the graticule will cover an intersection of the two areas. The image below shows bounds and the constraints and the intersecting area which forms the graticule.

Bounds and the constraints and the intersecting area which forms the graticule.

To modify a graticule so that it conforms to the edges of the image, you’ll need to specify grid constraints. In the Grids and Graticules dialog box, click the Specify Grid Constraints check box and set the Lower Left and Upper Right corners to the corners of the image which are -127°, 7° and -50°, 65° respectively.

Specifying Grid Constraints.

To create a rectangular graticule covering only the lower 48 states, click the Specify Grid Bounds check box and set the Lower Left and Upper Right corners to the corners of that area. Tip: click the MAP World Locations drop-down arrow to choose the values for the lower left and upper right corners.

Specifying Grid Bounds.

When both Specify Grid Bounds and Specify Grid Constraints check boxes are both checked, the graticule will cover an intersection of each of the extents. For instance, in the map below, the northern extent follows the 49th parallel at the Canadian border, the western extent is at the edge of the image (127° west) and the south and east extents are the same as in the previous map.

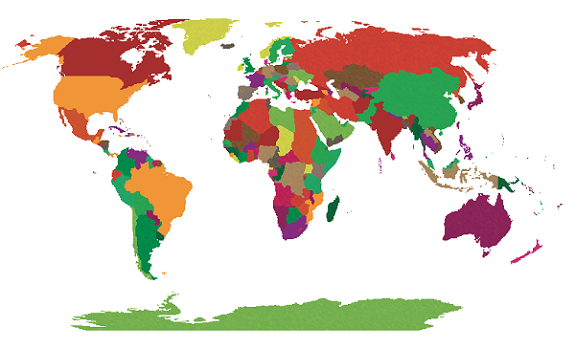
Both Specify Grid Bounds and Specify Grid Constraints selected.


Defining the Projection or Projecting the Data?

Have you ever imported data that doesn’t quite line up how you’d expect? It may be that you’ve fallen victim to a common workflow error when importing GIS data. Some file types such as CSV can be used for GIS data but don’t contain coordinate system information. When you are importing data from this format, you first have to define the correct coordinate system.

In this example, we’re going to look at the common mistakes people make and how to avoid them. We’ll start with a world map in the Robinson projection.

Robinson mapWe have a CSV file containing points for large cities that we’d like to add to the map. We know from our data source that the CSV uses the WGS84 coordinate system. After selecting the file for import, the MAPublisher Import dialog box helpfully notifies us that some required settings are missing. We’ll click the blue ‘Required settings are missing’ link to continue.

required settingsSetting up the import, the coordinate column settings are easy since we have an X_COLUMN and a Y_COLUMN, but we can’t forget to check that the format is correct. The default is Projected units, but we know the file uses WGS84, and can tell by the numbers in the column that the coordinates are in decimal degrees, so we’ll change the format to reflect this information and click OK.
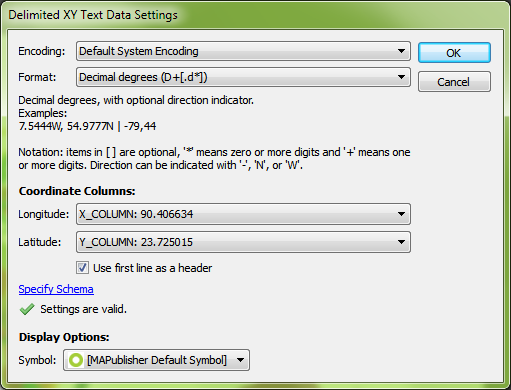
csv correct settingsBack at the import window, we see the message ‘Data loaded successfully’. Great! Let’s click OK and add the large cities to the map.

csv settings are okThe data has been imported but the result isn’t what we expected. The new layer has been added to a new MAP View, so let’s try dragging it into the Robinson MAP View with the world map.
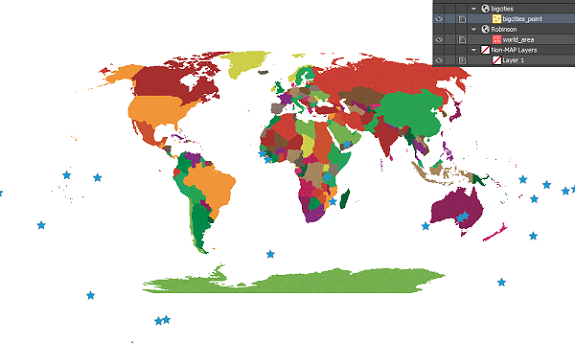
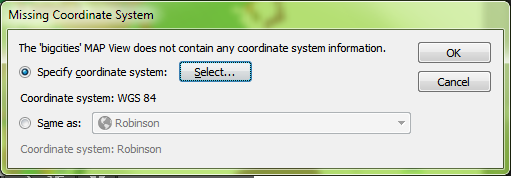
import incorrectWe get a prompt saying that there isn’t any coordinate system information. We want it to be in Robinson like the rest of the map so we’re going to leave the default setting of Same as: Robinson.
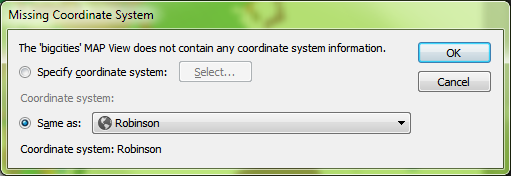
coordinate system undefinedThe data has moved, but it still doesn’t look like we were expecting. Where did we go wrong here?
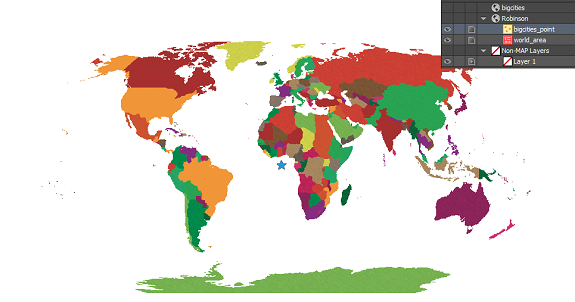
transformation incorrectThere are actually two places in the workflow where we could have avoided this common mistake. When we dragged the point layer into the Robinson MAP View, the pop-up dialog box prompted that a coordinate system wasn’t specified. We specified Same as: Robinson, thinking this was the correct choice, but we had already determined during import that the CSV was in WGS84. What we should have done here was to specify the coordinate system as WGS84.
missing coordinates correctThe other place where we could have avoided this error was right after setting up the CSV file for import. In MAPublisher 9.4, there’s a new button on the Import dialog box that allows you to see more detailed information about files being imported. By clicking the Advanced button in the Import dialog box, we would have noticed that there was no coordinate system specified.
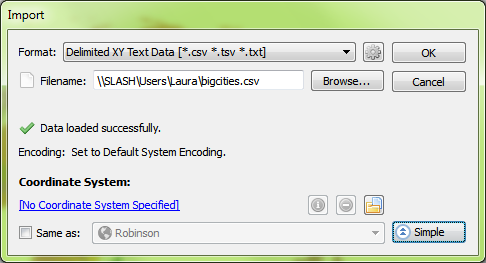
advanced import windowEven here, it might have been tempting to choose Same as: Robinson to add it to the Robinson MAP View, but this would import the points exactly the same as before – all in one location in the middle of the map. Instead, what we want to do is click the blue ‘No Coordinate System Specified’ link and choose WGS84. After this is set up, we’ll click OK to add the data to the map.
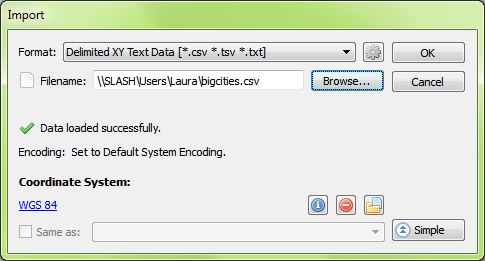
correct import settingsThe data still isn’t quite right – it looks the same as when we first imported it. But again we notice that it has been imported into a new MAP View, so we’re going to drag the layer into the Robinson MAP View and see what happens.
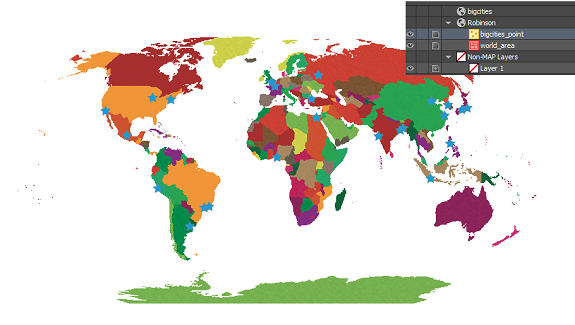
import incorrectPerfect! By assigning the correct coordinate system to the data during import, the points have been imported correctly!

correct map with pointsMistakes during data import are common amongst GIS users, especially those who are just starting out. In the first scenario, when we imported the CSV and added the data directly to the Robinson MAP View, we thought we were telling MAPublisher that we’d like it to match up with the map. What we really did was tell MAPublisher that the data was already in the Robinson projection, even though we knew it was in WGS84. What we should have done first was to define the projection by telling MAPublisher what coordinate system the data is already using. Once MAPublisher knows what system the data is starting in, we can then ask it to project or transform the data into the coordinate system that we’d like to use.
When working with data that doesn’t have coordinate systems already defined, it is very important to follow the workflow in the correct order to avoid frustration when the data doesn’t line up as expected. Always check your sources when using data that isn’t defined, and make sure you’re assigning the correct coordinate system before performing any transformations or projections.

Creating Grids in MAPublisher with an Alternative Coordinate System

In a previous blog about Grids and Graticules, we quickly introduced one of the major features of the new Grid and Graticule tool. We’d like to share another major feature when creating grids: creating grids with an alternative coordinate system.

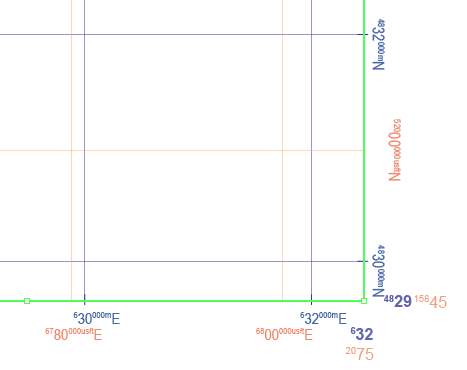
For example, the MAP View has a coordinate system “NAD 83 / UTM zone 17N” (in metres). You might want to make grid lines with the same coordinate system but in different units. You can do so by creating a custom coordinate system and then specifying the desired unit (US Foot, for this example), then creating a grid based on custom coordinate system. In this example, a grid with NAD83/UTM zone 17N (metres) coordinate system is created in the blue colour. Another grid with a NAD83/UTM zone 17N (USFoot) custom coordinate system is created with the orange colour.

Specifying alternative coordinate system for grids

Example of grid lines with UTM in metres and US foot

Likewise, you can create multiple sets of measured grids with different coordinate systems in one MAP View (e.g. one set with NAD83 UTM, another with NAD27 UTM, another with some other local coordinate system) without the need to transform the MAP View.

MAPublisher: Enhanced Grids and Graticules Allows You to Share Grid Settings

If you haven’t noticed yet, we released an enhanced version of the Grid and Graticules tool (MAPublisher 8.7 and higher). With the new Grid and Graticules tool, you will find that you can export grid settings and save them. Most importantly, these grid settings files can be shared and imported to another document.

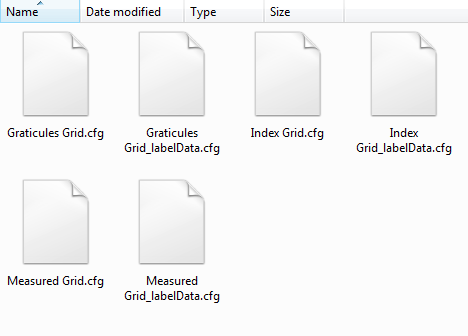
Once a grid is created, save the settings to a *.cfg file. Two configuration files are created per grid: grid settings and label settings.

settings files for grid and graticules

Grid settings configuration files store information for all related grid options (e.g. ticks, intervals, offsets, borders). Label settings configuration files store information for all related label options (e.g. axis labels, fonts, styles), even for multiple grids. Label settings are saved with _labelData suffixed to the file name.

Share the files and load the *.cfg file in the Grid and Graticules dialog box.

exchanging the settings for grid and graticules

Some of the major functions of the new Grid and Graticules tool are adding tick marks along border lines, placing cross hair symbol instead of lines for grid/graticule lines, styling lines and text more flexibly, and having more label options available. You can share the settings by exporting one and importing to another document as well. You can make a set of grid lines looking like this below.


A basic example of grid lines

Georeference Any Map in MAPublisher 8.7 with the New Georeferencer Tool

The new MAPublisher 8.7 Georeferencer is a fast, easy, and accurate way to update your current unreferenced map collection or data to prepare it for PDF Maps or other digital formats.

The first step is to open your unreferenced document in Adobe Illustrator. If the document is a vector PDF it is often advantageous to rasterize the document and save it as a TIFF to avoid any conflicts with text.

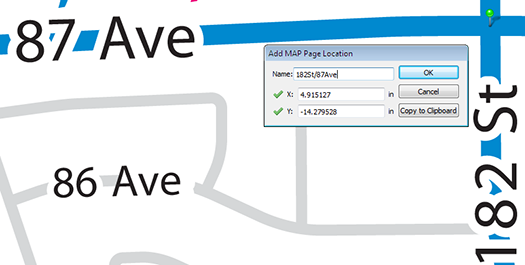
Once the map is open, we can use the Map Locations tool to place reference points or Page Locations on our unreferenced map. It is recommended that known points, or points that are unlikely to move such as the intersections of road ways, are used as reference because these locations will be easily recognizable (as seen in the following steps). Tip: You will also want to zoom in as close as possible to the point to ensure the best possible accuracy.

Place MAP Locations

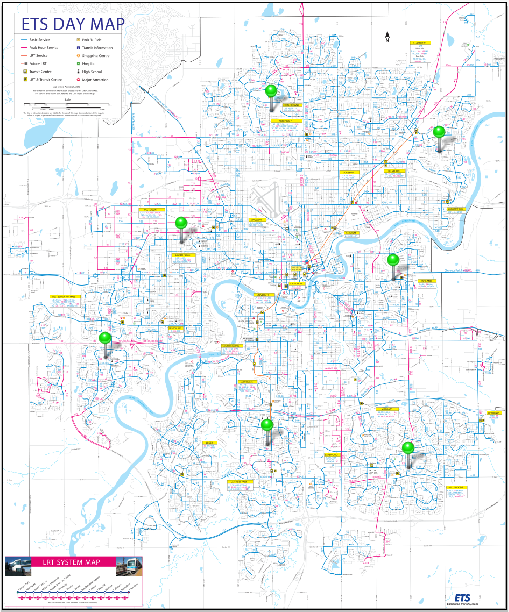
After we have given a name to our page location we will continue to place page locations until there is four or more spread as evenly across the map as possible. Having greater than four reference locations could help to improve the overall georeferencing accuracy.

Place MAP Locations

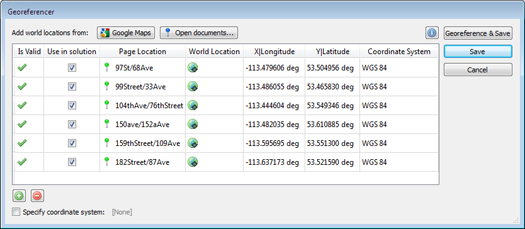
The next step is to find the real world counterparts, or World Locations, for each of our Page Locations using the Georeferencer tool. World locations can be sourced from an online map service, an open referenced document or entered manually. In this example we will use the built in Google Maps service to find our World Locations.

Place MAP Locations

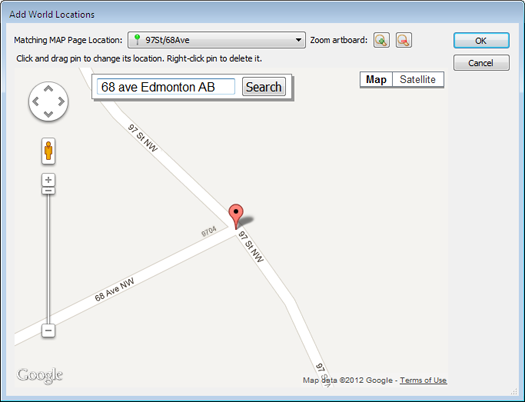
The Google Maps option opens the Add World Locations dialog box. Choose a Page Location from the drop-down list and use the map to find the corresponding world location. Use the Google search bar and zoom buttons to zoom as close as possible to the corresponding world location. Place the cross hairs over the location, click, and confirm the world location with the page location.

Place MAP Locations

If the point is accurate, we will continue to add world locations for each page location. If not, the world location position can be changed by clicking and dragging it to a more accurate location. Right-click the pin to delete it.

If you’re unsure about the position of the original page location, you can drag the Add World Locations dialog box to the side and use the Zoom to artboard tool to help locate it.

After we have placed all of the World Locations with the corresponding Page Locations, we may now either specify a coordinate system (if one is already known) or click on Georeference and Save.

Place MAP Locations

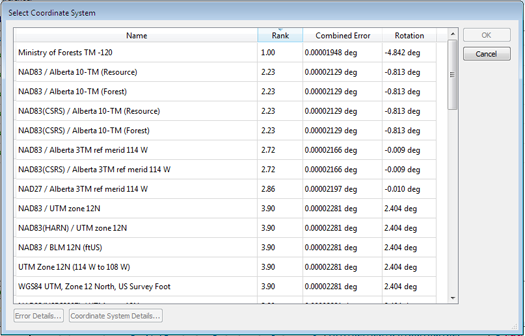
After clicking Georeference and Save, a list of possible projections will be presented. Select the projection which most accurately represents your map. With each projection we see an associated error. This error is based on the combined accuracy of our Page and Map locations.

Place MAP Locations

As in this example, the first ranked projection is not always the best fit for our map, so it is best to use your best judgment when selecting a projection.

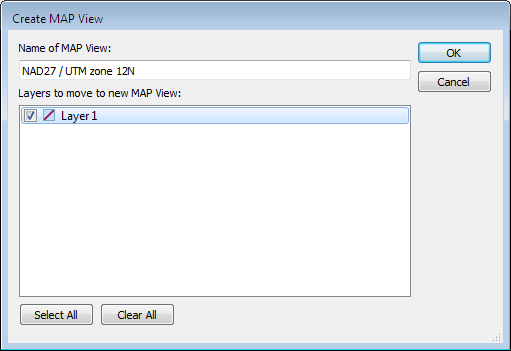
Click OK and add your map to a Map View and save. Your map is now referenced!

Place MAP Locations

We can check the accuracy of our georeferencing by zooming in closely to our Page (green) and Map (blue) locations. The further the distance between the two points, the less accurate a given georeferenced map is.

Place MAP Locations

You can also see a video of the Georeferencer in action on our YouTube Channel.

Geospatial PDF in Adobe Acrobat: Examining latitude and longitude values

After creating a map with MAPublisher or Geographic Imager, you might want to export it as a geospatial PDF file. You want to ensure that the georeference information of your Geospatial PDF files are correct before bringing them into the field for use. A great way to use geospatial PDF maps (and GeoTIFFs) is to load them onto an iPhone, iPad, or iPod touch with PDF Maps installed.

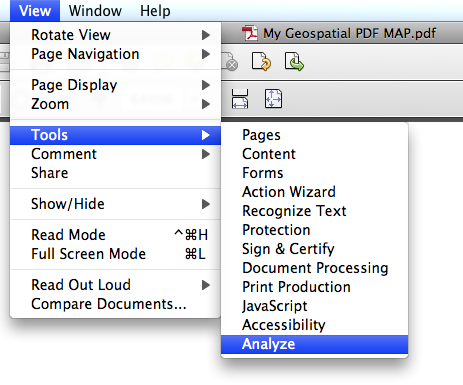
One way to check for georeference accuracy of geospatial PDF files is to use Adobe Acrobat. Open the “Analysis” tool from View > Tools > Analyze.

Adobe Acrobat: Opening Anlysis Tool

Click the “Geospatial Location Tool” from the Analyze panel.

With the Geospatial Location Tool enabled, you can see the latitude and longitude values of the map while you move the mouse over the opened Geospatial PDF file.

Geospatial PDF viewed in Adobe Acrobat

An important tip you should keep in mind: you need to set the preference option for this tool correctly depending on the coordinate system of the map in the geospatial PDF file.

Open the Preference dialog window:

Acrobat X on Windows: Edit > Preferences > General …
Acrobat X on Mac: Acrobat > Preferences …

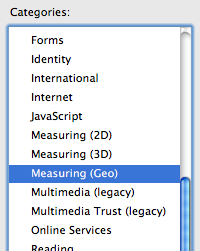
In the Preference dialog window, find the preference category “Measuring (Geo)” from the list of categories.

Adobe Acrobat Preference dialog window

In the “Measuring (Geo)” category, take a look at the right side. There are many options for the georeferencing tool. One of the options is “Latitude and Longitude Format”. In this section, you have a checkbox option “Always display latitude and longitude as WGS 1984”.

Adobe Acrobat Preference option for Latitude Longitude Display

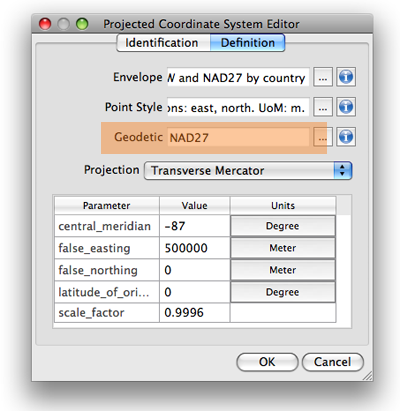
This option is very important. If the coordinate system of the map is “NAD 27 / UTM Zone 16 N”, which geodetic system would you like to have to show the latitude and longitude values in Adobe Acrobat? For example, if you are checking the latitude and longitude values in the WGS 1984 geodetic system, you should keep this option selected. However, if you are checking the latitude and longitude values in NAD 1927 geodetic system, then you should de-select this option. The difference in the distance at the same spot between two different geodetic systems may be small or large. If you would like to see the correct latitude and longitude values, you should be aware of this option.

Aligning data with different coordinate systems in MAPublisher

When first creating a map, very often you will find yourself having to align GIS data, especially if it is found or supplied by various sources. You might find that the coordinate systems assigned to each of the datasets might be different. This can prove challenging for many cartographers and GIS users. However, with MAPublisher, you can transform and align your datasets to one coordinate system very easily using the MAP Views panel.

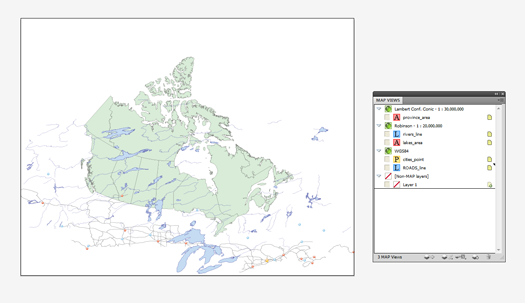
Imported maps have different coordinate systems

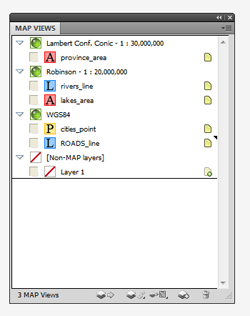
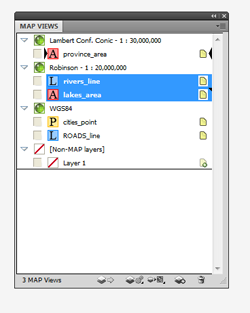
For example, we have five layers with three different coordinate systems. After importing them into MAPublisher, the result is three different MAP Views. The MAP Area layer (Province) is in a Lambert conformal conic projection. The MAP Line Layer (river) and MAP Area layer (lake) are in a Robinson projection. Lastly, the MAP Point layer (cities) and MAP Line layer (roads) are in a geodetic coordinate system WGS84.

5 MAP Layers with 3 different MAPViews

Let’s decide that the map we are creating here will have a Lambert conformal conic projection (the MAP View with the province area layer). Now, simply select the two layers in the Robinson MAP View, then drag them to the “Lambert Conf. Conic – 1: 30,000,000” MAP View.

MAPublisher trick: Drag and Drop Transformation

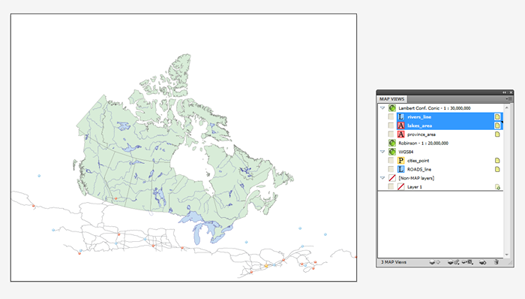
The rivers and lakes layers are now transformed and aligned to the province boundary layer.

Two map layers are transformed and aligned properly.

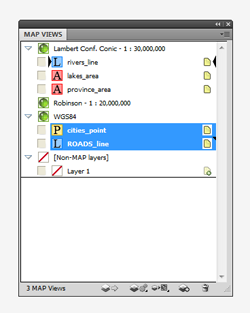
We will do the same for the cities and roads layers in the “WGS84” MAP View. Select the two map layers (cities and roads layers) then drag them to the “Lambert Conf. Conic – 1: 30,000,000” MAP View.

MAPublisher trick: Drag and Drop transformation for two map layers

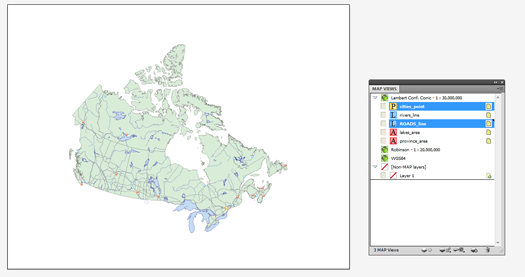
The cities and roads layers are projected on-the-fly. Now every layer is transformed to a Lambert conformal conic projection and aligned appropriately.

Every map layer is transformed and aligned properly


Related topics

News Archive