My Account     Contact Us     Cart

What’s New in MAPublisher 11.0 for Adobe Illustrator?

What's New in MAPublisher 11

We are very excited to announce the release of MAPublisher 11, the latest version of our MAPublisher extension for Adobe Illustrator. 

With MAPublisher 11, we are bringing forward full compatibility with the Apple Silicon processor, enhancements to the MAP Attributes panel, a revamped welcome screen, the ability to import OpenStreetMap file formats, a brand new set of MAP Erase tools, and several performance and bug fixes.

Here’s what you can expect with the latest MAPublisher 11 release:

Compatibility with the Apple Silicon Processor

We want to ensure our users enjoy a truly seamless experience whether they are using a PC or Mac computer. Our team has worked to ensure that MAPublisher 11 is fully compatible with the Apple Silicon chip, and as such we can declare that MAPublisher is officially supporting this processor.

MAP Attributes Panel Enhancements

An exciting feature for MAPublisher 11 is a number of enhancements made to the MAP Attributes panel. Users are no longer required to select all objects on a layer for them to appear in the MAP Attribute panel. Instead, all features appear by default, and users can toggle between showing all features or just their selected features at the bottom left corner of the panel. When all features are shown, selected features will appear highlighted in the attribute table.

Welcome Screen Revamp

MAPublisher 11 comes with a brand new welcome screen that appears upon opening the program. This window is equipped with visually appealing refreshed graphics, while maintaining access to the License Management window. It also features several new sections that increase discoverability for you, such as new features, help and tutorials, and other Avenza news or events. There is also a Get Inspired section to help inspire you as a mapmaker, which features articles from our website which highlight the excellent maps and stories of some of our most proficient users.

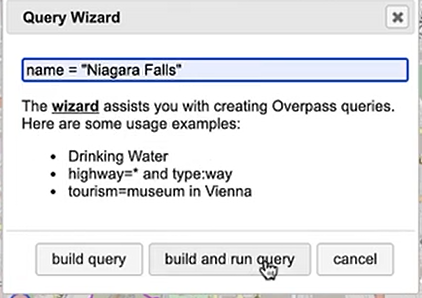
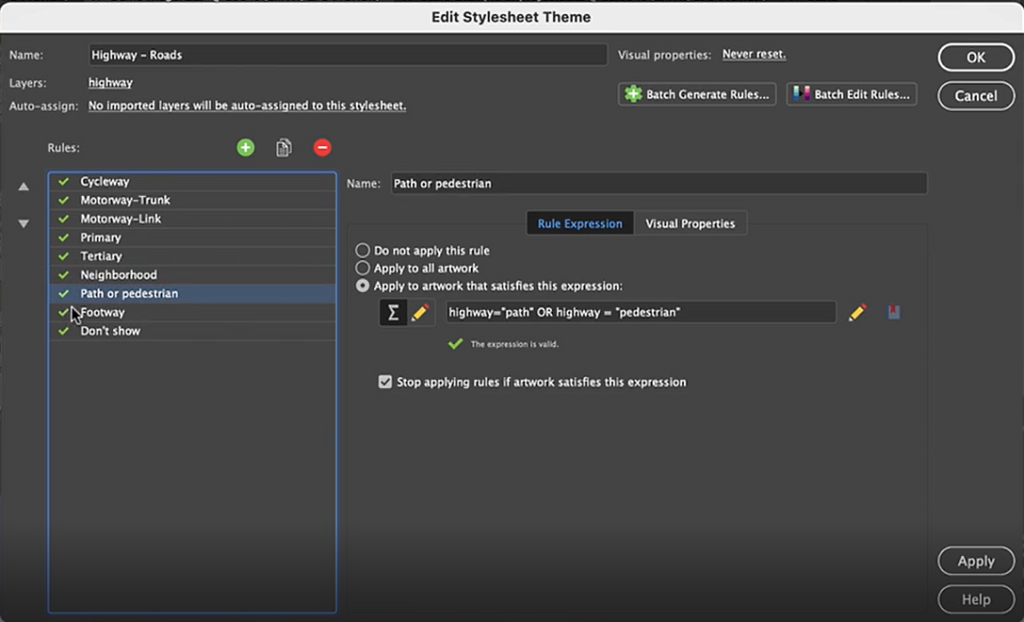
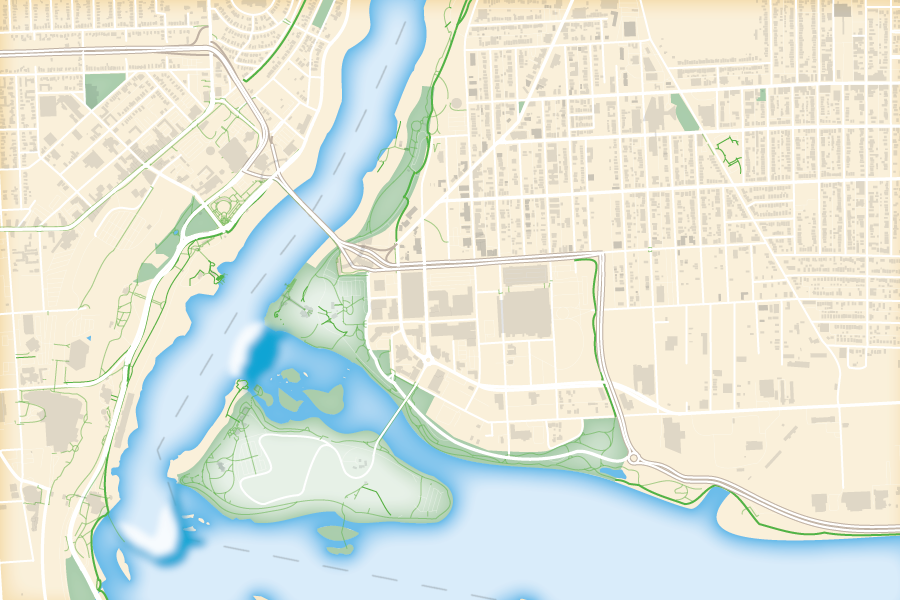
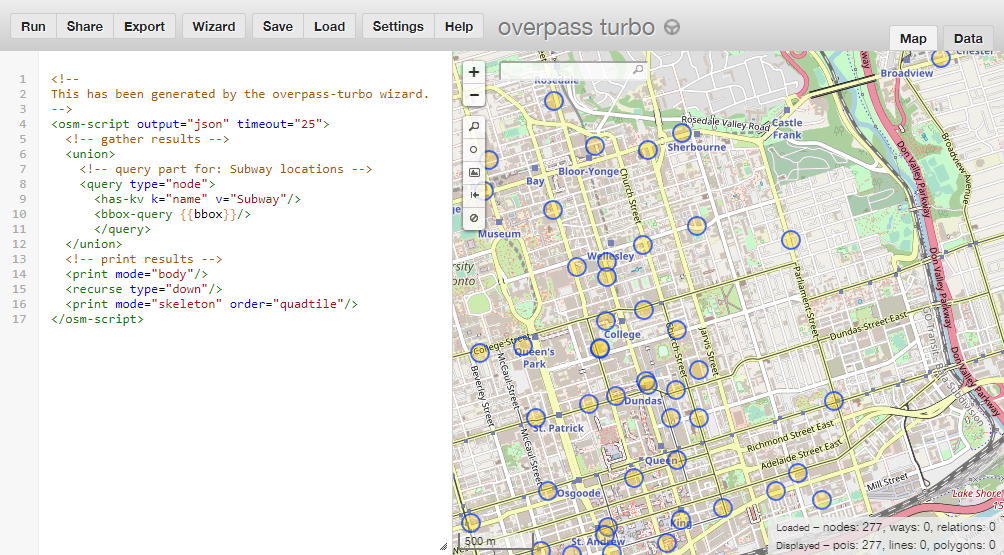
Importing OpenStreetMap File Formats

We are thrilled to announce that importing OpenStreetMap (OSM) file formats is now a possibility with MAPublisher 11! Whether you are importing a single file, or using the Multiple Data Import tool you can now select OSM and PBF file formats from the list of supported formats. The rest of the import process remains unchanged from the other file formats users are familiar working with in MAPublisher.

MAP Erase Tools

Many of our users have requested the ability to quickly erase unwanted or sensitive data from their maps. Thus, we are happy to introduce the new MAP Vector Erase and MAP Erase by Shape tools that come along with MAPublisher 11!

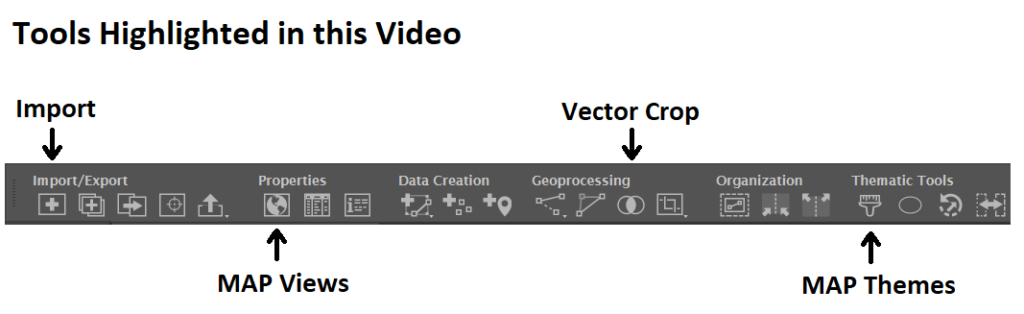
MAP Vector Erase Tool

With the new release of MAPublisher 11 comes a new tool known as the MAP Vector Erase tool. Functioning as an inverse version of the MAP Vector Crop tool, the Erase tool removes all data within a specified rectangle or ellipse shape.

MAP Erase by Shape Tool

The new MAP Erase by Shape tool functions similarly to the MAP Vector Erase tool, but it allows users to easily erase portions of MAP Layers using shapes other than rectangles and ellipses. Users can simply select the shape object they wish to use as the erase boundaries, and then select the MAP Erase by Shape tool from the MAP Toolbar. 

Both tools share the same customizable settings and advanced options. Like the MAP Crop tools, the MAP Erase tools can be applied to all layers within the document, all layers within a single MAP View, or just a single layer.

If you would like to learn more about the new MAPublisher 11 features or have any questions, please check out our Support Centre.

MAPublisher 11 is immediately available today, free of charge to all current MAPublisher users with active maintenance subscriptions and as an upgrade for non-maintenance users. 

Avenza Releases MAPublisher 11.0 for Adobe Illustrator

Toronto, ON, August 31, 2022 – Avenza Systems Inc., producers of the Avenza Maps® app for mobile devices and geospatial extensions for Adobe Creative Cloud®, including Geographic Imager® for Adobe Photoshop®, is pleased to announce the release of MAPublisher® 11.0 for Adobe Illustrator®. This version offers full compatibility with the Apple Silicon processor, enhancements to the MAP Attributes panel, a revamped welcome screen, the ability to import OpenStreetMap file formats, a brand new set of MAP Erase tools, and several performance improvements and bug fixes.

MAPublisher cartography software seamlessly integrates more than seventy GIS mapping tools into Adobe Illustrator to help you create beautiful maps from geospatial data. Import industry-standard GIS data formats and make crisp, clean maps with all attributes and georeferencing intact using the Adobe Illustrator design environment.

New major features of the MAPublisher 11.0 extension for Adobe Illustrator include:

  • Apple Silicon Processor compatibility
  • MAP Attributes Panel enhancements: Users no longer need to select all attributes for them to appear by default in the features list, with show all/show only selected features toggle buttons
  • Welcome Screen revamp: Improved discoverability for users with more content to aid in getting started or inspired with MAPublisher 
  • OpenStreetMap file format support: Import OpenStreetMap OSM and PBF file formats
  • MAP Erase tools: Quickly remove sensitive or unwanted data from maps with the MAP Vector Erase or MAP Erase by Shape tools

Users require a valid Adobe Creative Cloud subscription and a compatible operating system to utilize the improvements and enhancements offered in MAPublisher 11.0. For questions and information on how compatibility requirements may affect your organization, please contact our Support Centre.

MAPublisher 11.0 is immediately available free of charge to all current MAPublisher users with active maintenance and as an upgrade for non-maintenance users starting at US$649. New licenses are available from US$1499. MAPublisher FME-Auto and MAPublisher LabelPro are also available as add-ons starting at US$499. Academic, floating, and volume licenses are also available. Prices include one year of full maintenance. Read more about MAPublisher 11.0 in the release blog, or visit www.avenza.com/mapublisher for more details.

More about Avenza Systems Inc.

Avenza Systems Inc. is an award-winning, privately held corporation that provides cartographers and GIS professionals with powerful software tools to make better maps. Avenza also offers the mobile Avenza Maps app to sell, purchase, distribute, and use maps on iOS and Android devices.
For further information contact: 416-487-5116 – info@avenza.comwww.avenza.com

Map-making for the #30DayMapChallenge: Day 4 – Hexagons

Yesterday was Day 4 of the #30DayMapChallenge, with the goal being to create a map using “Hexagons”. In the spirit of the challenge, we took a not-so-serious approach to create a fun map of “Sharknado Risk” based on the 2013 film “Sharknado” using MAPublisher tools and a really neat hexbin dataset for the United States. This map was in part created for NACIS 2021, and you can see how we created the map by watching the full video presentation included below. This blog also includes a few supplementary notes if you wish to follow along.

What exactly is a Sharknado?

A sharknado is a fictional meteorological phenomenon that occurs when a large tornado scoops up some sharks, transports them some distance, and finally disperses across a populated area. Generally speaking, if a given area is close to potential shark habitats (be it an aquarium, a zoo, or even the ocean) and has a high frequency of tornadoes, the area is more “at-risk” of experiencing a sharknado. To that end, we gathered some great open datasets to help us map this risk. We collected a shapefile documenting point locations for every single tornado in the country dating back to 1950. With this dataset, we can determine the relative frequency of tornadoes for a given area. From OpenStreetMap, we estimated potential locations for sharks by collecting point coordinates for every aquarium, marine park, aquatic zoo, and ocean-facing beach. We used Overpass Turbo to query and extract these points to a spatial dataset and imported them into Illustrator using MAPublisher. Check out this great tutorial (produced by Steve Spindler!) that covers techniques for importing Overpass Turbo data into MAPublisher. The tutorial was part of our ongoing Mapping Class series, a video-focused series that provides helpful tips, techniques, and workflows from real-world cartographers.

Aggregate data with Spatial Join

Since the challenge of the day is hexagons, we needed a way to get our messy point data into our clean “hexbin” format. The Spatial Join tool allows us to aggregate our point data (Tornado and Shark Locations) into a single hex-grid polygon dataset.

Credits to Daniel Huffman’s projectlinework.org for making this dataset available!

The Spatial Join tool includes several different options for “spatial relationships” that will determine how our point data is joined to the new hex-grid. We can also specify how the tool will aggregate the attribute information for our joined data. In this case, we join our Tornado point data based on a “contains”  spatial relationship. This will aggregate all tornado points that are “contained” within a given hexbin. We also specify that the tool should aggregate the attribute information for all “contained” tornados by tallying up the number of tornado points within each hex. Since we know the dataset spans a 69-yr period, we can easily calculate the average annual tornado frequency for each hexagon.

We apply a similar technique to our shark location data, this time specifying a “near” spatial relationship. We used some back-of-the-envelope math to estimate that a Sharknado (as it appears in the film) lasts substantially longer and travels farther than a normal tornado, meaning sharks as far away as 150 miles still present a potential risk. We can specify a search range of 150 miles and this will be applied to our spatial relationship as a cut-off distance. 


Edit attributes with expressions

We assumed that Sharknado risk is highest when a given area is prone to tornadoes and also has a high concentration of potential shark locations. Given this, we came up with a basic equally-weighted, bi-variate risk index to assign a “Sharknado Risk” score based on these two variables. To calculate this score for each hexagon in our hexbin grid, we applied some custom expressions using MAP Attributes. First, we assigned a Tornado risk score from 1 to 6 based on the low to high frequency of tornadoes. We assigned a similar score for “Shark proximity” based on the concentration of potential shark locations. Finally, we combined these values into 36 unique scores to evaluate sharknado risk.

Stylize maps easily with MAP Themes

The final step is to stylize our map and create a layout. With MAP Themes, we can create rules-based stylesheets to easily stylize our map data in no time. MAPublisher comes with a great selection of built-in MAP Swatches, including several color brewer-based swatches that work great for choropleth-style maps like this. We used these swatches to create a custom, bi-variate swatch group to visualize each score of our “Sharknado Risk Index”. The MAP Themes tool also provided a neat data distribution viewer, which also allows us to inspect a histogram of our dataset. Although we used discrete categories for each of our risk scores, the data distribution viewer is very useful when working with continuous datasets since it allows you to see how your bin-widths will affect the display of colour on your choropleth.

The final touches

With stylization complete, Day 4 of the #30DayMapChallenge is almost in the bag. We can create a north arrow, and a scale bar and create a custom legend to facilitate easy interpretation. Since we are still within an Illustrator environment, we can use all the powerful native illustrator tools to add graphical design elements, text, and artwork to create a fun, infographic-style map. Although we were happy to call the map finished at this point, the great thing about making maps is there is also room to add more. For example, we might try using LabelPro to create custom labels that mark high and low-risk areas, or we could create insets to highlight specific regions of interest. The possibilities are endless!

We had a great time putting together this fun map for the #30DayMapChallenge, and we are excited to see what we can do for the remaining themes on the calendar! For those of you who are also making maps for the challenge, a reminder that the Avenza Map Competition is still accepting submissions. Share your map, compete with other map-makers in the community, and win some great prizes!

See a PDF version of the map here.

Mapping Class: Importing OpenStreetMap data using Overpass Turbo with Steve Spindler

We are back with another exciting addition to our Mapping Class tutorial series. The Mapping Class tutorial series curates demonstrations and workflows created by cartographers and Avenza software users. For this article, we are welcoming back Steve Spindler, a longtime MAPublisher user, and expert cartographer. He has shared with us an excellent tutorial on creating a map from scratch using openly available geographic data from OpenStreetMap, and accessed through Overpass turbo. Steve shows how you can create query statements to filter and export the data, and demonstrates how you can import the data into MAPublisher before using a selection of cartographic styling tools to create a visually appealing map.

Steve has produced a short video walkthrough detailing his map-making process. The Avenza team has produced video notes (below) to help you follow along.

***

Importing OpenStreetMap data using Overpass Turbo
by Steve Spindler (video notes by the Avenza team)

Finding and accessing good quality data is often the first challenge for any cartography project. OpenStreetMap (OSM) can be an excellent source of open vector data describing land cover features (roads, parks, rivers, buildings, trails, infrastructure, boundaries). Once collected, cartographers can use OSM data to create highly detailed maps using the MAPublisher plug-in for Adobe Illustrator. Steve will demonstrate his process of collecting raw data from OSM and using it to craft a beautiful map of the Niagara Falls Area. The following video notes summarize Steve’s approach. 

First, you will need to extract some data from the OSM database. Since OSM is a massive repository of geographic data, you’ll need a way to filter through and extract only the data needed for your specific map project. Overpass turbo is a web-based data mining tool that can make querying and exporting OpenStreetMap datasets easy. The tool allows users to apply query statements that filter the OSM database based on attribute and location information. Using the Overpass turbo “Wizard”, a user can enter simple queries (i.e. “water”) and automatically filter and select all features that match the query statement, making it easy to export specific data for your map.

Steve uses a simple query to obtain all map features that are considered “water”. This includes both natural and man-made features

The tool allows the user to export the filtered datasets into geoJSON format, an open standard format for storing and representing geographic data and attributes.

The geoJSON datasets collected from Overpass turbo can then be imported directly into MAPublisher for styling into a finished map. Use the Import tool to load the data onto an Adobe Illustrator artboard. From here, you can open the MAP View editor to adjust the scale and projection information for each map data layer. For this map, reproject the data into State Plane NAD 83 to preserve an accurate spatial scale. Set the scale option to 25,000 and customize the position of the map data on the artboard.

If needed, use the Vector Crop tool to trim the map data down to a specific area of interest, and simplify the layer to create smoother lines by removing excess vertices.

Back in Overpass turbo, you can build more specific query statements to extract individual features from larger data categories. Use the statement: name = “Niagara Falls”, to select polygon features specific to the waterfalls in that area.

Import this new data into MAPublisher, and drag and drop it into the same MAP View as the water layer. The data will be automatically scaled and projected to align with the water layer. Apply a graphic style fill for the water bodies and waterfall area.

Next, we can go back to Overpass Turbo and extract road and highway data. You can build out more complex query statements using basic database operators (i.e. and/or). For longer, complex query statements it helps to create saved queries that you can re-use. This map uses a saved query statement called “selected roads with residential” to extract line features covering most road types:

(highway=primary or highway=secondary or highway=cycleway or highway=path or
 highway=motorway or highway=trunk or highway=tertiary or
 highway=neighborhood or highway=footway or highway=service)


Import the roads data into the same MAP View as the other datasets. If you look at the MAP attributes you can see the road data is split into several different types. Steve use’s MAP Themes to create rules-based stylesheets to visualize the different road lines based on their road-type attributes. Steve designed a rule-set that made minor roads more subtle in appearance, while major roads and highways became more prominent. He also used colour to distinguish between pedestrian and vehicle network links.

Repeat this process with a building footprint layer and crop all layers in the final map to the artboard extent. The finished product is shown below (top). Some final touch-ups in photo editing software can be used to create a more stylized appearance (bottom).

Exported map from Illustrator

Stylized version modified with Photo editing software

***

About the Author

Steve Spindler has been designing compelling cartographic pieces for over 20 years. His company, Steve Spindler Cartography, has developed map products for governments, city planning organizations, and non-profits from across the country. He also manages wikimapping.com, a public engagement tool that allows city planners to connect and receive input from their community using maps. To learn more about Steve Spindler’s spectacular cartography work, visit his personal website. To view Steve’s other mapping demonstrations, visit cartographyclass.com

It’s #NationalColdCutDay, So Here’s a Subway Subway Map of Toronto

March 3rd is National Cold Cut Day… so happy #NationalColdCutDay to you! Cold cuts have been around for more than 2,000 years and today, it is so ubiquitous that any populated place with a market or grocery store stocks it. Even more so, the up-rise of fast food provides the convenience of someone making a cold cut sandwich for you (even better!). Recently, we came across a subreddit called /r/subwaysubway – a collection of subway-style maps of Subway® sandwich restaurants. While most cities boast several dozen Subway locations, Toronto, ON has the density and population to support more than 200. So in honour of National Cold Cut Day, we’re going to create a Subway subway map of Toronto with some of our favourite mapping tools. While this is only meant to be a light-hearted project and not an authoritative source of all Subway locations, please forgive us if we missed a few locations. That said, we used some available web tools in combination with MAPublisher to create a mapping workflow that might inspire you to create your own Subway subway map.

Finding Subway locations

Finding all (most) of the Subway shops was easier said than done. A combination of several sources were used to achieve this. We used the MAPublisher feature called Find Places to scan areas of Toronto to search and import the Subway location point data. This task was performed several times, simply because of the high density of Subway locations in Toronto. In addition, the source provides useful attribute data including name, address, and neighbourhood fields that will be useful for labeling (more on that below).

MAPublisher Find Places - Subway locations

To verify these locations, we also used a web tool called overpass turbo that has some handy tools to build a query that searches OpenStreetMap and filters data that can be easily exported. We simply exported the queried locations as a KML file and used MAPublisher to import it. Unfortunately, these locations did not include any attribute data, however, there were several points included that the MAPublisher Find Places tool missed. We then searched Google Maps and the Subway website to verify several addresses that were missing in the attribute data. Again, we probably missed some locations, but this is supposed to be fun, right?

Overpass Turbo Subway query

With most of the sourcing completed, we end up with a map that looks like the one below. All the Subway restaurant locations can now be considered subway stations. We also used a Toronto boundary layer and streets layer from Open Data Toronto that was transformed to use a projection of NAD 83 / UTM Zone 17N with a -18 degree rotation at approximately 1:65,000 scale. The boundary and streets layer won’t be used in the final map, but helps when navigating the map, especially if you’re (un)familiar with the city.

Subway location imported into MAPublisher

Converting to a subway style map

Using a very liberal amount of cartographic license, we created MAP line layers and used the Adobe Illustrator pen tool to connect Subway locations to what felt natural based on knowledge of the city including following major roads, existing transit corridors, geography, and neighbourhoods. The downtown core was the most difficult to connect as it was densely populated with Subway shops (almost one at every major intersection — impressive), although it loosely represents the grid layout that the downtown core is actually based on.

After some quick connections, we created a MAP Theme to style for the Subway points layer. We created two styles: one for regular stations and one for interchange stations – where our fictional subway riders (eaters?) can transfer to another line. To mark stations as an interchange, we created a new boolean attribute that designates it as true or false. If the rule is true, then it uses a Interchange symbol to denote it as an interchange.

Station stylesheet

Once we felt like we had a solid coverage with interconnecting lines, we copied the Adobe Illustrator document to a new one, hid the boundary and street layers, and began the task of converting it into a styled subway map. For simplicity, we used a typical orthogonal method that employs lines at any multiple of 45 degrees. Needless to say, this took some time and patience as there are many points to align, nudge and decipher. This is where having the geographically accurate map, some of the online maps, and other sources to refer to was very handy.

Styled Subway Map

Compare it to the geographic version (some lines and points may have been moved or redone during the conversion to follow the orthogonal method).

Geographic station map

Labeling shouldn’t be tough, right?

We decided to use MAPublisher LabelPro, an intelligent and obstacle-detecting labeling engine, to label the subway stations because there are so many of them. With a little bit of setup, it can label the entire map in just a few seconds. Using the same rule used to designate stations as an interchange, we created two styles for the labels using the label filter. Interchange stations are slightly larger and have a bold font. We designated the label source to use the attributes from the Subway point layer, in this case, a neighbourhood name. Lastly, we designated the lines as obstacles so that LabelPro can detect whether a label will interfere with them or not.

Using MAP LabelPro to label stations

We also configured placement rules so that the stations have a preference to be labeled at bottom and top, and then at positions around the point if the first two aren’t possible. In addition, we specified a label offset so that the labels are placed more evenly without too much fine-tuning afterwards.

Station point rules

After LabelPro placement and some manual tweaking, the result is a cleanly labeled map. Here’s a detailed view.

Detailed station labels

While the neighbourhood attribute was unique in most cases, some dense areas such as downtown Toronto had station names repeat itself. In these instances, we relabeled them with its street name, a nearby landmark or park. This may not be the most accurate, but it was fun to come across neighbourhoods or areas we’ve never heard of and it allowed us to learn more about our own city.  Another great source to use was this Toronto neighbourhood map that allowed us to quickly verify which neighbourhood a particular Subway sandwich was in.

While we’re sure there are probably many more tweaks to make to this map and more stations to add, here’s our take on the Subway subway Map of Toronto. Make sure to click the links below to see the high-res PDF versions.

Toronto Subway subway map

Click to see the high-resolution PDF version

And in the spirit of traditional Toronto Transit Commission (TTC) maps, here’s one with a black background.

Toronto Subway subway map TTC style

Click to see the high-resolution PDF version

Additional resources