My Account     Contact Us     Cart

Mapping Class: Georeferencing Techniques Part One – The Basics, with Hans van der Maarel

Welcome back to another exciting edition of Mapping Class, a new video-blog series where we curate tutorials and workflows created by expert cartographers and Avenza power users from around the world. For this article, we are excited to introduce Hans van der Maarel, owner of Red Geographics, and expert cartographer. Joining us from Netherlands, Hans has put together a video tutorial showcasing tips and tricks for tackling Georeferencing in a variety of different mapping scenarios. In this first part, Hans goes over the basics of georeferencing in MAPublisher, using a neat city map of Zevenbergen. Tune in for Part Two, coming soon, which will reveal how Hans approaches more challenging georeferencing tasks, including dealing with unknown projection information and working with historical maps.

Hans has produced a short video walkthrough detailing part one of his georeferencing process. The Avenza team has produced video notes (below) to help you follow along.

***

Georeferencing Techniques Part One: The Basics
by Hans van der Maarel (video notes by the Avenza team)

Georeferencing is the process of taking imagery or map data that lacks geographic location information and associating it with specific coordinates on Earth. Georeferencing is a very common, but sometimes challenging step that is necessary for producing accurate, meaningful cartographic products. By georeferencing map data, cartographers can ensure that the features on their maps are located correctly, and in a way that accurately represents the real world. Georeferencing also makes it easy to add and update maps with new data layers, as location information stored within the new map layers will be accurately overlaid in the correct position on older map projects. The process for georeferencing maps can be complicated, but Hans has outlined some easy-to-follow steps for quickly performing and validating simple georeferencing tasks with vector map data.

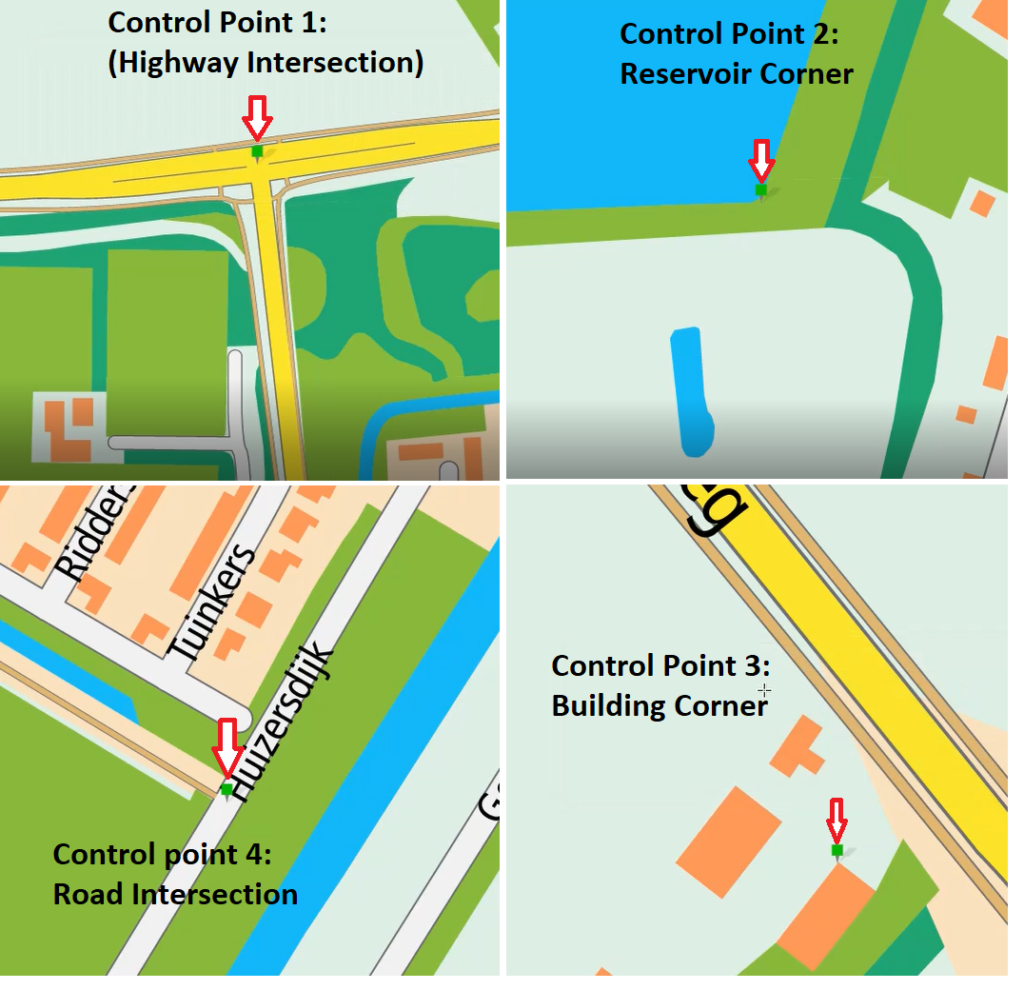
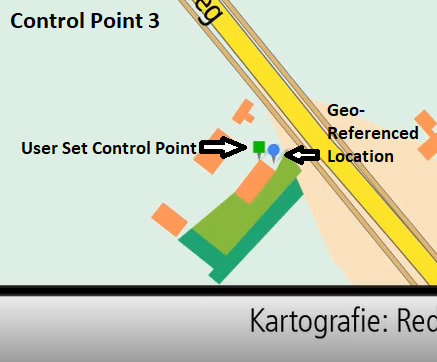
In general, effective georeferencing needs to include at minimum three known control points. In this example, Hans has included an additional fourth control point to provide additional accuracy. 

When locating control points, it is a good idea to choose points that roughly approximate the four corners (quadrants) of your map area. Doing so can ensure the georeferencing result is accurate for the entire coverage of the map area and minimizes distortion/shearing effects as the map layers are matched to the final coordinate system. Cartographers should take time to ensure the chosen control points are as accurate as possible, as errors in control point placement will propagate across all locations in the map. Poor control point placement can lead to overall poor georeferencing accuracy. 

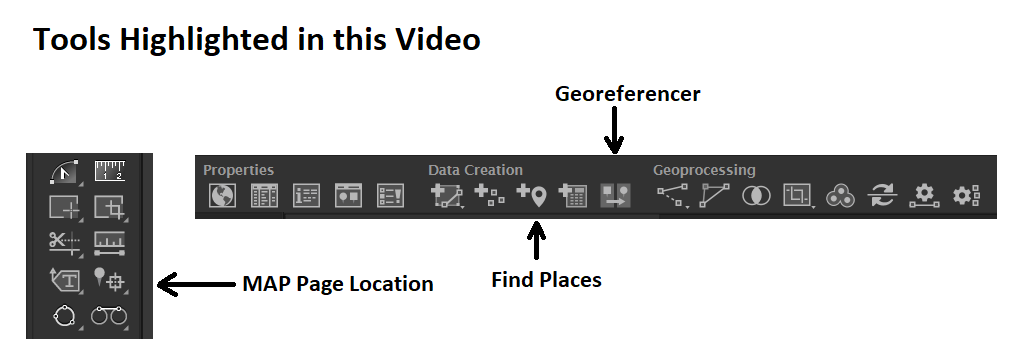
Using the MAP Page location tool, place four control points at known, easily identifiable locations. Hans recommends placing control points at recognizable map features that can be easily seen on the reference imagery. For this example, Hans chose to use the corners and edges of major structures (i.e larger buildings/reservoirs) or the centers of well-known major road intersections. When using road features as reference control points, Hans recommends using the center of the feature rather than the edge. This can compensate for variation in road edge placement that can occur when the vector line layer does not completely match the true road/lane width in the imagery.

Mapping Class Georeferencing control point

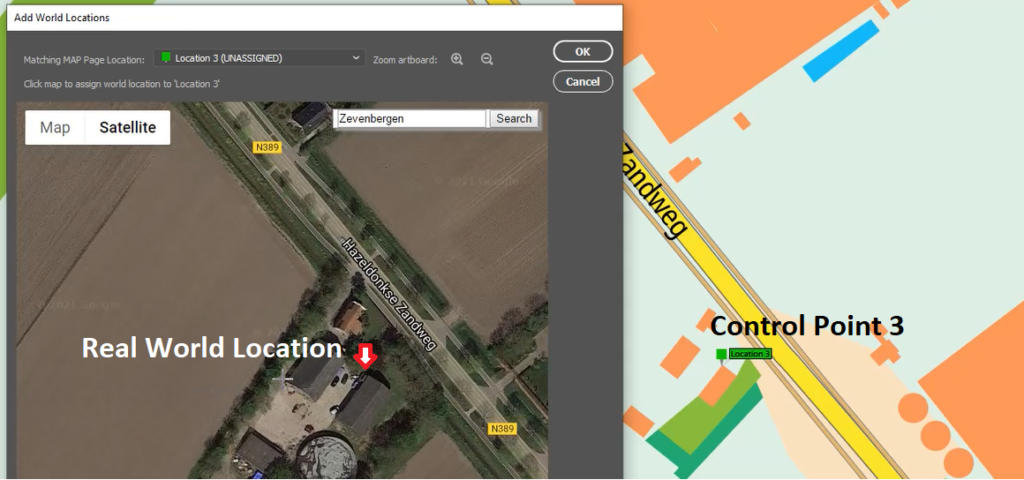
Next, open the Georeferencing tool and select the “Add World Locations” option. From here, use the built-in web map to calculate latitude/longitude coordinates for each of your known control points. Using the satellite imagery view can make this process easier, especially when dealing with physical features on the map (i.e building corners). Repeat this for each of the four control points.

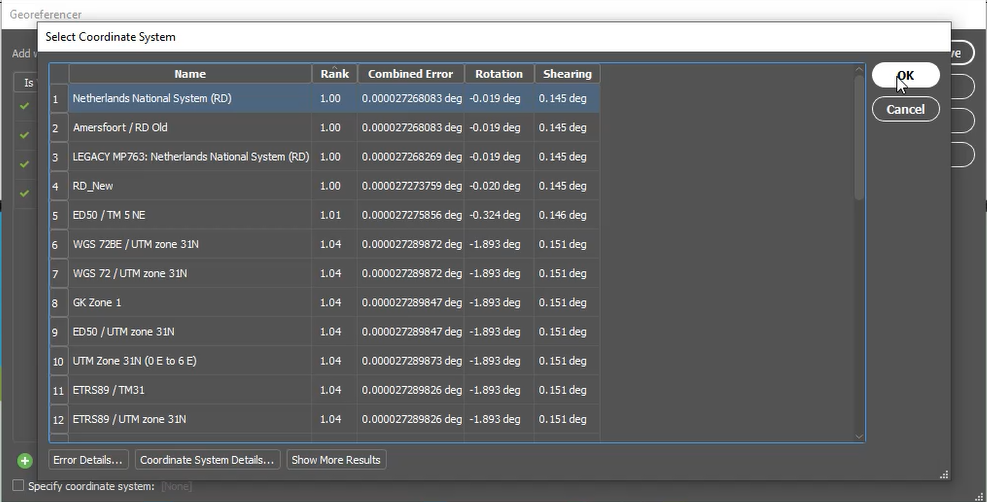
The resulting table will show a list of set coordinates for each of these control points. From here, if you already know the projection the map data is already in, you may set this coordinate system at this stage. If you are unsure, the georeferencer tool will automatically provide a suggested list of coordinate systems that match the control points you have set. These “best” matches are provided based on measuring the error between your user set coordinates and the real-world locations on the web map. Ideally, you want the lowest combined error value. In general, the suggested coordinate systems at the top of the list are often the best choice.

Once you select the desired coordinate system, the tool will automatically create a new MAP View where you can house your newly georeferenced map data. You will notice that the MAP Page Locations you created earlier will be displayed alongside the newly georeference control points. This is a great way to help validate your georeferencing as you will be able to observe the accuracy (or inaccuracy) of your placed control points.

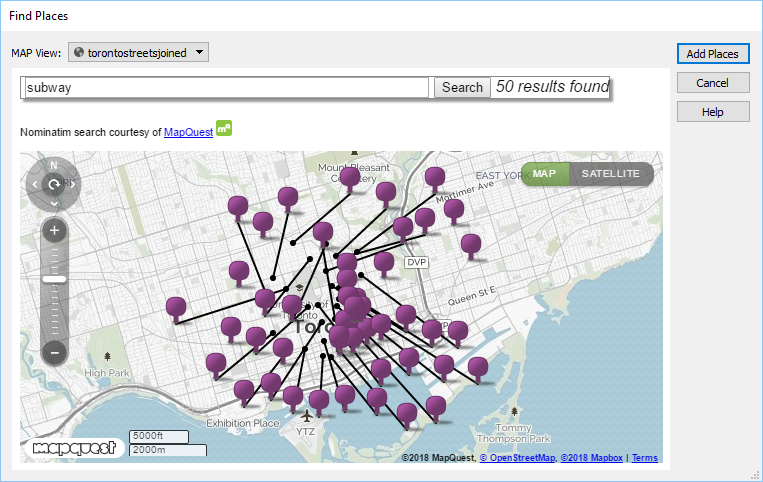
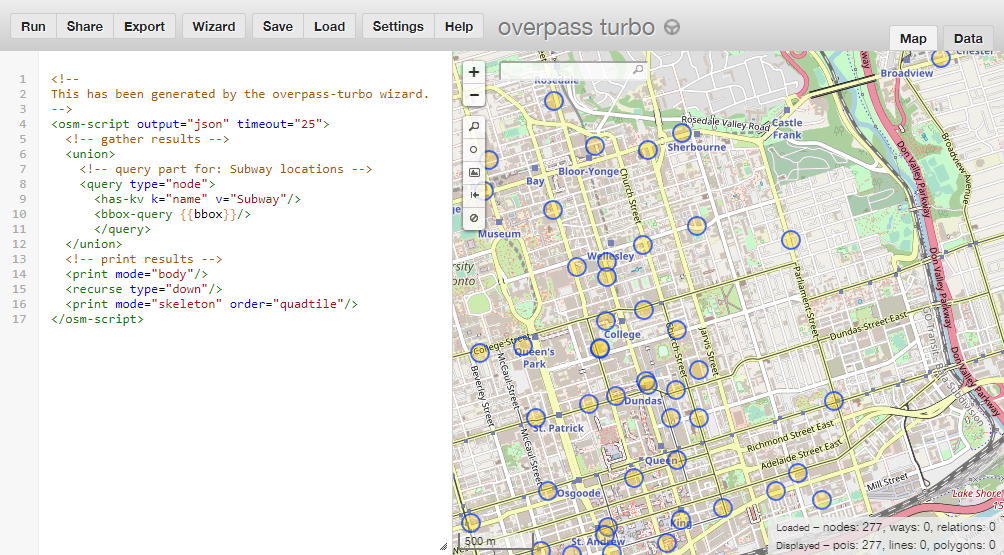
Finally, it is a good idea to use the Find Places tool to validate your georeferencing results. Try searching for identifiable landmarks or major features on your map (i.e. train stations). Simply search for a location using the Find Places tool, and compare this to the georeferenced locations on your map.

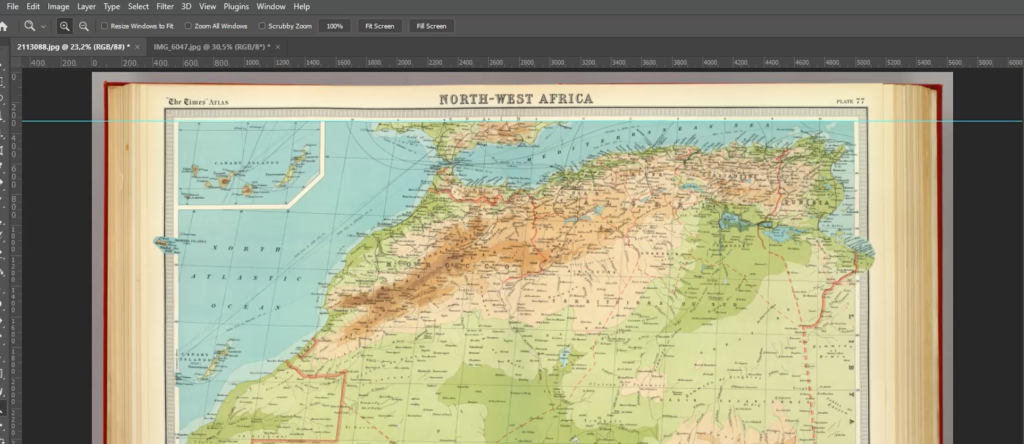
This concludes Part One of “Georeferencing Techniques with Hans van der Maarel“. Now that you have covered the basics of Georeferencing in MAPublisher, tune in for part two in the next edition of Mapping Class. There you will see how Hans tackles more complex georeferencing projects, including what to do when you have small-scale maps that come from scanned or printed images, or where projection or referencing information is unavailable. Hans will be using a beautiful historical map of northwest Africa to demonstrate this problem. Look for it in the Avenza Resources Blog next month.

***

About the Author

Hans van der Maarel is the owner of Red Geographics, located in Zevenbergen, Netherlands. Red Geographics is a long-time partner of Avenza and Hans is a well-known power user of both MAPublisher and Geographic Imager. He uses the products for a wide range of cartographic projects for several international organizations and offers training courses and consultancy expertise aimed at developing workflows for clients. In addition to that, he is currently a board member of NACIS. To find out more about Red Geographics, and to see more work by Hans, visit redgeographics.com

It’s #NationalColdCutDay, So Here’s a Subway Subway Map of Toronto

March 3rd is National Cold Cut Day… so happy #NationalColdCutDay to you! Cold cuts have been around for more than 2,000 years and today, it is so ubiquitous that any populated place with a market or grocery store stocks it. Even more so, the up-rise of fast food provides the convenience of someone making a cold cut sandwich for you (even better!). Recently, we came across a subreddit called /r/subwaysubway – a collection of subway-style maps of Subway® sandwich restaurants. While most cities boast several dozen Subway locations, Toronto, ON has the density and population to support more than 200. So in honour of National Cold Cut Day, we’re going to create a Subway subway map of Toronto with some of our favourite mapping tools. While this is only meant to be a light-hearted project and not an authoritative source of all Subway locations, please forgive us if we missed a few locations. That said, we used some available web tools in combination with MAPublisher to create a mapping workflow that might inspire you to create your own Subway subway map.

Finding Subway locations

Finding all (most) of the Subway shops was easier said than done. A combination of several sources were used to achieve this. We used the MAPublisher feature called Find Places to scan areas of Toronto to search and import the Subway location point data. This task was performed several times, simply because of the high density of Subway locations in Toronto. In addition, the source provides useful attribute data including name, address, and neighbourhood fields that will be useful for labeling (more on that below).

MAPublisher Find Places - Subway locations

To verify these locations, we also used a web tool called overpass turbo that has some handy tools to build a query that searches OpenStreetMap and filters data that can be easily exported. We simply exported the queried locations as a KML file and used MAPublisher to import it. Unfortunately, these locations did not include any attribute data, however, there were several points included that the MAPublisher Find Places tool missed. We then searched Google Maps and the Subway website to verify several addresses that were missing in the attribute data. Again, we probably missed some locations, but this is supposed to be fun, right?

Overpass Turbo Subway query

With most of the sourcing completed, we end up with a map that looks like the one below. All the Subway restaurant locations can now be considered subway stations. We also used a Toronto boundary layer and streets layer from Open Data Toronto that was transformed to use a projection of NAD 83 / UTM Zone 17N with a -18 degree rotation at approximately 1:65,000 scale. The boundary and streets layer won’t be used in the final map, but helps when navigating the map, especially if you’re (un)familiar with the city.

Subway location imported into MAPublisher

Converting to a subway style map

Using a very liberal amount of cartographic license, we created MAP line layers and used the Adobe Illustrator pen tool to connect Subway locations to what felt natural based on knowledge of the city including following major roads, existing transit corridors, geography, and neighbourhoods. The downtown core was the most difficult to connect as it was densely populated with Subway shops (almost one at every major intersection — impressive), although it loosely represents the grid layout that the downtown core is actually based on.

After some quick connections, we created a MAP Theme to style for the Subway points layer. We created two styles: one for regular stations and one for interchange stations – where our fictional subway riders (eaters?) can transfer to another line. To mark stations as an interchange, we created a new boolean attribute that designates it as true or false. If the rule is true, then it uses a Interchange symbol to denote it as an interchange.

Station stylesheet

Once we felt like we had a solid coverage with interconnecting lines, we copied the Adobe Illustrator document to a new one, hid the boundary and street layers, and began the task of converting it into a styled subway map. For simplicity, we used a typical orthogonal method that employs lines at any multiple of 45 degrees. Needless to say, this took some time and patience as there are many points to align, nudge and decipher. This is where having the geographically accurate map, some of the online maps, and other sources to refer to was very handy.

Styled Subway Map

Compare it to the geographic version (some lines and points may have been moved or redone during the conversion to follow the orthogonal method).

Geographic station map

Labeling shouldn’t be tough, right?

We decided to use MAPublisher LabelPro, an intelligent and obstacle-detecting labeling engine, to label the subway stations because there are so many of them. With a little bit of setup, it can label the entire map in just a few seconds. Using the same rule used to designate stations as an interchange, we created two styles for the labels using the label filter. Interchange stations are slightly larger and have a bold font. We designated the label source to use the attributes from the Subway point layer, in this case, a neighbourhood name. Lastly, we designated the lines as obstacles so that LabelPro can detect whether a label will interfere with them or not.

Using MAP LabelPro to label stations

We also configured placement rules so that the stations have a preference to be labeled at bottom and top, and then at positions around the point if the first two aren’t possible. In addition, we specified a label offset so that the labels are placed more evenly without too much fine-tuning afterwards.

Station point rules

After LabelPro placement and some manual tweaking, the result is a cleanly labeled map. Here’s a detailed view.

Detailed station labels

While the neighbourhood attribute was unique in most cases, some dense areas such as downtown Toronto had station names repeat itself. In these instances, we relabeled them with its street name, a nearby landmark or park. This may not be the most accurate, but it was fun to come across neighbourhoods or areas we’ve never heard of and it allowed us to learn more about our own city.  Another great source to use was this Toronto neighbourhood map that allowed us to quickly verify which neighbourhood a particular Subway sandwich was in.

While we’re sure there are probably many more tweaks to make to this map and more stations to add, here’s our take on the Subway subway Map of Toronto. Make sure to click the links below to see the high-res PDF versions.

Toronto Subway subway map

Click to see the high-resolution PDF version

And in the spirit of traditional Toronto Transit Commission (TTC) maps, here’s one with a black background.

Toronto Subway subway map TTC style

Click to see the high-resolution PDF version

Additional resources