We are back with another exciting addition to our Mapping Class tutorial series. The Mapping Class tutorial series curates demonstrations and workflows created by cartographers and Avenza software users. For this article, we are welcoming back Steve Spindler, a longtime MAPublisher user, and expert cartographer. He has shared with us an excellent tutorial on creating a map from scratch using openly available geographic data from OpenStreetMap, and accessed through Overpass turbo. Steve shows how you can create query statements to filter and export the data, and demonstrates how you can import the data into MAPublisher before using a selection of cartographic styling tools to create a visually appealing map.
Steve has produced a short video walkthrough detailing his map-making process. The Avenza team has produced video notes (below) to help you follow along.
***
Importing OpenStreetMap data using Overpass Turbo
by Steve Spindler (video notes by the Avenza team)
Finding and accessing good quality data is often the first challenge for any cartography project. OpenStreetMap (OSM) can be an excellent source of open vector data describing land cover features (roads, parks, rivers, buildings, trails, infrastructure, boundaries). Once collected, cartographers can use OSM data to create highly detailed maps using the MAPublisher plug-in for Adobe Illustrator. Steve will demonstrate his process of collecting raw data from OSM and using it to craft a beautiful map of the Niagara Falls Area. The following video notes summarize Steve’s approach. 
First, you will need to extract some data from the OSM database. Since OSM is a massive repository of geographic data, you’ll need a way to filter through and extract only the data needed for your specific map project. Overpass turbo is a web-based data mining tool that can make querying and exporting OpenStreetMap datasets easy. The tool allows users to apply query statements that filter the OSM database based on attribute and location information. Using the Overpass turbo “Wizard”, a user can enter simple queries (i.e. “water”) and automatically filter and select all features that match the query statement, making it easy to export specific data for your map.
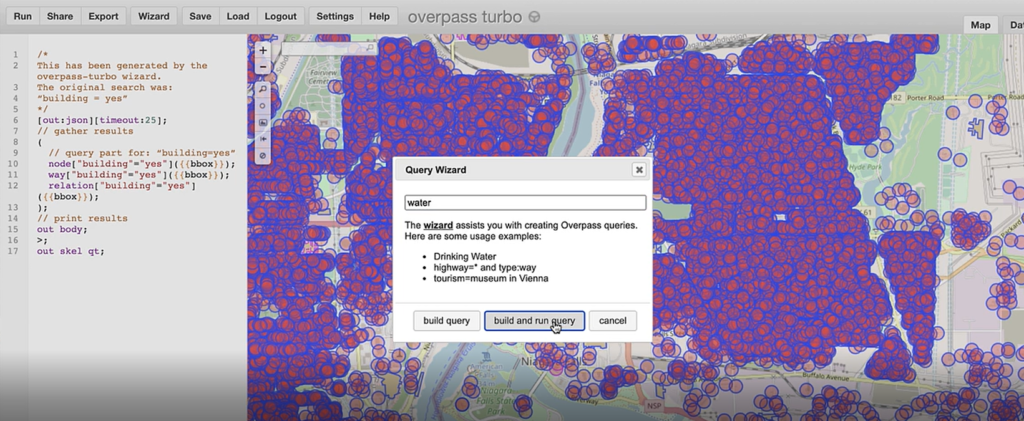
Steve uses a simple query to obtain all map features that are considered “water”. This includes both natural and man-made features
The tool allows the user to export the filtered datasets into geoJSON format, an open standard format for storing and representing geographic data and attributes.
The geoJSON datasets collected from Overpass turbo can then be imported directly into MAPublisher for styling into a finished map. Use the Import tool to load the data onto an Adobe Illustrator artboard. From here, you can open the MAP View editor to adjust the scale and projection information for each map data layer. For this map, reproject the data into State Plane NAD 83 to preserve an accurate spatial scale. Set the scale option to 25,000 and customize the position of the map data on the artboard.
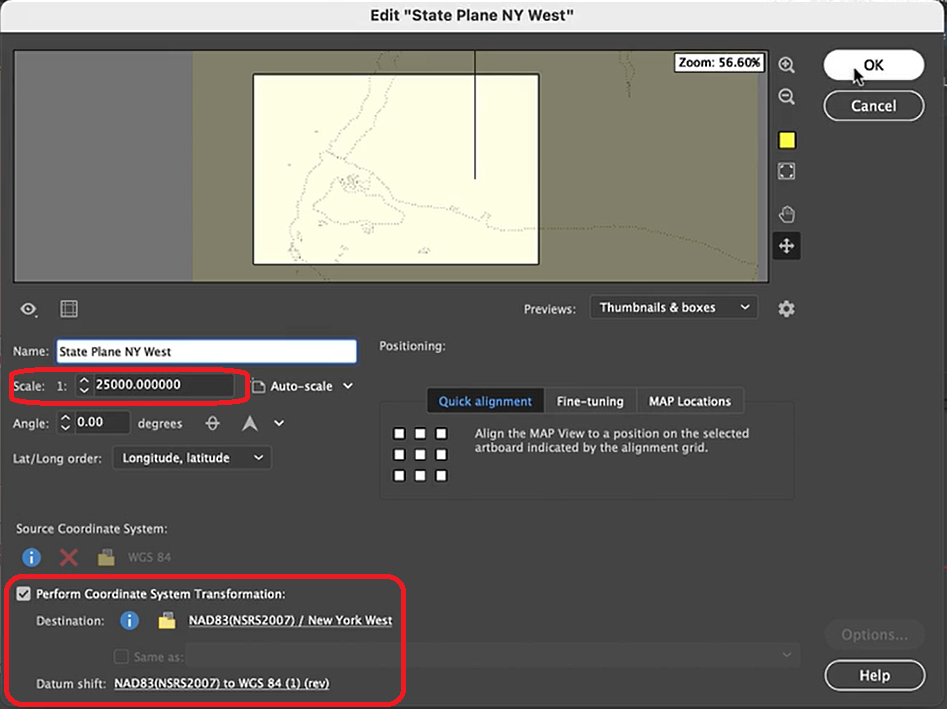
If needed, use the Vector Crop tool to trim the map data down to a specific area of interest, and simplify the layer to create smoother lines by removing excess vertices.
Back in Overpass turbo, you can build more specific query statements to extract individual features from larger data categories. Use the statement: name = “Niagara Falls”, to select polygon features specific to the waterfalls in that area.
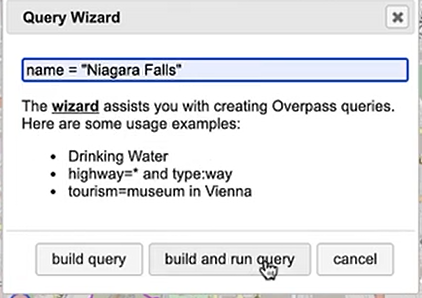
Import this new data into MAPublisher, and drag and drop it into the same MAP View as the water layer. The data will be automatically scaled and projected to align with the water layer. Apply a graphic style fill for the water bodies and waterfall area.
Next, we can go back to Overpass Turbo and extract road and highway data. You can build out more complex query statements using basic database operators (i.e. and/or). For longer, complex query statements it helps to create saved queries that you can re-use. This map uses a saved query statement called “selected roads with residential” to extract line features covering most road types:
(highway=primary or highway=secondary or highway=cycleway or highway=path or
 highway=motorway or highway=trunk or highway=tertiary or
 highway=neighborhood or highway=footway or highway=service)
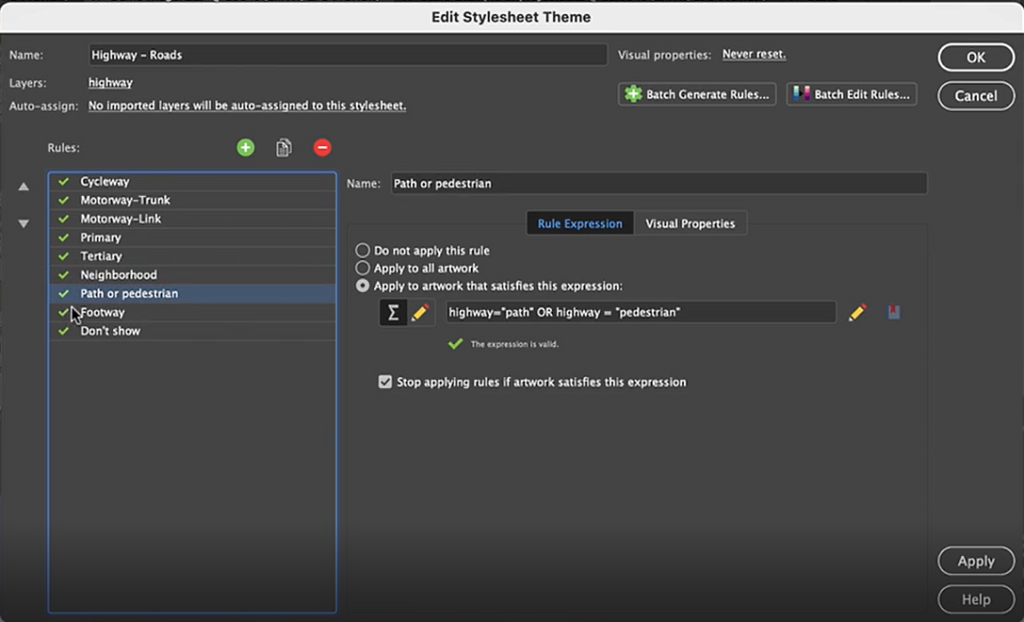
Import the roads data into the same MAP View as the other datasets. If you look at the MAP attributes you can see the road data is split into several different types. Steve use’s MAP Themes to create rules-based stylesheets to visualize the different road lines based on their road-type attributes. Steve designed a rule-set that made minor roads more subtle in appearance, while major roads and highways became more prominent. He also used colour to distinguish between pedestrian and vehicle network links.
Repeat this process with a building footprint layer and crop all layers in the final map to the artboard extent. The finished product is shown below (top). Some final touch-ups in photo editing software can be used to create a more stylized appearance (bottom).
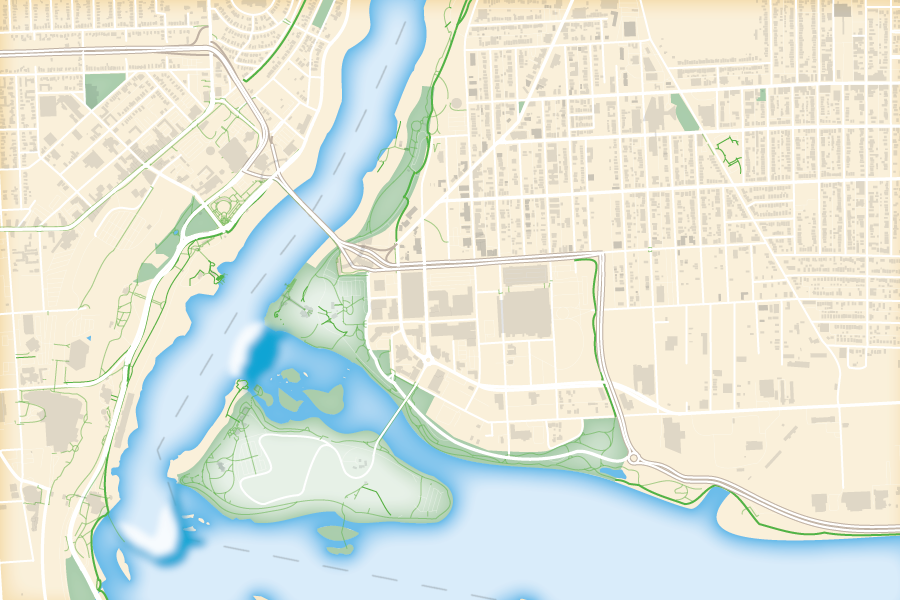
Exported map from Illustrator
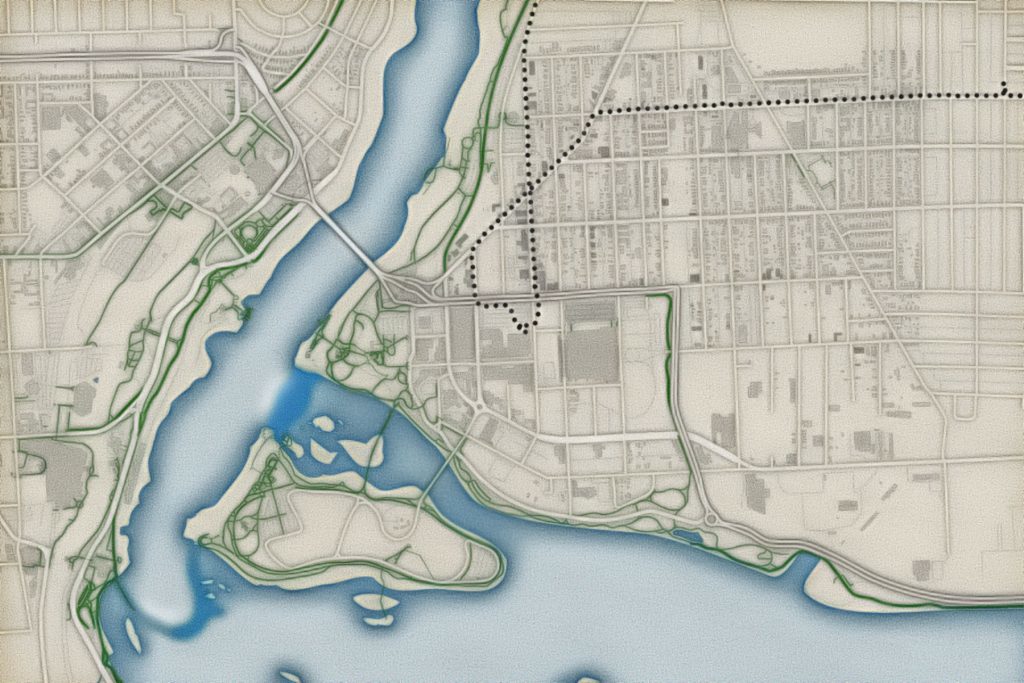
Stylized version modified with Photo editing software
***
About the Author
Steve Spindler has been designing compelling cartographic pieces for over 20 years. His company, Steve Spindler Cartography, has developed map products for governments, city planning organizations, and non-profits from across the country. He also manages wikimapping.com, a public engagement tool that allows city planners to connect and receive input from their community using maps. To learn more about Steve Spindler’s spectacular cartography work, visit his personal website. To view Steve’s other mapping demonstrations, visit cartographyclass.com


