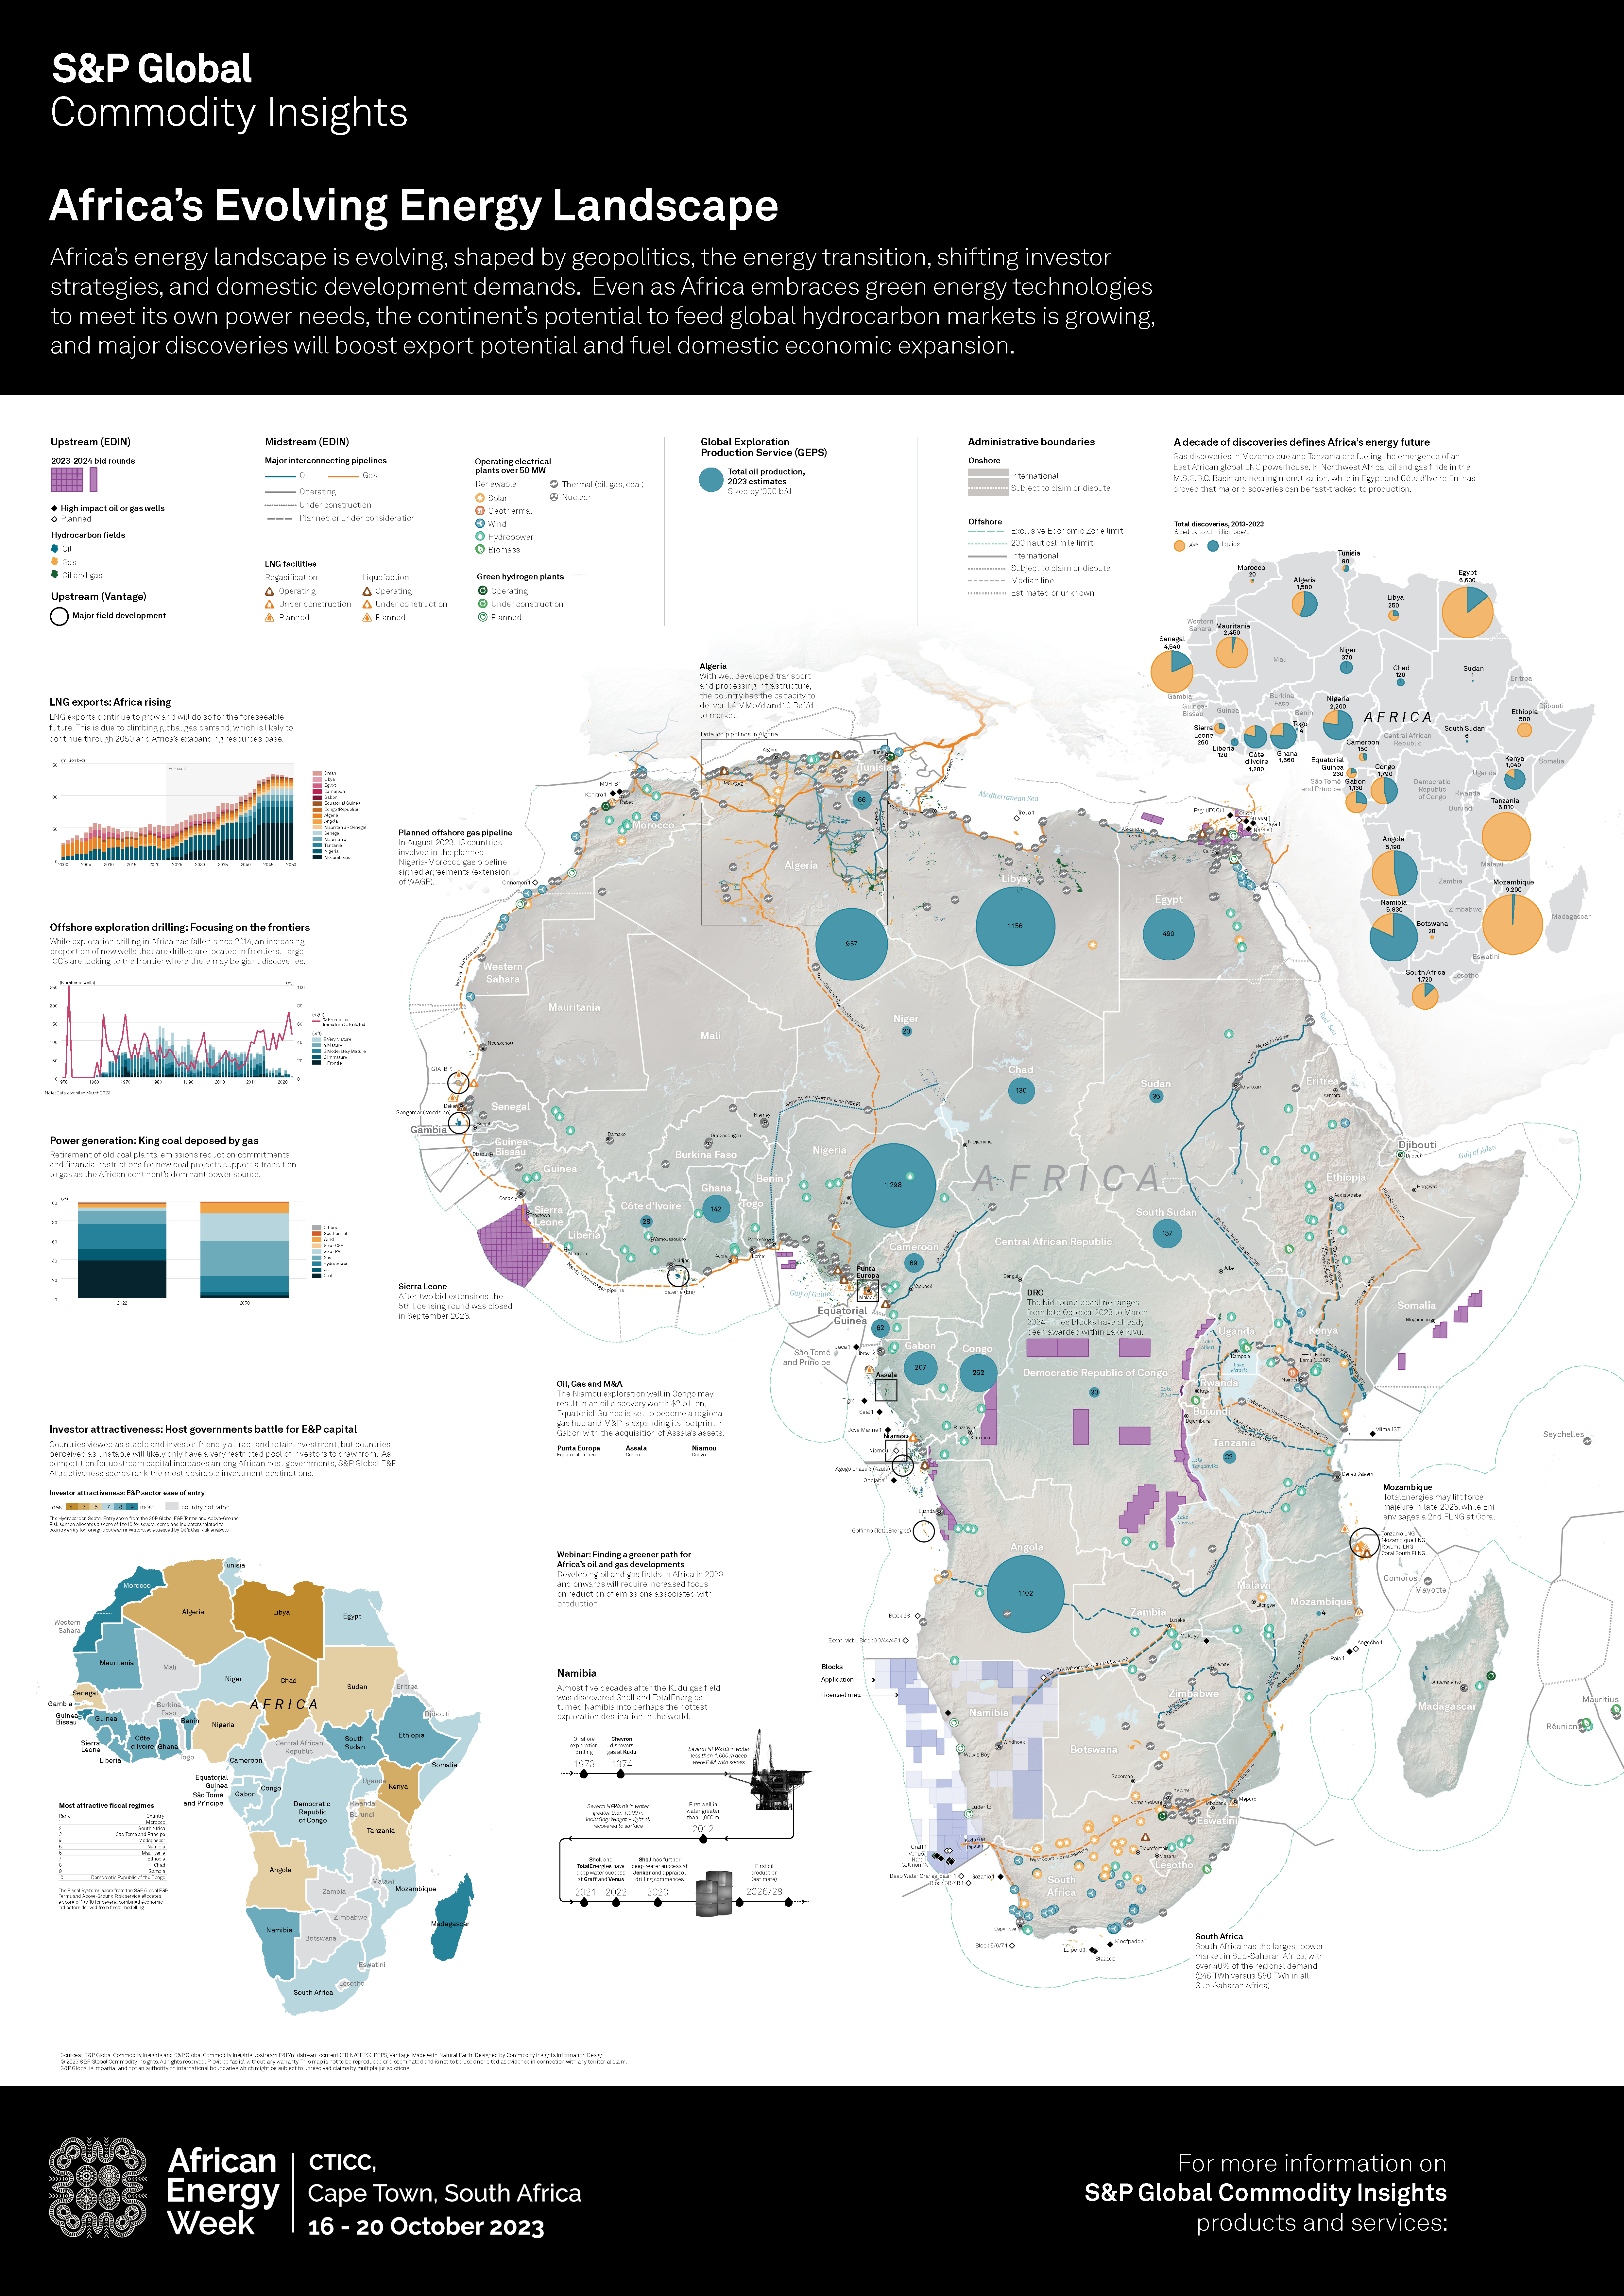
This Map Spotlight highlights the second runner-up of the 2023 Avenza Map Contest: Africa’s Evolving Energy Landscape by Ginny Mason with extra contributions from her team at S&P Global Commodity Insights including Melenie Yuen, Justin Cochrane, Roderick Bruce, Josephine Sajbel, Jennifer Tschopp, and Enrico Pedica. This infographic was shown at the African Energy Week conference, which took place in Cape Town, South Africa from October 16th to 20th in 2023. It was created with the versatility that it could function as a small handout as well as a large, wall-mounted map. The handout versions of the map also included a QR code which linked to an interactive online PDF. According to Ginny, this map is “the culmination of Commodity Insights’ midstream and upstream geospatial data, and several other products that we provide to decision makers in this field.”
Select the images below to see a detailed look at Ginny’s map
Making the Map
All map elements of Ginny’s infographic were created with the help of MAPublisher tools. After pre-processing her data using other software, she imported it into MAPublisher and then re-projected it as required. The Copy MAP Objects From tool was also used to quickly grab elements from other maps Ginny had already created.
Since there are several different map elements to this infographic showing various types of energy data, the MAP Attributes panel came in particularly handy for Ginny, allowing her to easily calculate, edit and append data to her attribute tables. Once her data was prepared, she could use the Merge Layers tool and the Split Layers tool to further organize her spatial data layers systematically according to their attributes.
Ginny used the Find Places tool to search for and plot relevant point data on her maps, such as energy plants, gas wells, and oil fields. The MAPublisher LabelPro add-on was used to easily generate labels for all of her data as required. She also used the Simplify Art tool to smooth the edges of excessively detailed lines and area data. Ginny added finishing touches to her map by adding supplemental elements such as a Scale Bar.
See the winners announcement for the 2023 Avenza Map Contest here, and check out our other Map Spotlight blogs here!
In this edition of Cartographer Chronicles, we interviewed Christina Shintani, the creator behind the winning map of the 2023 Avenza Map Contest! Christina is a talented cartographer with particular experience in creating maps that highlight environmental issues. Her interest in cartography began while studying fluvial geomorphology in graduate school and has been growing ever since. Christina uses cartography to make a difference in the world and raise awareness about how climate change is affecting it, with her maps appearing in National Geographic, Rolling Stone, and the Atlas of Design. In this edition, Christina is sharing her cartographic journey with us in her own words.
***
Career Journey in Cartography
My journey in cartography started with a string of lucky choices and following my interests. As a freshman at William and Mary, I signed up for an Introduction to Physical Geography class to fulfill a general science requirement. I found myself fascinated with every topic and lecture. Eventually, I realized I wanted to keep learning about geography, so I created my own major because my college didn’t offer it. After graduating, I continued on to get my master’s in geography at the University of Oregon. I started grad school with the intention of studying fluvial geomorphology, and while I did continue to study rivers, I left grad school wanting to become a cartographer. This changed when I signed up for the advanced cartography course for no reason other than liking maps, and it changed what I wanted to do in my career.
After graduating with my MS, I moved to Portland, Oregon. After a string of short-term jobs, I got a job as a cartographer and data analyst at a public transit consulting firm, where I made transit maps for cities across the country. After a few years there building my portfolio, I was offered a position at National Geographic, where I made maps for the magazine and website, covering a range of topics from conservation and animals to climate change. This is where I was first introduced to Avenza products, MAPublisher and Geographic Imager. Every map I made (while at NatGeo and since) has been made using Avenza products, and it’s hard to imagine going back.
After a few more years, I joined Woodwell Climate Research Center as a cartographer, where I still work today. I make maps to communicate climate science for research papers, communities wanting to understand how climate change currently impacts them and how it will impact them in the future, policymakers in Congress and the Senate, and the general public.
Cartographic Highlights
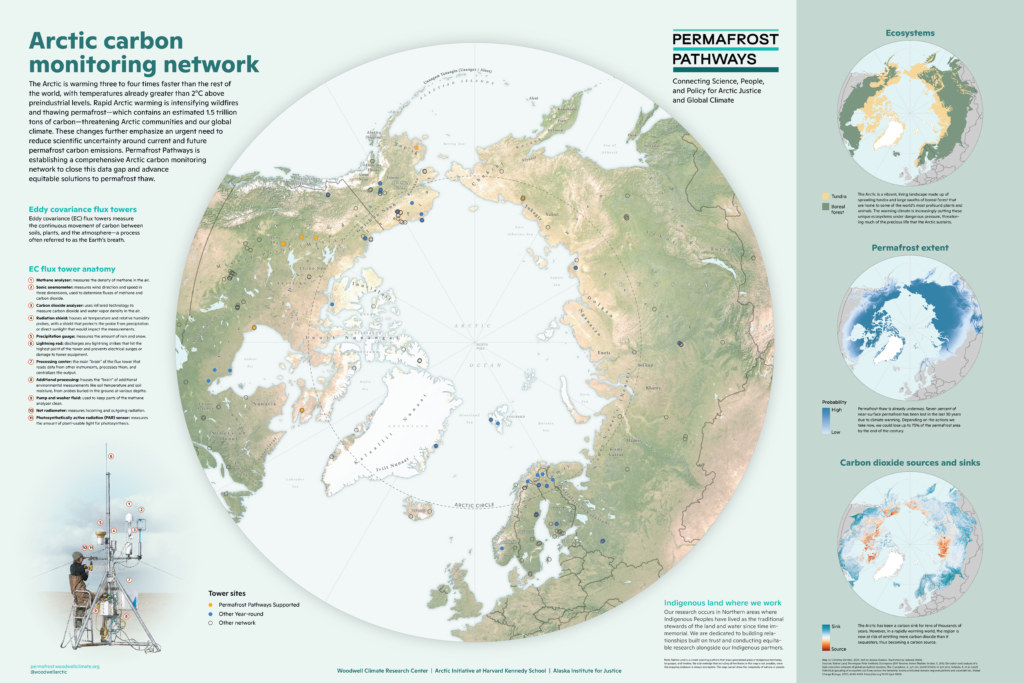
One important map project is the Arctic carbon monitoring network map which I won the Avenza award for. This map highlights how Woodwell’s tower network is critical to understanding how carbon feedbacks are accelerating warming in the Arctic and impacting global weather. We often use maps to communicate climate science in order to change policy. Most recently, it was brought to the Conference of the Parties (COP) and used to communicate our work to Senators Murkowski and Markey.
A large mapping project I worked on this past summer at Woodwell was in collaboration with the Center for Climate and Security. I created two story maps detailing how worsening climate change will contribute to security challenges in Iran and Türkiye. These maps were presented to politicians on Capitol Hill, where it was attended by congressional staffers across the political spectrum.
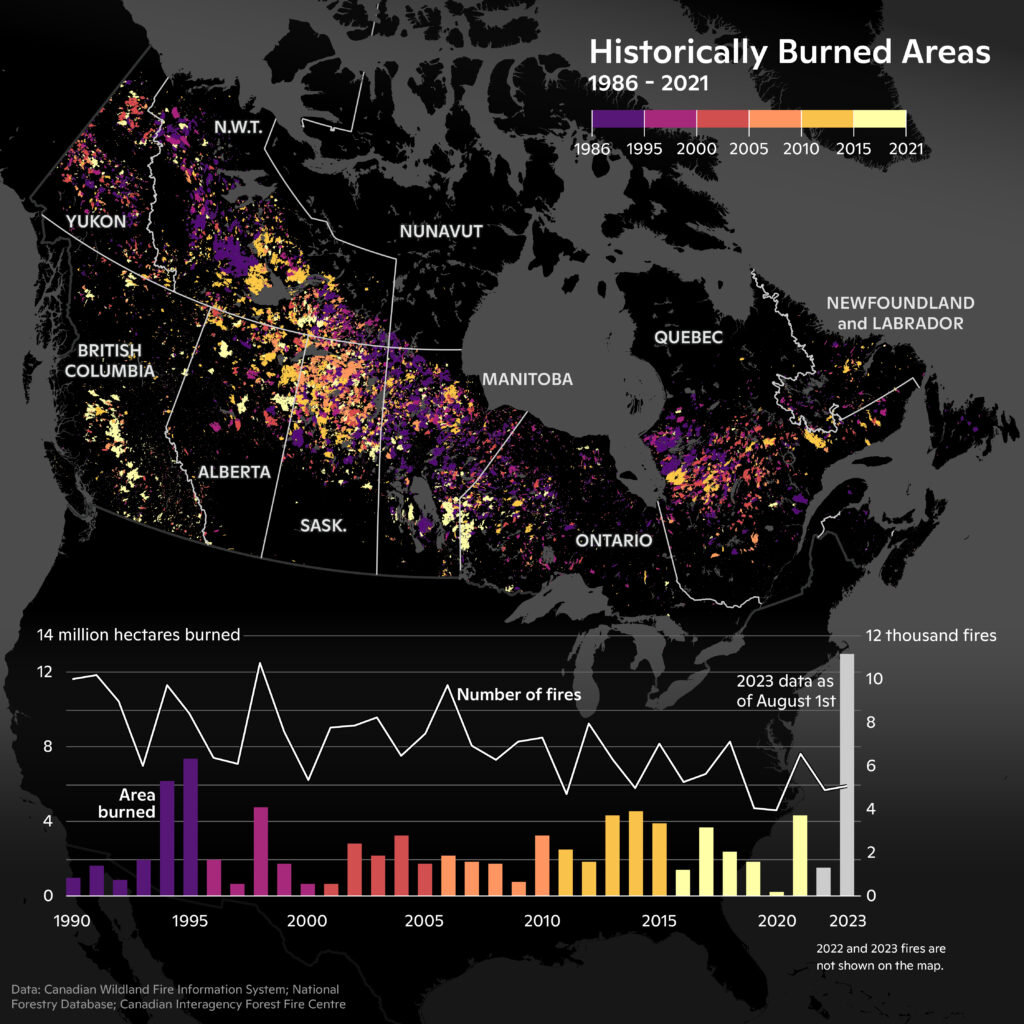
While we don’t always have the capacity to respond to current climate events, the wildfires in Canada this past summer were historic. I worked quickly to analyze, map, and chart the historically burned areas in Canada to illustrate how this summer’s wildfires were exponentially larger and occurred very early in the wildfire season in comparison to previous years.
I make maps with Adobe Illustrator and Photoshop every day and therefore use MAPublisher and Geographic Imager daily. MAPublisher makes it so easy to start a map, and later completely change everything about it without starting over or going back to GIS. The features I use most often are the import tool (sometimes with spatial or layer filter), applying Map Themes, scale bar, and label features. I often have to convert a map from print to digital or vice versa, so I use the Map Views to change the scale of the map.
Advice to Aspiring Cartographers
My advice to early career folks/people wanting to get into cartography: even if your current job doesn’t include map making, build your portfolio in your free time with maps that interest you and that you feel excited about making, and create a website to showcase them.
Check out our Map Spotlight on Christina’s winning entry of the 2023 Avenza Map Contest here!