


Many of our MAPublisher clients are cartographers and GIS professionals, but a growing number are graphic designers who are tired of the tedious work of making maps without specialized tools. Making a map is part art and part science and while we help bridge the gap between Geographic Information Systems (the science) and graphic design (the art), as a graphic designer, you may not be familiar with the wonderful world of GIS.
So on this GIS Day, we have compiled the definitions to a few common GIS terms that you may encounter; GIS Day, celebrated each year, in November to help educate non-GIS professionals about the importance of geospatial information systems and the benefits that GIS brings to our lives.
1. Spatial Analysis
Any good and useful design involves analysis. This process of stacking layers, inspecting and interpreting model results seeks to solve complex location-oriented problems. This can be used for predictive analysis, estimating the level of suitability and for further understanding of the geographic location.
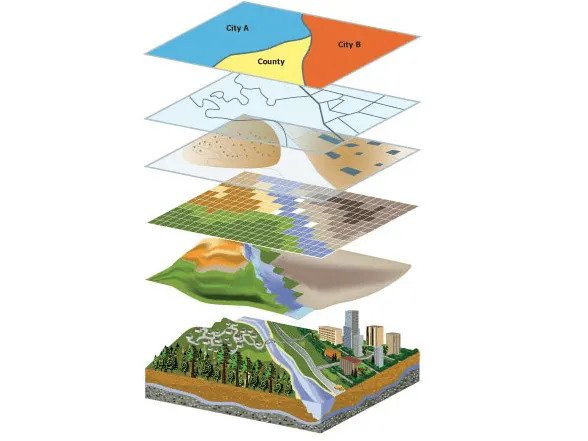
2. Layer
Maps contain several layers, each representing a set of spatial features. Layers are laid atop one another for viewing or spatial analysis. This lends itself to working with the map layers in Illustrator, as they can be treated similarly to a layer containing artwork.

3. Attributes
Attributes denote a geographic feature on a map. The information is typically stored in a tabular format that is linked to the feature. For instance, the attributes of a well-represented point along a river may include the name, the course of the river/ length, sediment load, etc.
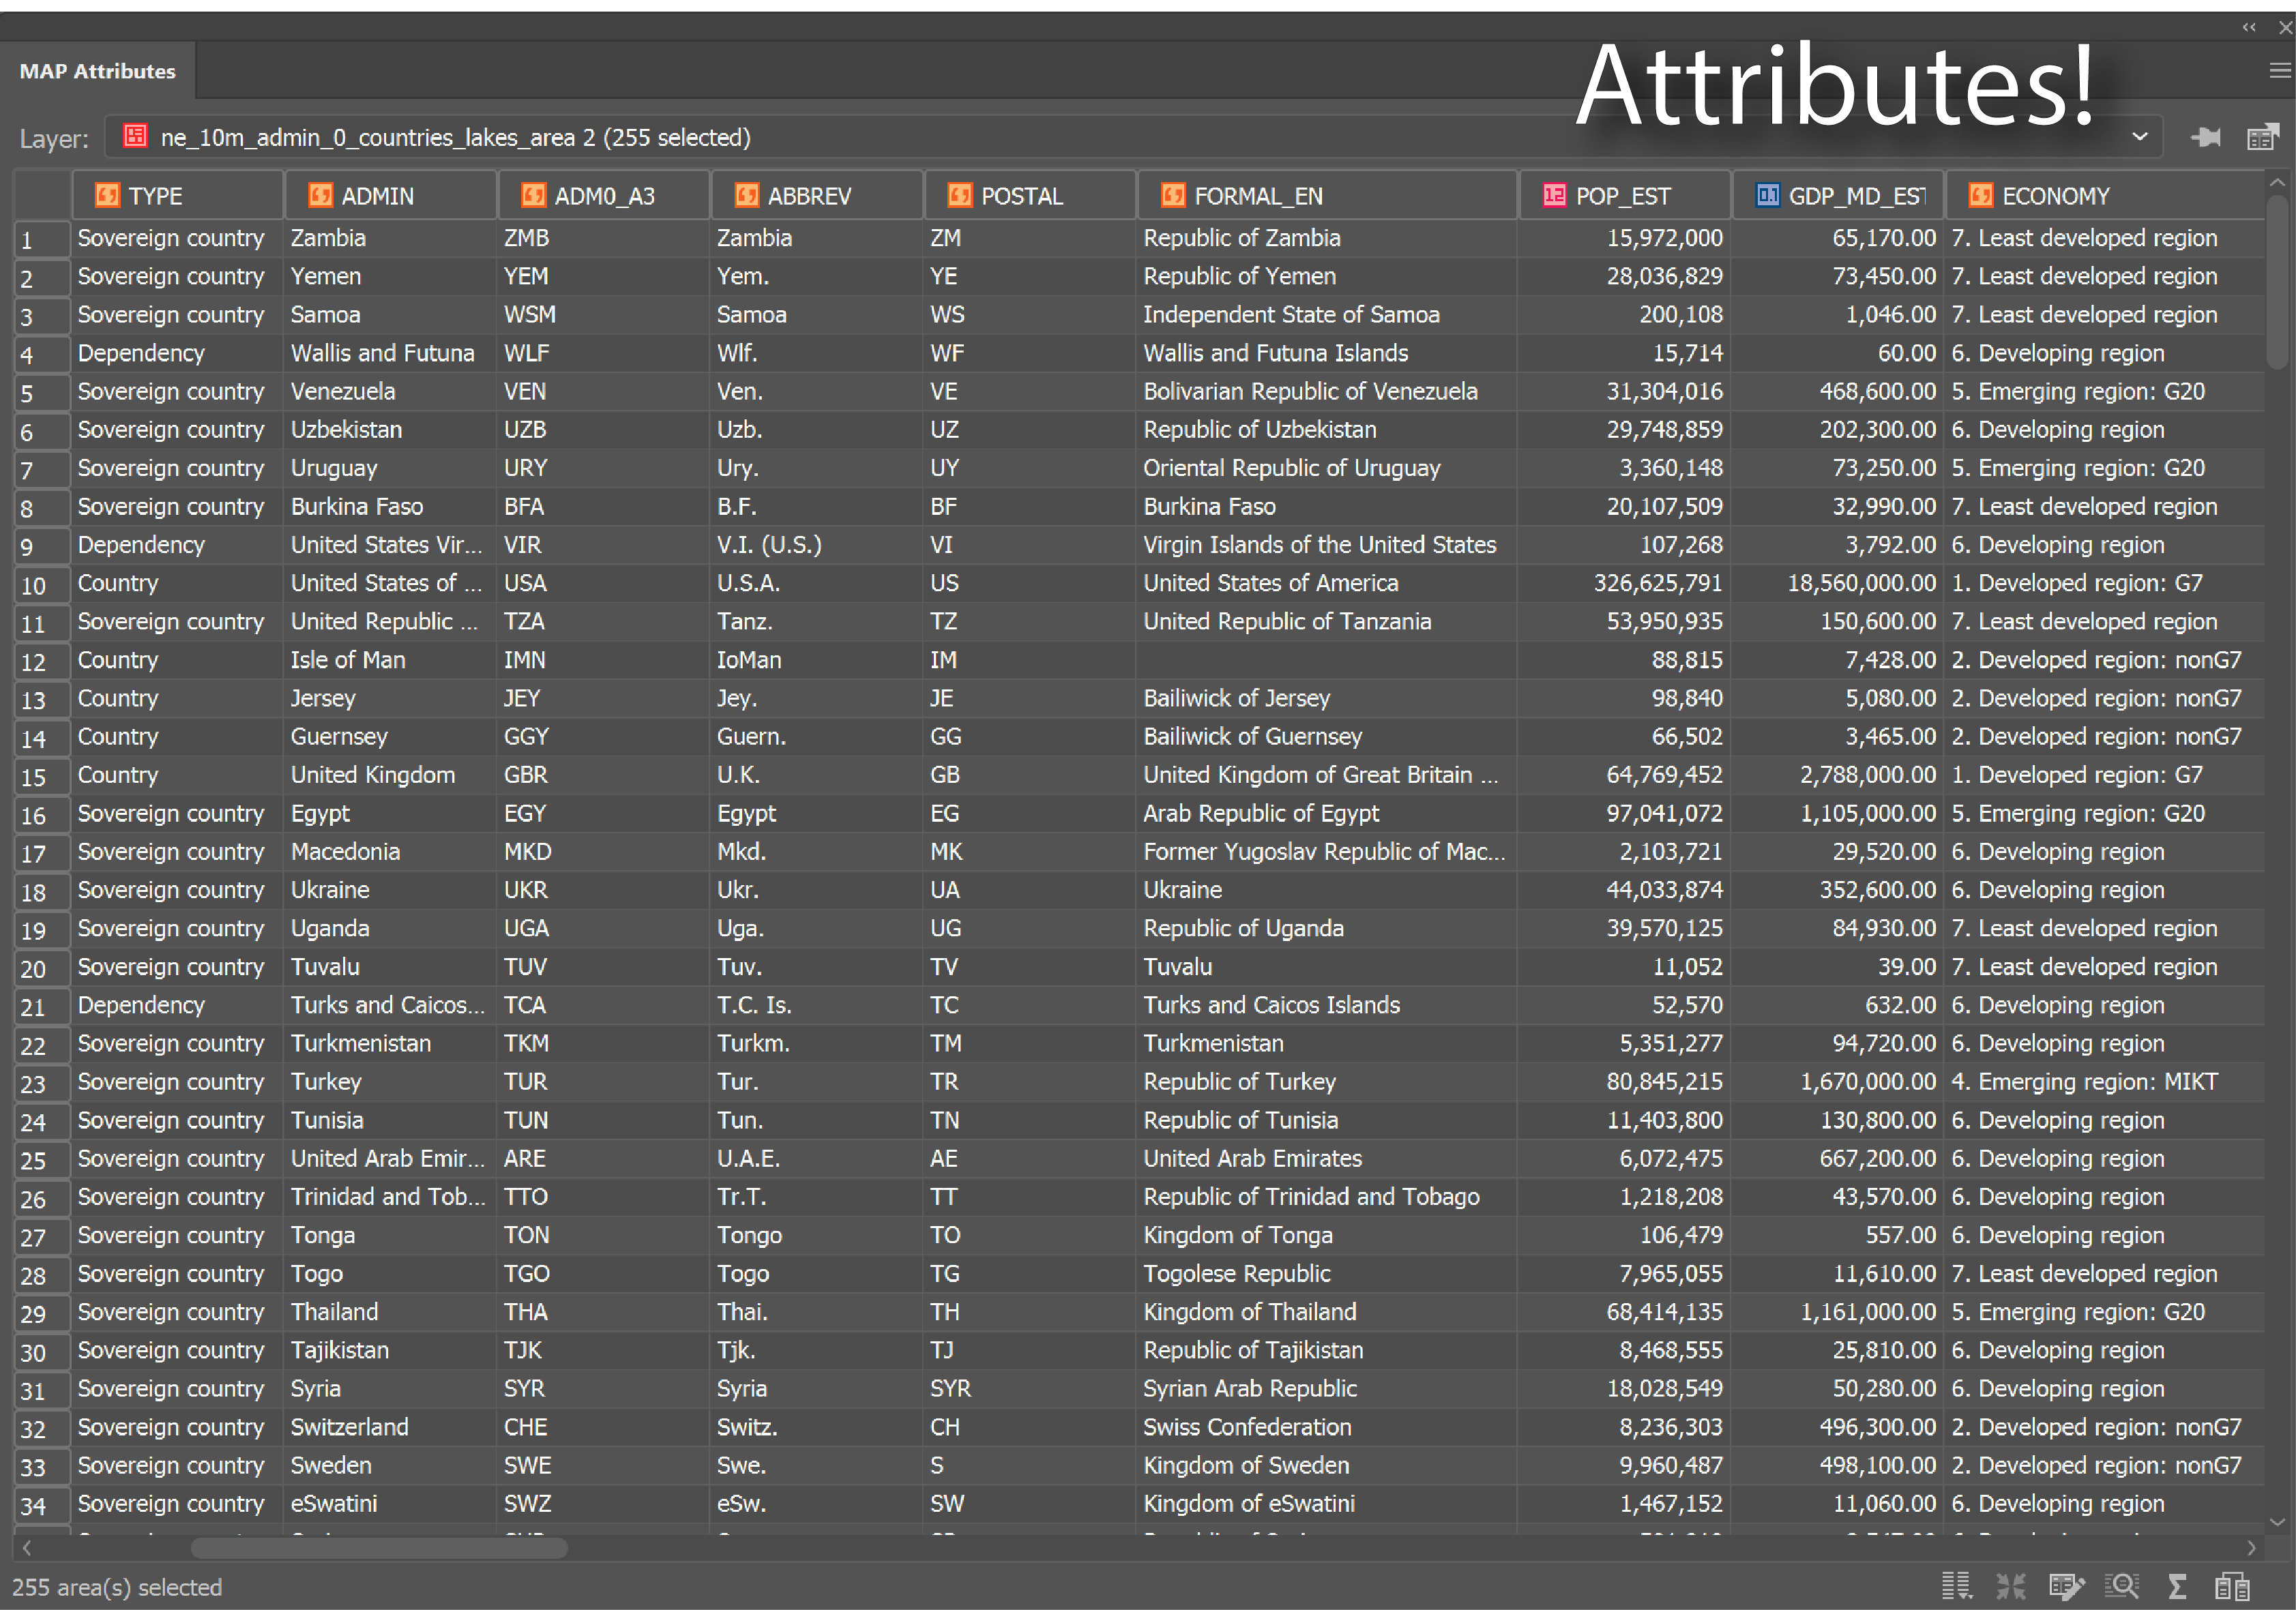
When you are familiar with the attributes associated with the map data, you can do things like applying rules to style your map according to attributes in the table.
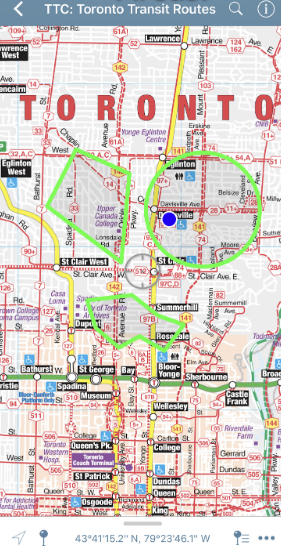
4. Geocoding
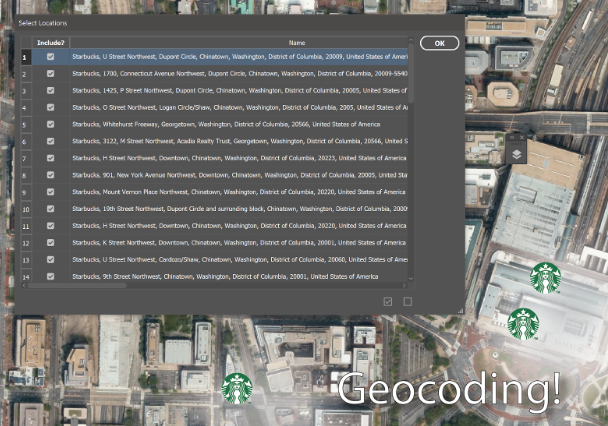
The process identifies a location by its geographic coordinates (latitude and longitude). This is used to position places and features on a map as well as to reference the map itself.
5. Buffers
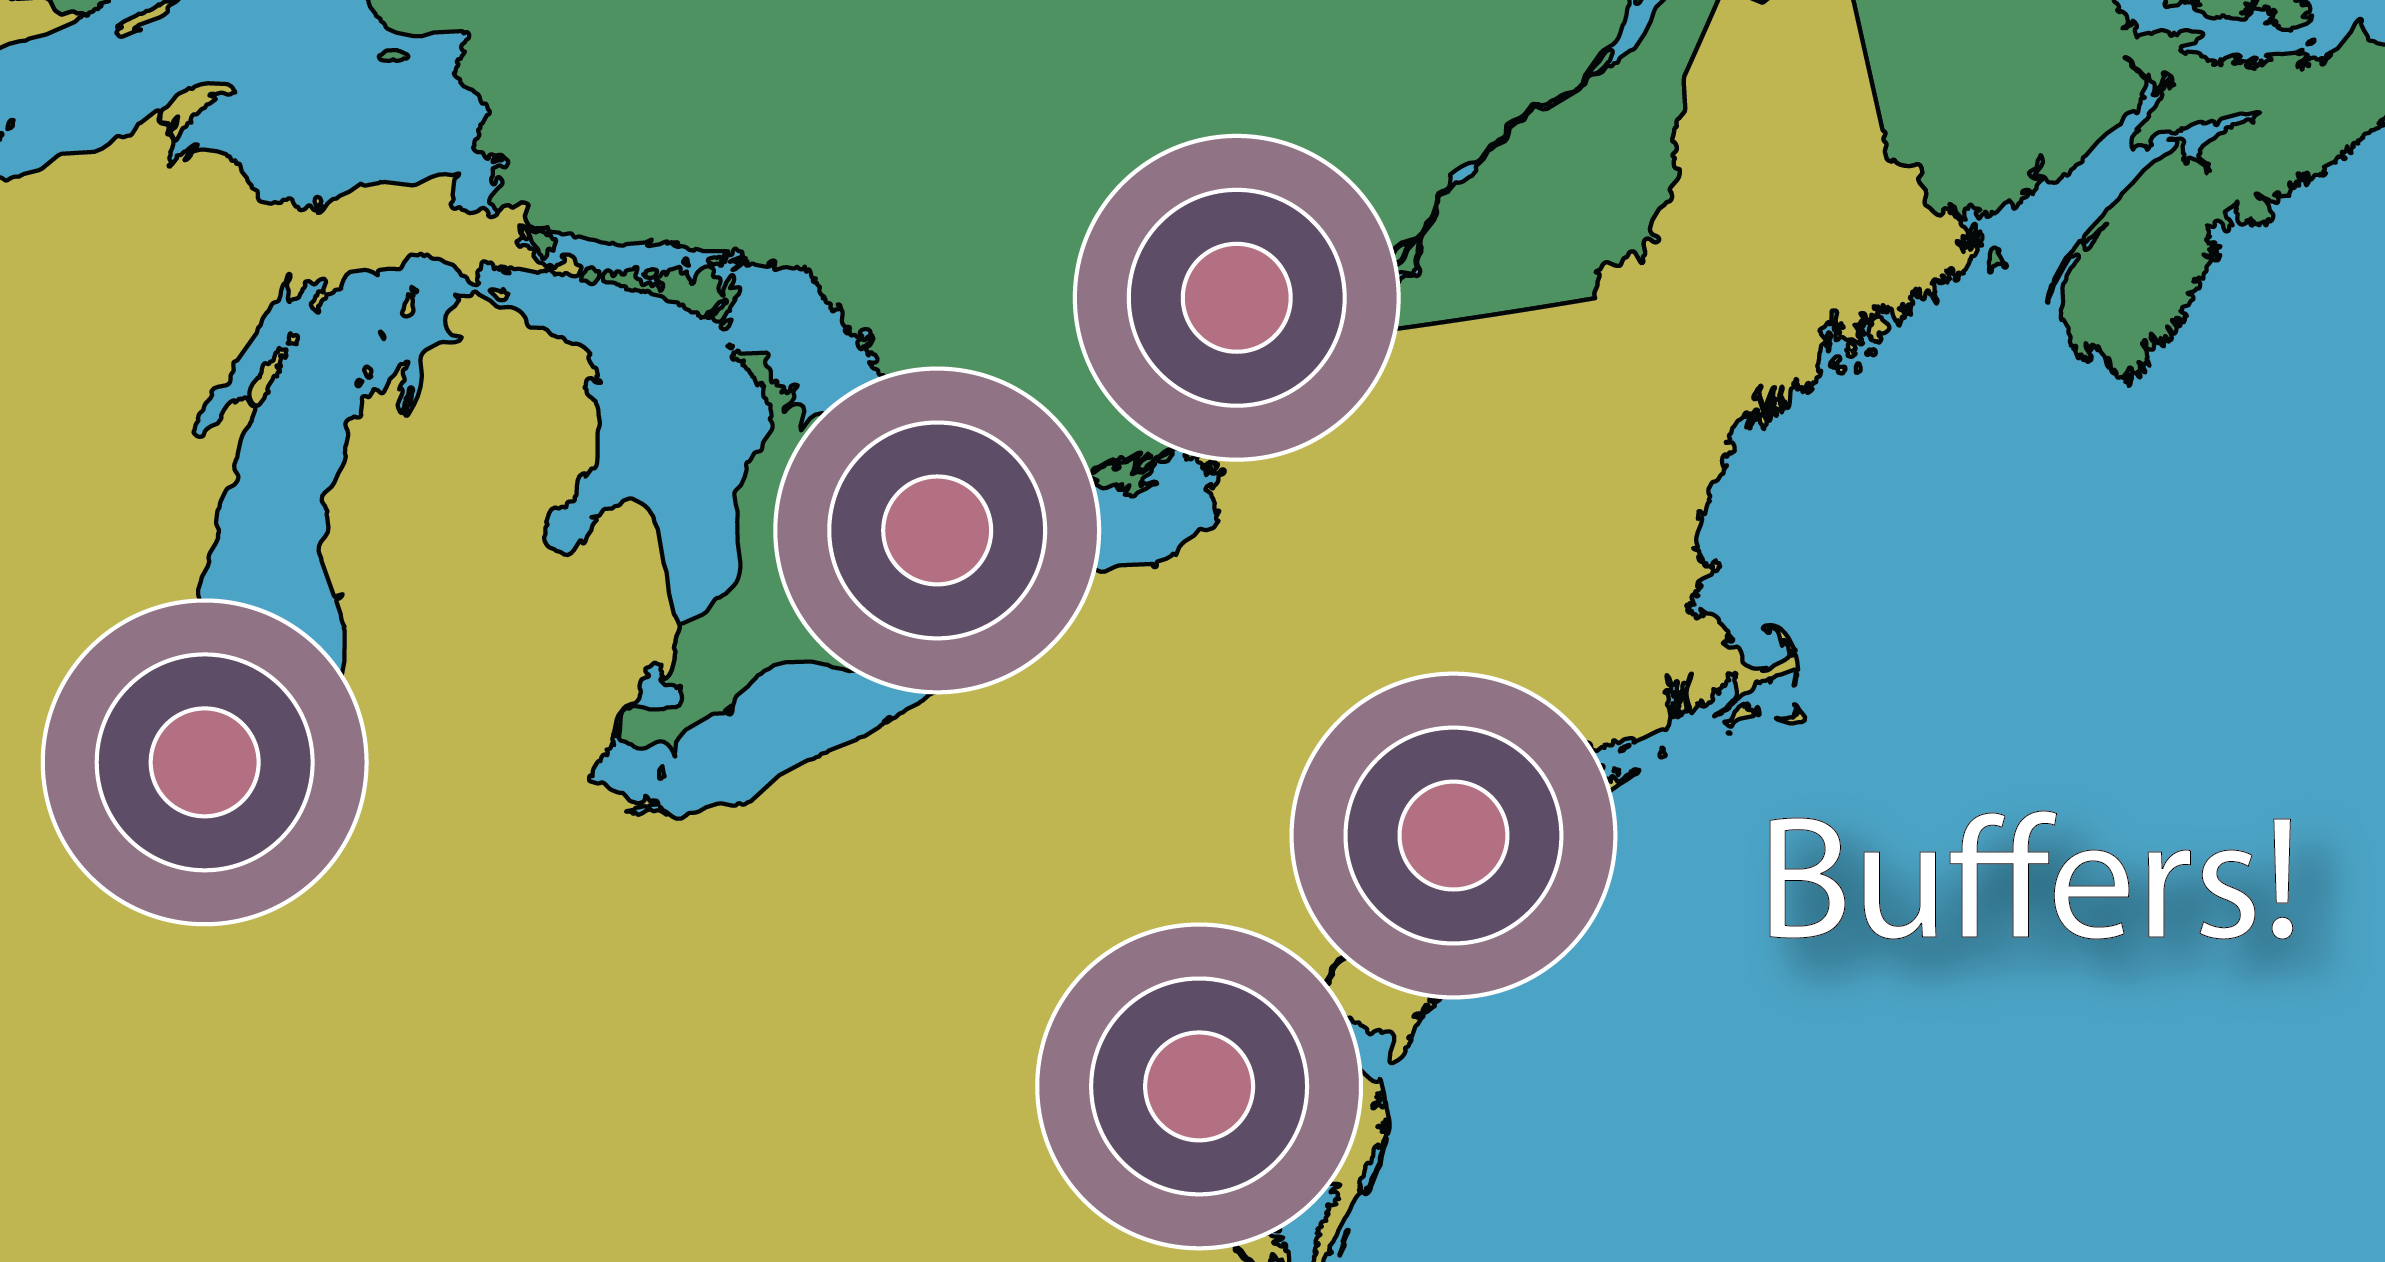
A buffer is a zone around a specific map feature, that is measured in units of time or distance. A buffer is useful for proximity analysis or visualizing the areas that are within a certain distance from another feature (i.e. within school zones, or floodplains)
6. Polygons/Areas
Enclosed Polygons on a map are often referred to as areas. Polygons can have attributes associated with them to represent a particular real-world entity such as postal code, economic identifiers, population demographics, environmental factors, or social behaviors.
The image above depicts areas on a map.
7. Coordinate systems
The planet is not flat, however, we routinely try to represent it in 2 dimensions on paper and screens. The Coordinate systems act as a reference framework that helps position features in order to make a map more useful for the purpose desired.
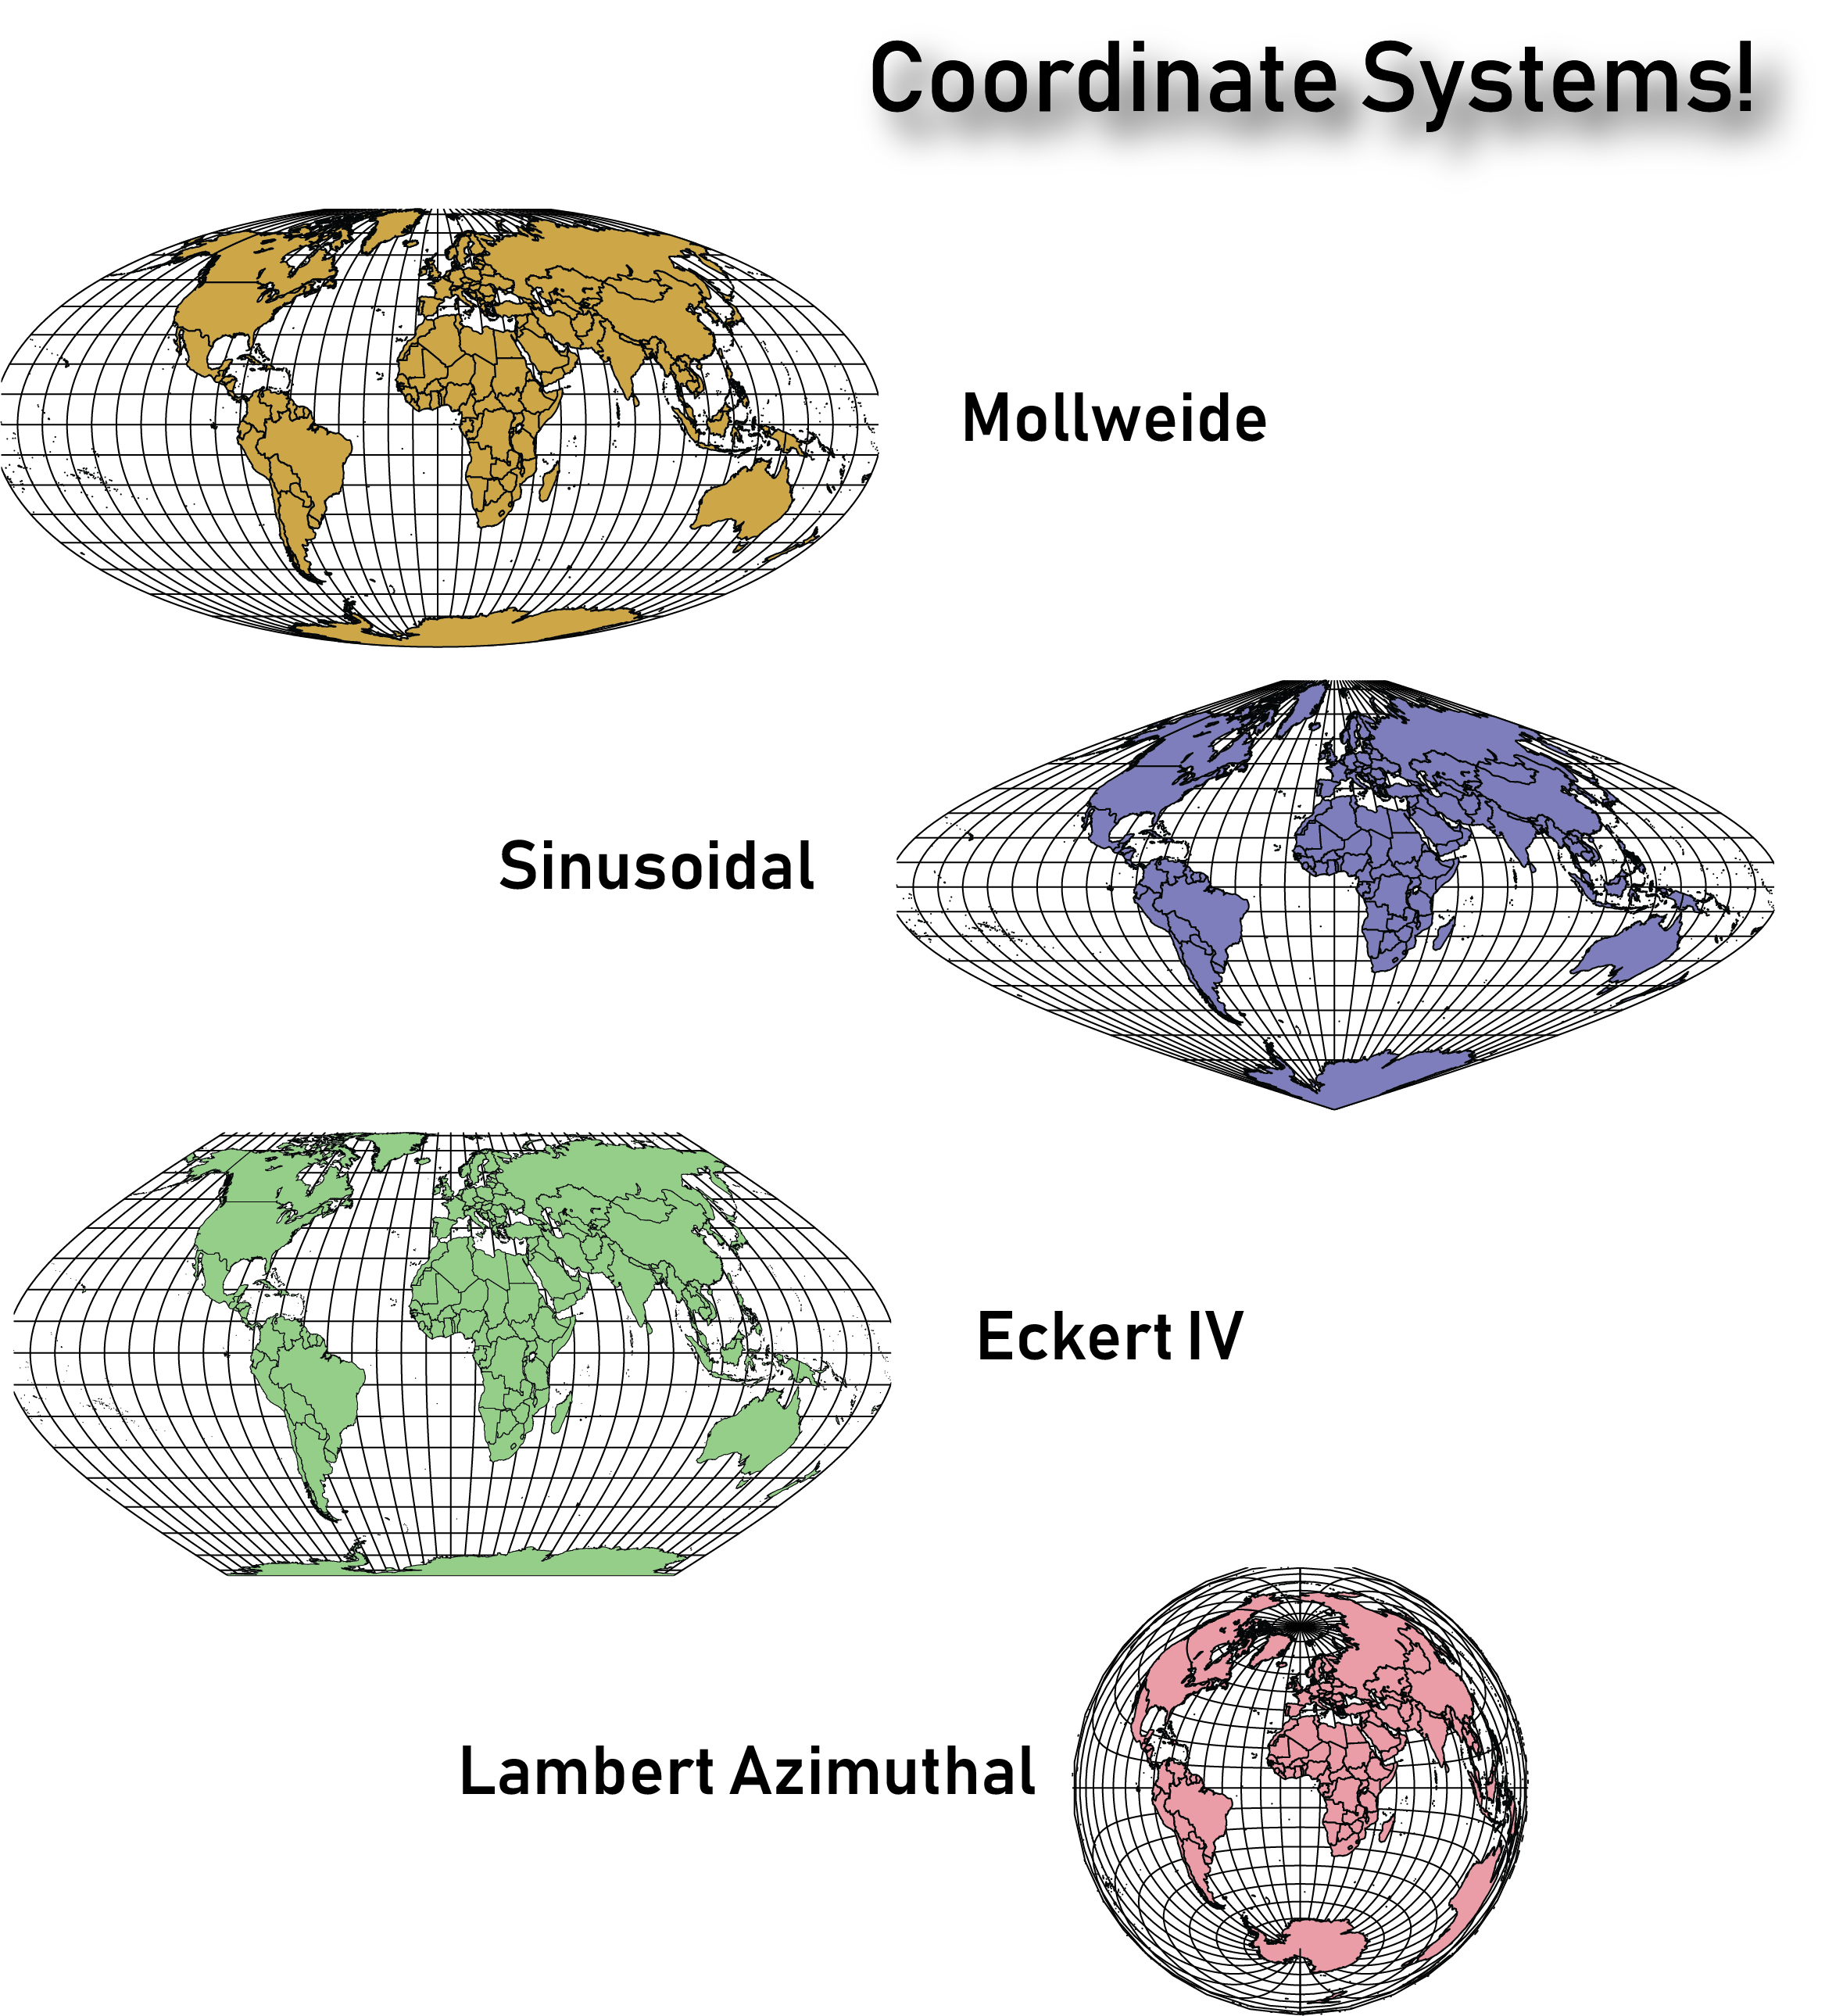
It is important to note that there are thousands of coordinate systems, so it’s important to take the time to figure out which would work best for the type of map you intend on creating. Sometimes you’ll need to change the coordinate system from the one defined in the underlying map data, to help the map make more sense to the end-user.
They say an artist is one who gives people something they didn’t know they were missing. If you happen to be an artist or know an artist (graphic designer) who seeks to give people direction – literally ‘direction’ – you’ve landed in the right place. Go ahead and share this article with like-minded map enthusiasts to begin learning and delivering high-quality maps the easy way.