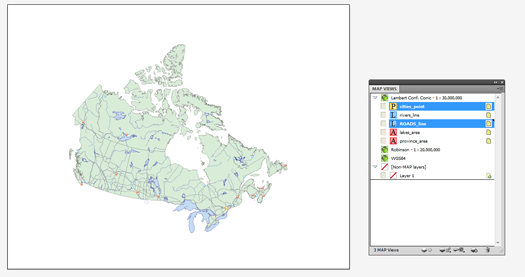
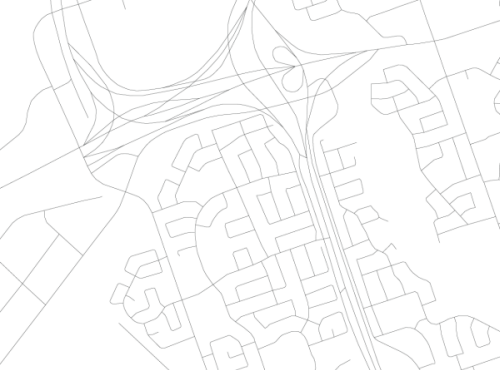
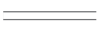
Here’s a question we receive at Avenza support quite often: I’ve located and imported a GIS layer of road lines with attributes for the city I’m mapping. How can I turn this:
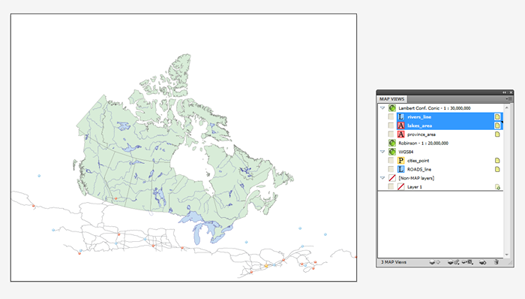
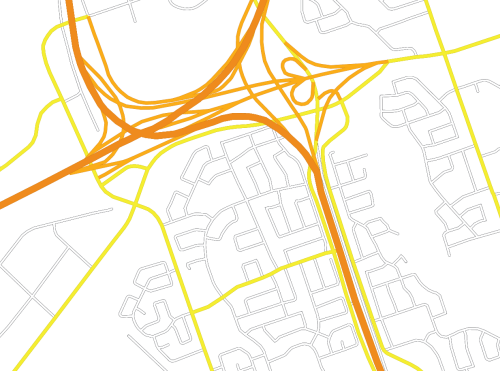
into this:
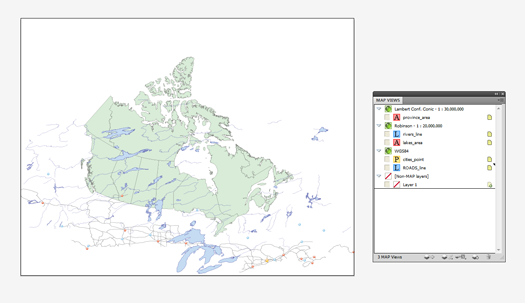
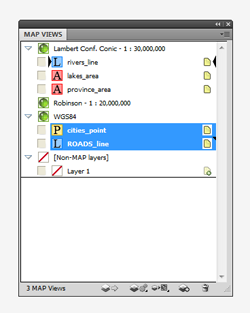
Getting Started
The workflow for this process involves the use of both MAPublisher and Adobe tools, specifically MAP Stylesheets and MAP Selections along with Illustrator’s Graphic Styles and the Appearance Panel.
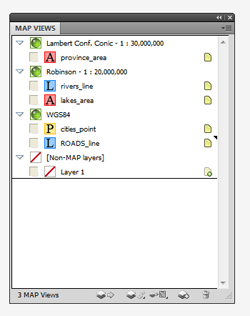
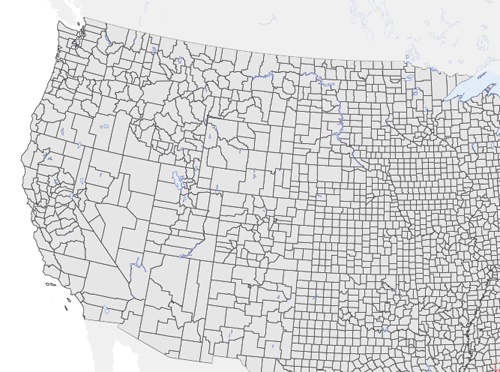
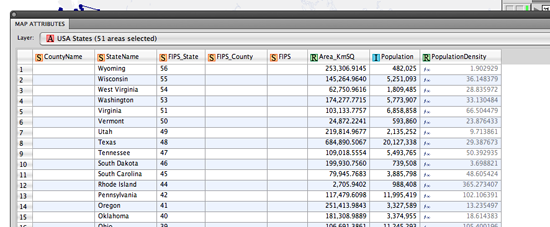
This process works on roads that have an attribute on which you can base classification rules. My road data has a column named “CLASS” with four categories: Controlled, Controlled-Ramp, Highway, and Street. I’ve created a graphic style for each and loaded them using “Open Graphic Style Library”. I keep the road styles I have created in a template document titled RoadStyles.ai so that I can import the graphic styles I need into whatever map I’m making from my template (see Adobe Graphic Styles Help).
| Controlled Access Highway: |
 |
| Controlled Access Ramp: |
 |
| Major Road: |
 |
| Minor Road: |
 |
These styles all have been created using the Illustrator Apprearance panel to overlay two strokes, the top stroke with a smaller weight and different colour than the bottom stroke (see Adobe Appearance Panel Help).
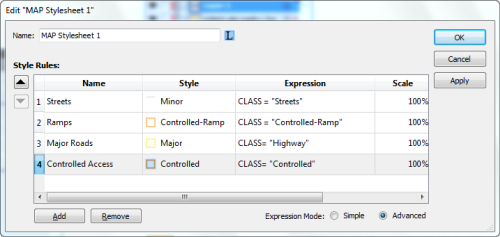
With our graphic styles set I can now apply the MAP Stylesheet I built using the following expressions:
Cleaning up with groups
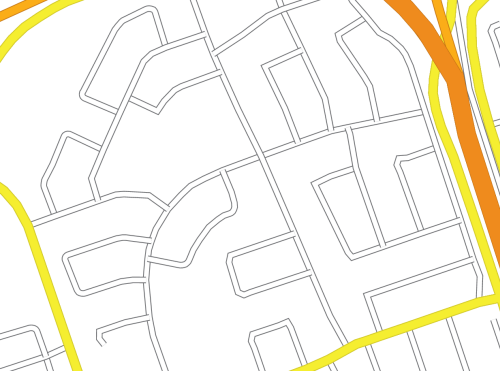
Once we apply these styles using MAPublisher Stylesheets, we will see what steps we muys take to get the appearance we want. Our roads look like this:
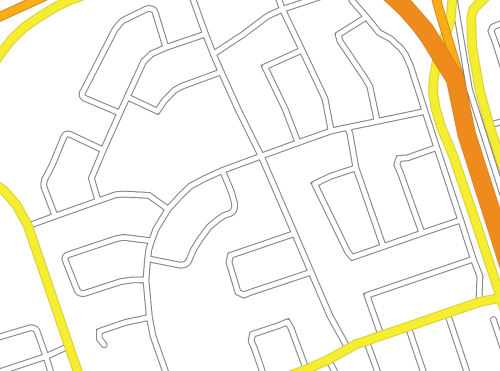
but we want them to look like this:
Why does this happen?
This occurs because MAP Stylesheets applies graphic styles at the path level. To look like intersections, each road classification must become one object, whether by being grouped or by turning the various paths into a compound path. Grouping is the preferred method for managing these objects since a compund path will delete the attributes of all paths that are being compounded. In this case, the street names field would be blank for our compound path object as dozens of streets are turned into one compund path. The consequence of this would be to make automatic labelling with MAPublisher Label Pro impossible. A set of paths turned into a group will not have their attributes available to MAPublisher while in a group, however these objects can always be ungrouped making individual paths and their original attributes available again.
Grouping Objects
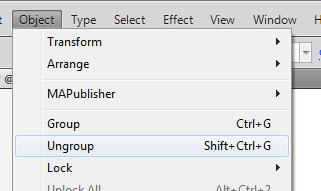
In order to group our road classes we will have to select the road paths belonging to each class. The expressions we created when defining our MAP Stylesheet rules are available to us to use again through the Expression Library (new in MAPublisher 8.3). We can use MAP Selections to individually select each of our road classes. Once selected the street classes can be grouped using CTRL+G on your keyboard or Object > Group from the menu (See Adobe Group Help). The final step is to re-apply the graphic style appropriate to each group using the Adobe Graphic Style panel.
If we want to get technical here in considering what has happend to our artwork, using the Appearance panel we can see that each of the paths we initially imported now has a graphic style applied to it on two levels: at the path level (done through MAP Stylesheets) and at the group level (done by grouping and applying a graphic style to the group). It is possible to symbolize our artwork even further, at the layer level, by slecting the target symbol for our roads layer (See Adobe Layers Help). If desired we could apply a transparency at the layer level that would supersede all graphic styles used on objects in the layer. Our artwork will now have symbolization that suggests intersections, giving our road map a much neater appearance.
Tweaking
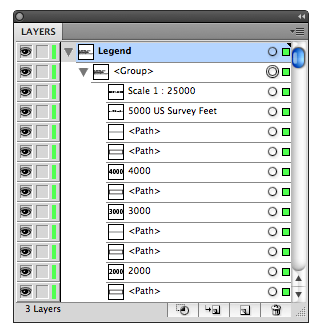
Now that our roads are grouped together, they are much easier to manage in the Illustrator Layers panel.
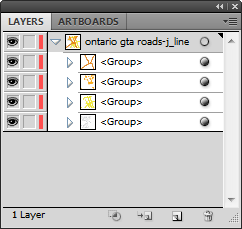
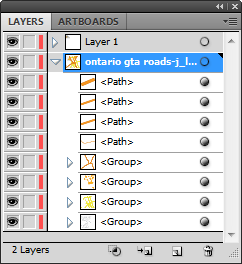
Groups can be stacked easily. My preference is to arrange with minor roads at the bottom, increasing to multi-laned divided highways at the top of the hierarchy. With our objects grouped it is easy to move objects between groups. Any path can be selected using the Direct Selection Tool and dragged in the Layers panel between groups. This is much simplier than having to use the Appearance panel to strip the path of both graphic styles and apply the desired style. There will be some situations where we will need to override the intersection appearances that result from grouping. In this image we have onramps that definitely do not interesect as this line work suggests!

To do this we must select the road lines that will be on top of the intersection, and using the Illustrator Layers panel, drag them from their group (it does not matter where in the layer hierarchy the are placed).
Our ungrouped ramps can now be sent backwards and forwards relative to other paths, giving a truer representation of the road network:

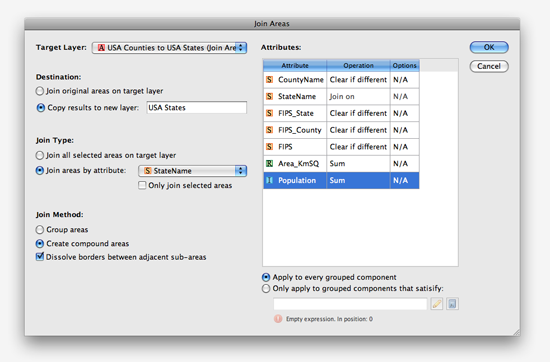
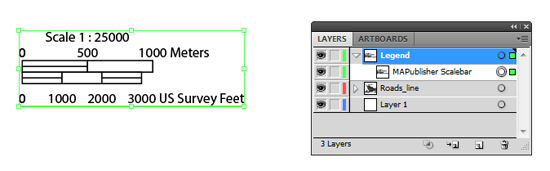
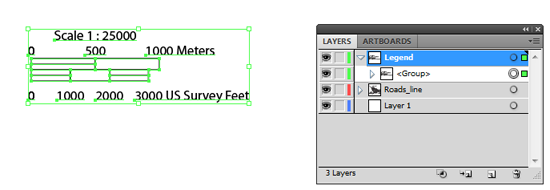
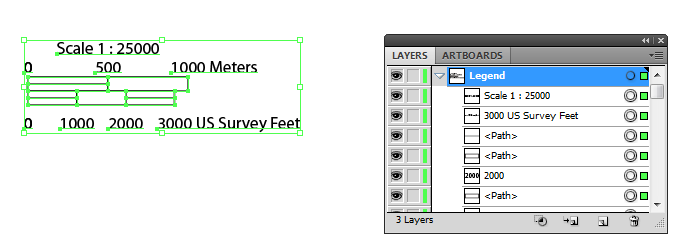
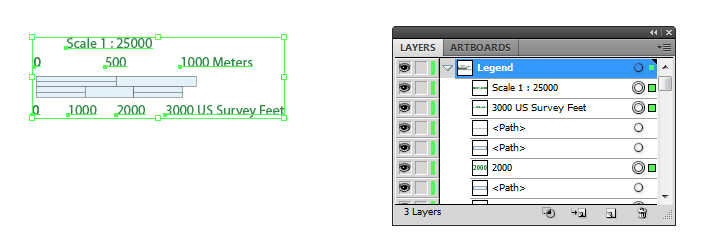
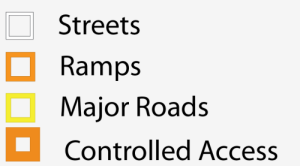
Using MAP Stylesheets to create a Legend
So why use stylesheets if we must manually group the objects after use? For a few reasons: it keeps us organized, it adds the expressions to the expression library, and most importantly MAP Stylesheets can automatically generate a Legend for us that reflects our Stylesheet rule names:
Good luck creating customized road styles! A deeper understanding of the Illustrator object styling hierarchy can go a long way in helping you use MAPublisher to leverage your GIS datasets!