


Welcome back to another edition of Mapping Class! The Mapping Class tutorial series curates demonstrations and workflows created by professional cartographers and expert Avenza software users. Today we have Steve Spindler, a longtime MAPublisher user, and expert cartographer. Steve has put together a 15-minute masterclass on creating maps from start to finish using templates and stylesheets. This video is jam-packed with useful tips and tricks that show how Steve uses templates, stylesheets, and a host of MAPublisher tools to design a beautiful map in minutes.
Steve has produced a video to show the complete, un-cut, map-making process. The Avenza team has produced video notes (below) to help you follow along.
***
Efficient Map-making using Templates and Stylesheets
by Steve Spindler (video notes by the Avenza team)
Readers of the Avenza resources blog will recognize Steve Spindler as a recent feature of our Cartographer Chronicles spotlight article. Steve has also been a frequent contributor to the Mapping Class blog series, where he has shared his tips for using MAPublisher to make eye-catching maps. Some of his recent contributions cover his techniques for using attribute expressions to edit street labels and working with OSM data in MAPublisher.
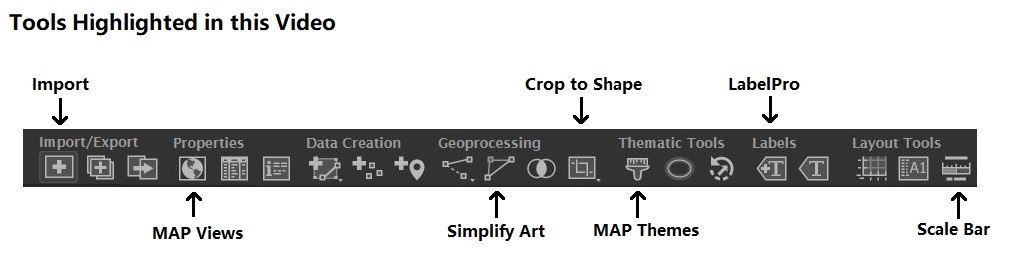
Today, Steve is doing something a little different. Instead of focusing on a specific tool or technique, he has put together a complete 15-minute masterclass showing how he creates a map from start to finish. In this uncut demonstration, Steve discusses his tips for importing data, using MAP views, applying stylesheets, and even labelling. Steve shows how using templates and preconfigured MAP themes can make map creation a breeze.
Using a Template
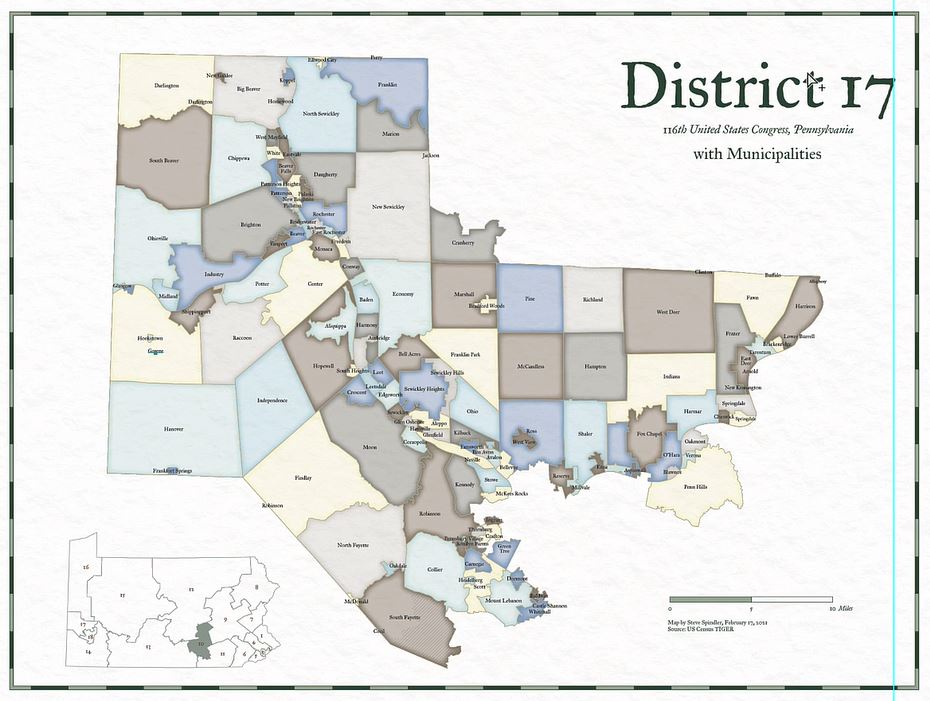
In this demonstration, Steve will be creating a congressional district map showing the municipalities of Pennsylvania District 17. Steve discusses how using a template to create your map can significantly improve the speed of map creation. Templates can be used to configure standardized design elements that can be recycled across several different map projects. Templates are especially useful in situations where different maps form part of a series with shared design components and colour schemes.
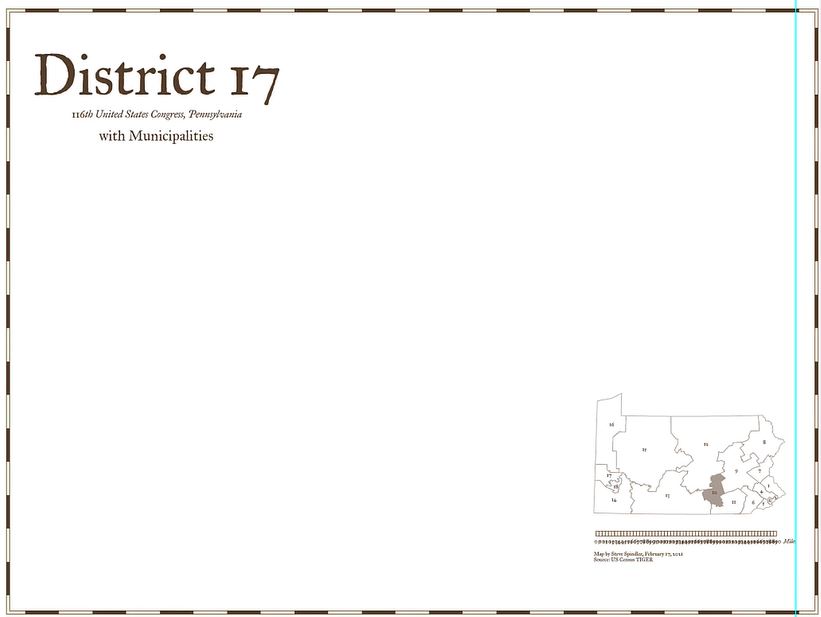
For this tutorial, Steve uses a template that includes some basic stylistic elements he typically includes in all his congressional district maps. The template comes preloaded with custom borders, Titles, subtitles, an inset map, and a scale bar. His template is already configured with custom fonts and colours that will give some uniformity across his different map projects.
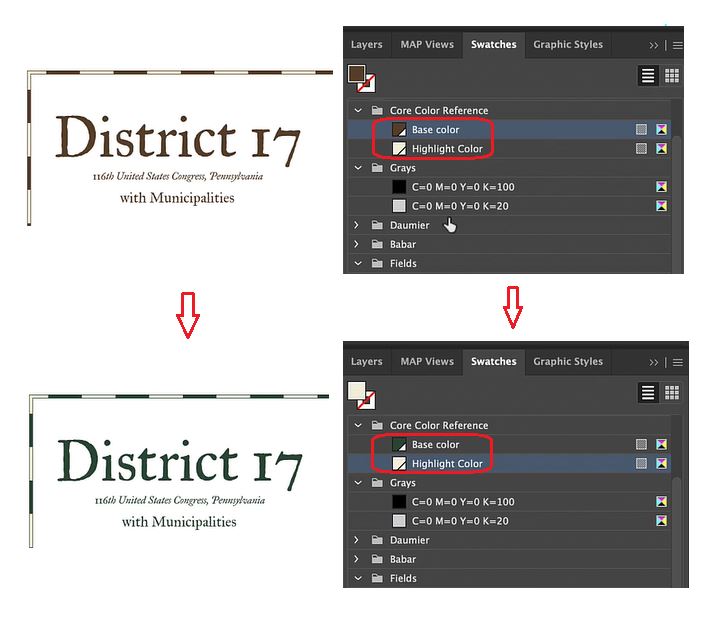
Steve has also set up swatch groups for his template. This ensures each map created with the template uses the same colour groups. Setting up swatches in the template also makes it easy to swap out or change the colour of different map elements. As an example, Steve uses the drag and drop functionality of the swatch panel to automatically adjust the “core colours” of his map template (text, border, and scale bar colours) from brown to green.
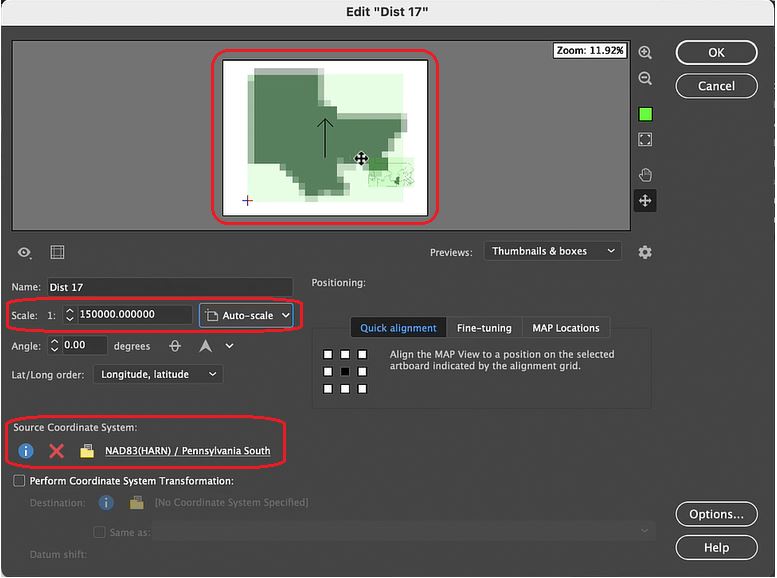
Steve’s template comes preloaded with an inset map containing all the congressional district boundaries for Pennsylvania. Using the drag-and-drop functionality of MAP Views, he can place a “District 17” data layer into a new MAP View that will contain the main body of his map project. Using the MAP View editor, Steve can assign a custom scale and choose an appropriate projection. This will ensure any new data layers he brings into the MAP view will be correctly aligned and accurately projected.
Import and Prepare the Map Data
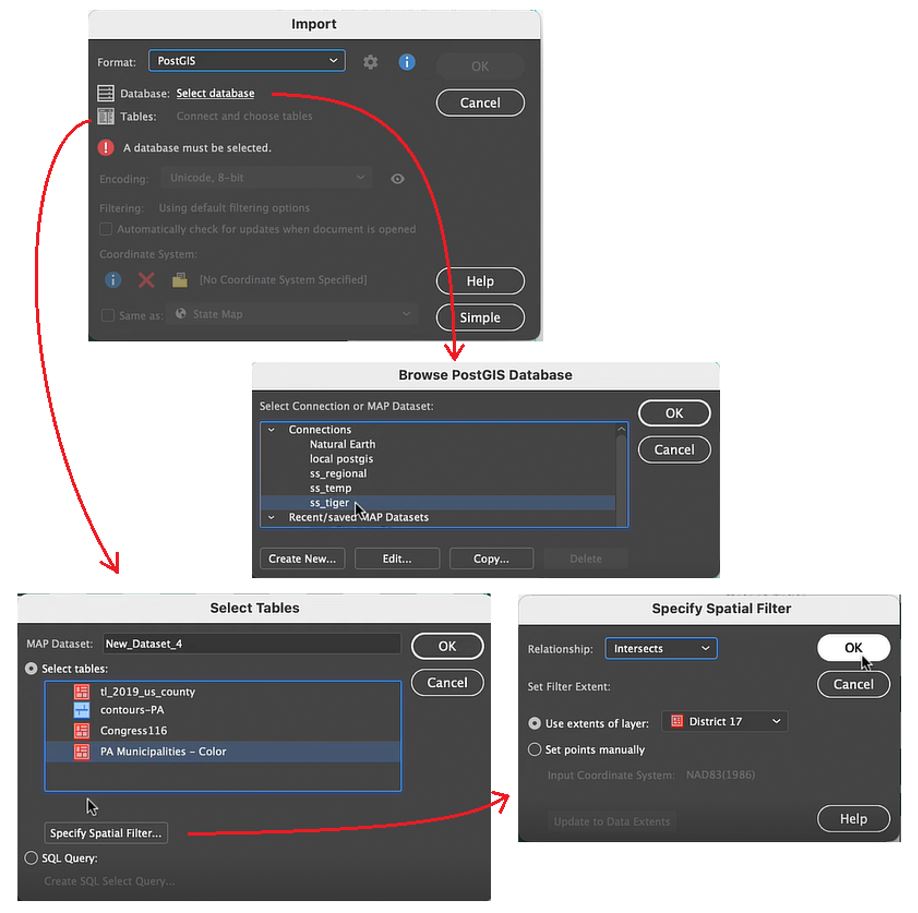
With his template configured, Steve now brings in some new data. He wants to access municipal boundary polygon data found on a PostGIS database stored locally. You can specify the specific data table within the database he wishes to add using the Import tool. More importantly, shows how he uses spatial filtering options to specify the region of interest. The spatial filter means that only the data relevant to the map extent is loaded in (very useful when using large datasets).
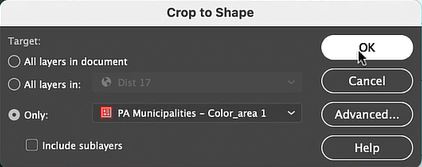
Using the Crop to Shape tool, Steve cleans up the imported data layer by removing any polygons that fall outside his district boundaries. Next, he uses the Simplify tool to remove extraneous vertices, with that his data is ready for stylization!
Apply Styles with MAP Themes
MAP themes are one of the most powerful tools in the MAPublisher toolset. MAP Themes allow you to configure rules-based stylesheets that work with attribute information stored in map data layers. Using pre-coded attribute values in his municipal boundary layer, Steve can assign colour fills to each municipality. Using colour in this way is a bit more eye-catching than using generic boundary lines, and makes it easy to see the shapes of each municipality.
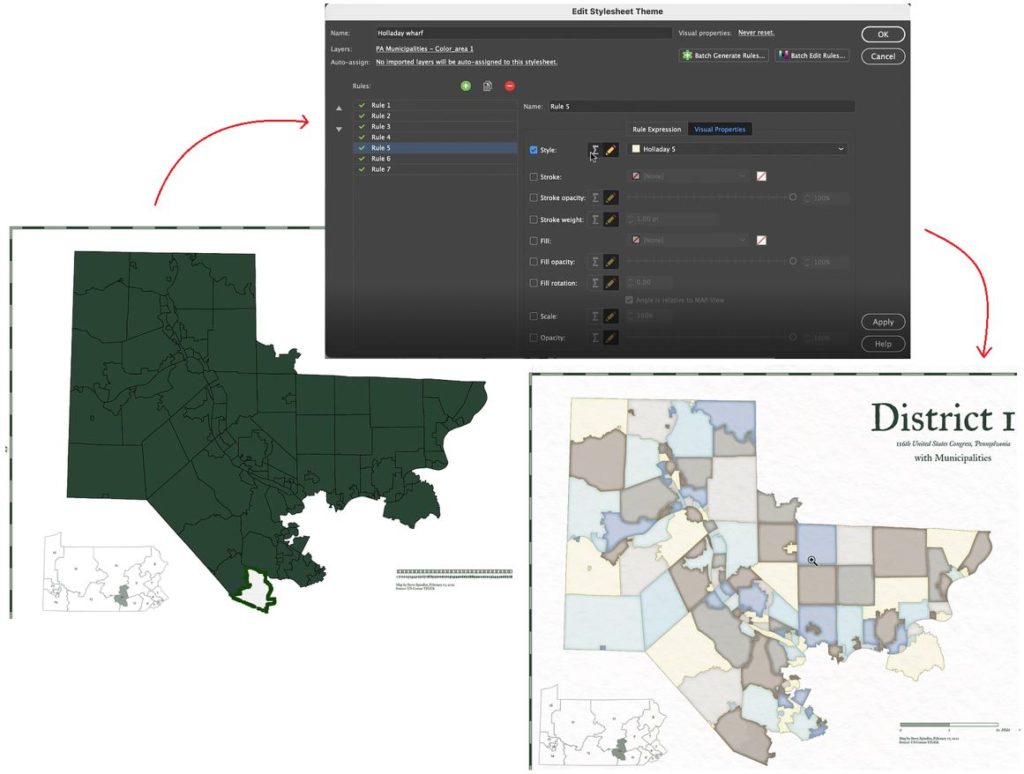
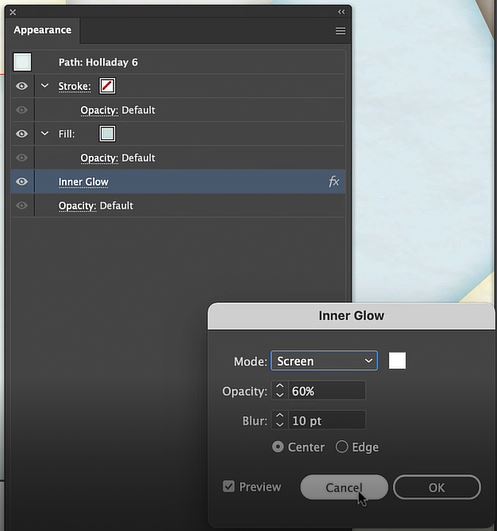
MAP Themes can not only set the stroke and fill for each polygon, but also apply graphic style effects such as “inner glow” to give each shape a more defined appearance. Since MAP Themes are entirely rules-based, it’s easy to modify and apply styles across the entire map without needing to adjust appearance settings for each vector layer individually.
Labels and Details
With his MAP Themes applied, Steve needs to finalize the scale bar that appears in the bottom right corner of the map. Since the template he uses comes pre-configured with a MAPublisher cale bar, it’s only a matter of dragging and dropping the scale bar layer into the appropriate MAP View. If you recall from earlier, Steve set up this new map-view with its own map scale and projection, meaning the scale bar will automatically be adjusted to fit the map data once it is placed in the new MAP view, creating an accurate and informative scale for viewers.
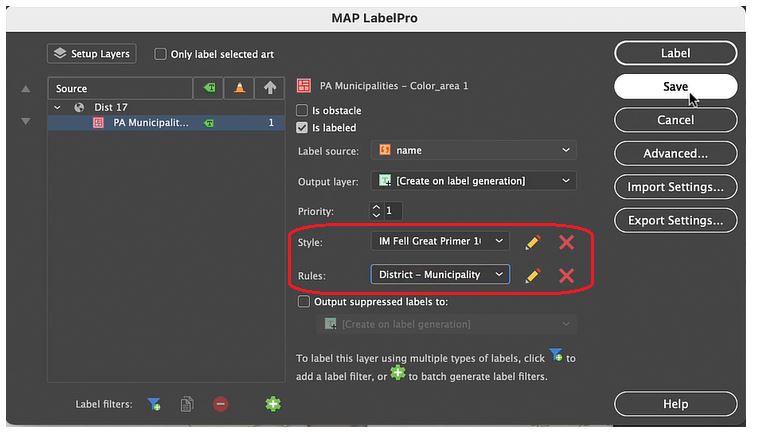
Lastly, Steve uses the MAPublisher LabelPro add-on to apply labels to each of the municipalities in his map. Similar to MAP Themes, the LabelPro tool allows Steve to configure rules-based label layers that manage label placement and style. The labelling engine ensures that labels are placed to avoid collisions, eliminate label overlap, and reduce label clutter. Finishing the map with a few minor touch-ups and voila!, Steve has finished his Pennsylvania District 17 Map in less than 15 minutes!
***
About the Author
Steve Spindler has been designing compelling cartographic pieces for over 20 years. His company, Steve Spindler Cartography, has developed map products for governments, city planning organizations, and non-profits from across the country. He also manages wikimapping.com, a public engagement tool that allows city planners to connect and receive input from their community using maps. To learn more about Steve Spindler’s spectacular cartography work, visit his personal website. To view Steve’s other mapping demonstrations, visit cartographyclass.com