My Account     Contact Us     Cart

Stylizing Road Layers with MAPublisher and Adobe Illustrator

An important component of any map that contains roads is the stylization of such roads, and ensuring that the end user can understand the way they are displayed. To go even further, it may also be important for the user to be able to differentiate between the various road classifications they are viewing. 

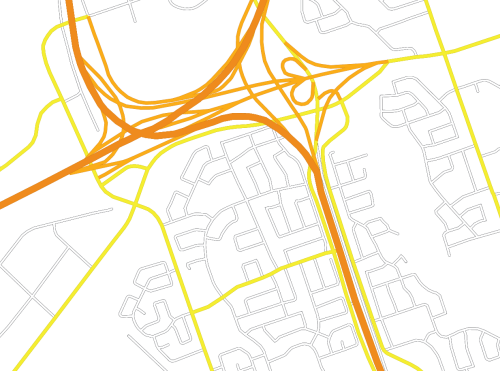
When a line layer containing road data is first imported into MAPublisher, all roads appear with the same appearance regardless of their class or type. However, with the help of MAPublisher and some native Illustrator tools, you can easily turn your roads from this:
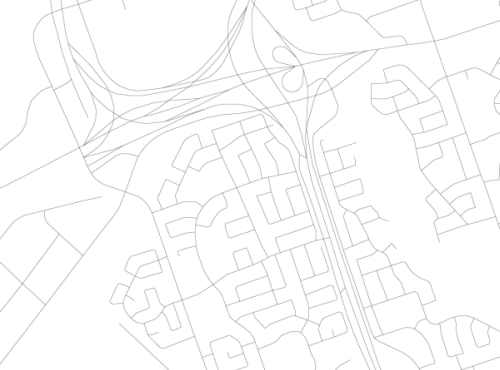
…into this:

Getting Started

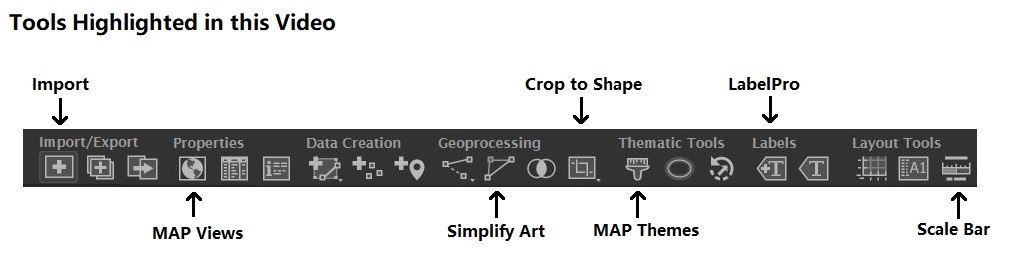
As stated above, this workflow uses tools from both Adobe Illustrator’s native toolbar as well as the MAPublisher extension. More specifically, MAP Stylesheet Themes and MAP Selections along with the Graphic Styles and Appearance panels. 

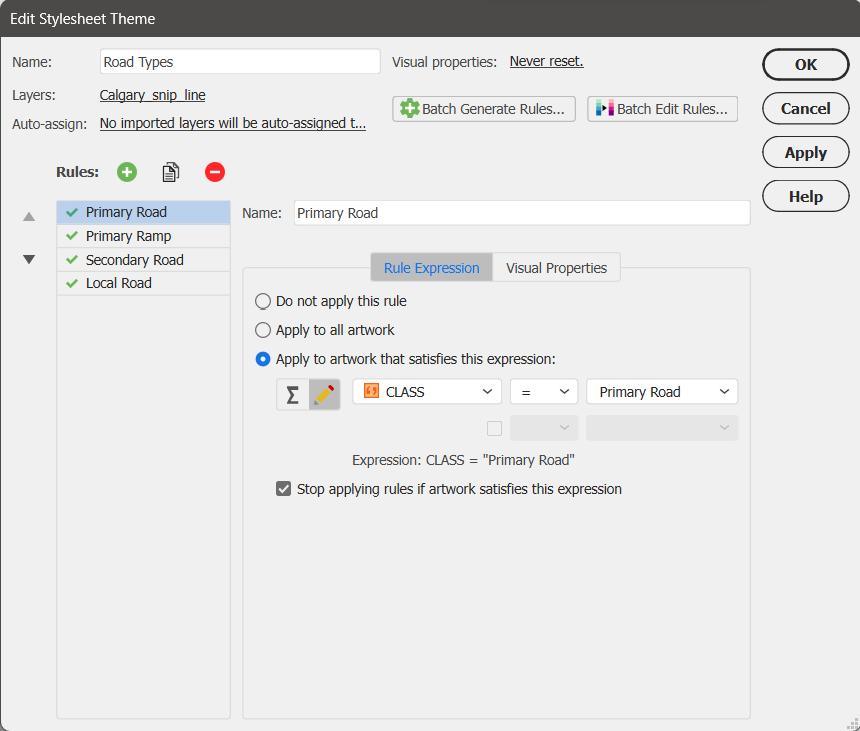
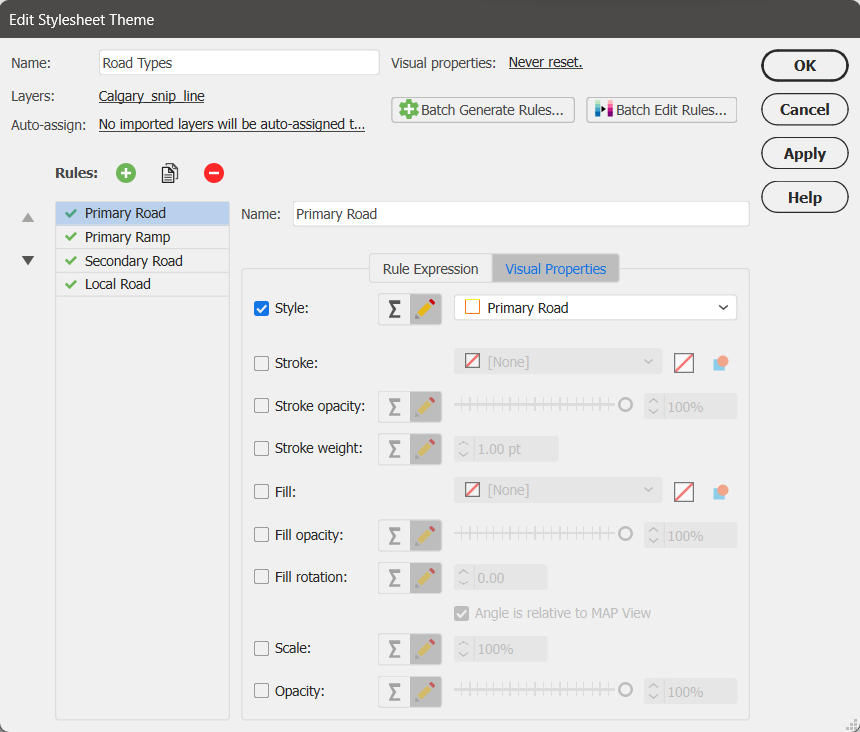
This process will only work if your road data contains an attribute on which you can base classification rules. For example, my road data has an attribute column named “CLASS” with four categories: Primary Road, Primary Ramp, Secondary Road, and Local Road. I have previously created a graphic style for each road type and saved them in a template document titled RoadStyles.ai. In my current document, I have simply imported these styles to the Graphic Styles panel by using the menu option for “Open Graphic Style Library”. For more information about the Graphic Styles panel, check out its Adobe help page.

Controlled Access Highway: Controlled Access Highway
Controlled Access Ramp: Controlled Access Ramp
Major Road: Major Road
Minor Road: Minor Road

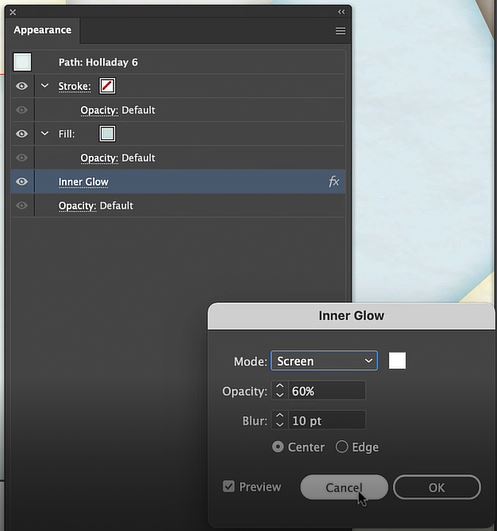
These styles have all been created using the Appearance panel to overlay a stroke with a smaller weight over a stroke with a larger weight of a different colour. These road styles are usually referred to as cased roads. For information about the Appearance panel, check out its Adobe help page.

Now that the graphic styles have been created/imported, I can apply a MAP Stylesheet Theme I have created based on the road types.

Cleaning Up with Groups

Now that the main styles have been applied to each road class, we must perform a few more steps to perfect the appearance of our roads. If you zoom in closely on the roads you may notice that intersecting roads do not appear as seamless as you would like. Don’t worry; there is a way to transform your roads from looking like this:

…to this:

Why does this happen? 

This occurs because MAP Stylesheet Themes apply the graphic styles at the path level. To look like intersections, each road classification must become one object, whether by being grouped or by turning the various paths into a compound path. Grouping is the preferred method for managing these objects since a compound path will delete the attributes of all paths that are being compounded. For example, if I turned my road types into compound paths, the street names would be turned blank. This would make automatic labeling with MAPublisher LabelPro impossible. Regardless, using groups instead of compound paths will avoid this issue, as grouped objects retain their original attributes.

Grouping Road Classes

In order to group our road classes we will have to select the road paths belonging to each class. We can use MAP Selections to individually select each of our road classes. The expressions we created when defining our MAP Stylesheet Theme rules can be saved as Named Expressions to be used again through the Expression Library. Once selected the street classes can be grouped using CTRL+G on your keyboard, right-clicking and selecting “Group” or selecting Object > Group from the menu. The final step is to re-apply the graphic style appropriate to each group using the Adobe Graphic Style panel.

If we want to get technical here regarding what has happened to our artwork, using the Appearance panel we can see that each of the paths we initially imported now has a graphic style applied to it on two levels: at the path level (done through MAP Stylesheets) and at the group level (done by grouping and applying a graphic style to the group). It is possible to symbolize our artwork even further, at the layer level, by selecting the target icon for our roads layer. If desired we could apply a transparency at the layer level that would supersede all graphic styles used on objects in the layer. 

Our artwork now has symbolization that suggests intersections, giving our road map a much neater appearance.

Finishing Touches

Now that our roads are grouped together, they are much easier to manage in the Illustrator layers panel.

Groups can be easily arranged using the Layers panel. Many cartographers prefer to arrange their roads with major highways at the top and descending to reach local roads at the bottom of the hierarchy. Groups also make it easier to move objects between groups if necessary: simply select the path in the Layers panel and drag it to another group. 

With our groups, we can now apply some tweaks to finish off their appearance. There will be many instances where we will need to override the intersection appearances that result from grouping. For example, in the image below we have ramps that definitely do not intersect as suggested by their grouping.

To correct this error, we can select the road lines that will pass over the others and, using the Layers panel, drag the paths from their group. This will eliminate the implication on the map that these roads actually intersect.

The ungrouped roads can now be arranged relative to the other paths until we find a layout that is the truest representation of the road network.

Using MAP Stylesheet Themes to Create a Legend

So why do we use MAP Stylesheet Themes if we must manually group the objects again after use? For a few reasons: it keeps us organized, it allows us to add the Named Expressions to the Expression Library, and most importantly, we can use these MAP Stylesheet Themes to automatically generate a Legend for us that reflects our Stylesheet rule names.

A deeper understanding of the Adobe Illustrator toolbox can go a long way in helping you use MAPublisher to leverage the full potential of your GIS datasets to create customized road styles. Happy mapping!

Be sure to check out our tutorial for Creating Line Stylesheet Themes as well as the video tutorial. This tutorial also includes the instructions for creating cased roads!

Mapping Class: Efficient Map-making using Templates and Stylesheets, with Steve Spindler

Welcome back to another edition of Mapping Class! The Mapping Class tutorial series curates demonstrations and workflows created by professional cartographers and expert Avenza software users. Today we have Steve Spindler, a longtime MAPublisher user, and expert cartographer. Steve has put together a 15-minute masterclass on creating maps from start to finish using templates and stylesheets. This video is jam-packed with useful tips and tricks that show how Steve uses templates, stylesheets, and a host of MAPublisher tools to design a beautiful map in minutes.

Steve has produced a video to show the complete, un-cut, map-making process. The Avenza team has produced video notes (below) to help you follow along.

***

Efficient Map-making using Templates and Stylesheets
by Steve Spindler (video notes by the Avenza team)

Readers of the Avenza resources blog will recognize Steve Spindler as a recent feature of our Cartographer Chronicles spotlight article. Steve has also been a frequent contributor to the Mapping Class blog series, where he has shared his tips for using MAPublisher to make eye-catching maps. Some of his recent contributions cover his techniques for using attribute expressions to edit street labels and working with OSM data in MAPublisher

Today, Steve is doing something a little different. Instead of focusing on a specific tool or technique, he has put together a complete 15-minute masterclass showing how he creates a map from start to finish. In this uncut demonstration, Steve discusses his tips for importing data, using MAP views, applying stylesheets, and even labelling. Steve shows how using templates and preconfigured MAP themes can make map creation a breeze.

Using a Template

In this demonstration, Steve will be creating a congressional district map showing the municipalities of Pennsylvania District 17. Steve discusses how using a template to create your map can significantly improve the speed of map creation. Templates can be used to configure standardized design elements that can be recycled across several different map projects. Templates are especially useful in situations where different maps form part of a series with shared design components and colour schemes.

For this tutorial, Steve uses a template that includes some basic stylistic elements he typically includes in all his congressional district maps. The template comes preloaded with custom borders, Titles, subtitles, an inset map, and a scale bar. His template is already configured with custom fonts and colours that will give some uniformity across his different map projects.

Steve has also set up swatch groups for his template. This ensures each map created with the template uses the same colour groups. Setting up swatches in the template also makes it easy to swap out or change the colour of different map elements. As an example, Steve uses the drag and drop functionality of the swatch panel to automatically adjust the “core colours” of his map template (text, border, and scale bar colours) from brown to green. 

Steve’s template comes preloaded with an inset map containing all the congressional district boundaries for Pennsylvania. Using the drag-and-drop functionality of MAP Views, he can place a “District 17” data layer into a new MAP View that will contain the main body of his map project. Using the MAP View editor, Steve can assign a custom scale and choose an appropriate projection. This will ensure any new data layers he brings into the MAP view will be correctly aligned and accurately projected. 

Import and Prepare the Map Data

With his template configured, Steve now brings in some new data. He wants to access municipal boundary polygon data found on a PostGIS database stored locally. You can specify the specific data table within the database he wishes to add using the Import tool. More importantly, shows how he uses spatial filtering options to specify the region of interest. The spatial filter means that only the data relevant to the map extent is loaded in (very useful when using large datasets).

Using the Crop to Shape tool, Steve cleans up the imported data layer by removing any polygons that fall outside his district boundaries. Next, he uses the Simplify tool to remove extraneous vertices, with that his data is ready for stylization!

Apply Styles with MAP Themes

MAP themes are one of the most powerful tools in the MAPublisher toolset. MAP Themes allow you to configure rules-based stylesheets that work with attribute information stored in map data layers. Using pre-coded attribute values in his municipal boundary layer, Steve can assign colour fills to each municipality. Using colour in this way is a bit more eye-catching than using generic boundary lines, and makes it easy to see the shapes of each municipality.

MAP Themes can not only set the stroke and fill for each polygon, but also apply graphic style effects such as “inner glow” to give each shape a more defined appearance. Since MAP Themes are entirely rules-based, it’s easy to modify and apply styles across the entire map without needing to adjust appearance settings for each vector layer individually. 

Labels and Details

With his MAP Themes applied, Steve needs to finalize the scale bar that appears in the bottom right corner of the map. Since the template he uses comes pre-configured with a MAPublisher cale bar, it’s only a matter of dragging and dropping the scale bar layer into the appropriate MAP View. If you recall from earlier, Steve set up this new map-view with its own map scale and projection, meaning the scale bar will automatically be adjusted to fit the map data once it is placed in the new MAP view, creating an accurate and informative scale for viewers.

Lastly, Steve uses the MAPublisher LabelPro add-on to apply labels to each of the municipalities in his map. Similar to MAP Themes, the LabelPro tool allows Steve to configure rules-based label layers that manage label placement and style. The labelling engine ensures that labels are placed to avoid collisions, eliminate label overlap, and reduce label clutter. Finishing the map with a few minor touch-ups and voila!, Steve has finished his Pennsylvania District 17 Map in less than 15 minutes!

***

About the Author

Steve Spindler has been designing compelling cartographic pieces for over 20 years. His company, Steve Spindler Cartography, has developed map products for governments, city planning organizations, and non-profits from across the country. He also manages wikimapping.com, a public engagement tool that allows city planners to connect and receive input from their community using maps. To learn more about Steve Spindler’s spectacular cartography work, visit his personal website. To view Steve’s other mapping demonstrations, visit cartographyclass.com

How It’s Done in MAPublisher – Batch Generate Rules

MAP Themes are a great tool for stylizing your data quickly and easily. Since we all love to make our workload easier, did you know that you can batch generate rules for your MAP Theme Stylesheets instead of creating them all individually? Batch generate rules allows you to easily categorize your data and stylize it as you see fit.

Check out this short video that demonstrates how to use the batch generate rules tool in MAP Theme Stylesheets in MAPublisher!

For more How It’s Done in MAPublisher videos, check out our YouTube channel!