Whether you’re new to Avenza Maps®, an experienced user, or simply thinking about a purchase, Avenza Maps training is a worthwhile experience. Get hands-on training from Avenza product specialists at one of our training courses online virtually from anywhere.
Articles
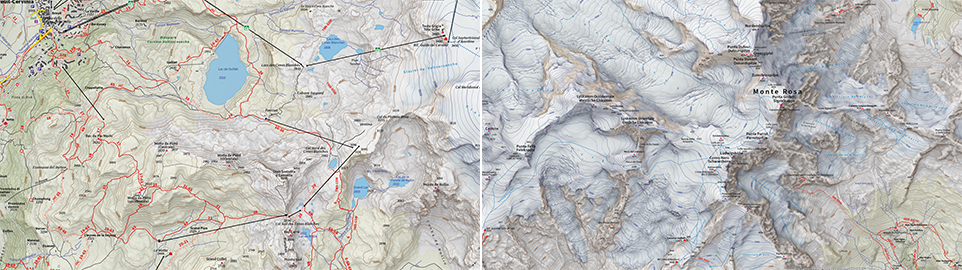
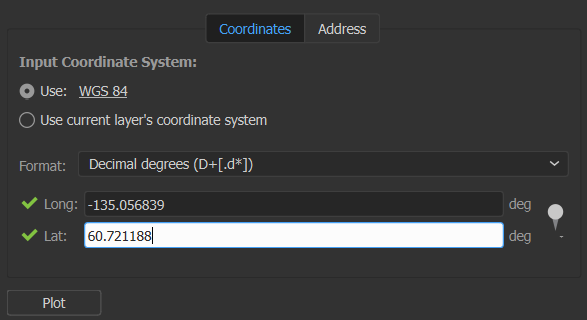
Whether you’re new to MAPublisher®, an experienced user, or simply thinking about a purchase, Avenza software training is a worthwhile experience. Get hands-on training from Avenza product specialists at one of our training courses around North America or virtually from anywhere. Whether you’re new to Avenza Maps®, an experienced user, or simply thinking about a purchase, Avenza Maps training is a worthwhile experience. Get hands-on training from Avenza product specialists at one of our training courses online virtually from anywhere. Que vous soyez un professionnel des SIG ou que vous débutiez tout juste dans le domaine, cette formation vous propose de prendre en main MAPublisher® de manière approfondie! Rejoignez nos amis de Géom@tique du 2 au 6 décembre pour cette formation en ligne! Les inscriptions et plus d’informations sont disponibles sur leur site web. Whether you’re new to GIS or an experienced user, this course will give you an in-depth introduction to MAPublisher® in French! Join our friends at Géom@tique from December 2nd to 6th for this online training! Sign ups and more information are available on their website. Whether you’re new to Avenza Maps®, an experienced user, or simply thinking about a purchase, Avenza Maps training is a worthwhile experience. Get hands-on training from Avenza product specialists at one of our training courses online virtually from anywhere. Whether you’re new to MAPublisher®, an experienced user, or simply thinking about a purchase, Avenza software training is a worthwhile experience. Get hands-on training from Avenza product specialists at one of our training courses around North America or virtually from anywhere. Avenza was founded and headquartered in Toronto, and as such, we pride ourselves on being a Canadian company with a global reach. This year we have celebrated by creating a map highlighting the names and capital cities of each province and territory of Canada using MAPublisher. This blog will detail how we quickly and easily plotted points to represent the capital cities of Canada and its provinces and territories using the MAP Point Plotter tool. Firstly, a MAP Point layer must be created and selected before opening the MAP Point Plotter tool. This is the only layer type that can be used with this tool, for obvious reasons. There are several different ways in which addresses and coordinates can be entered into the MAP Point Plotter tool. This blog will highlight a few of the common techniques. The simplest way to plot a point is by entering its address, following a specific-to-general granularity format as seen in the examples below. After opening the tool, the Address tab was selected and the following cities were plotted using MapQuest to locate these addresses: Another way to plot points is to use coordinates, by selecting the Coordinates tab. There are several different coordinate formats accepted by the MAP Point Plotter tool. We entered simple decimal degrees by selecting Decimal degrees as the format and using these coordinates: Decimal degrees with a compass direction can be entered similarly to the previous step by using negative or positive numbers to indicate the hemisphere of the point or the compass direction can be indicated by using a letter. The follow cities were added to the map in this manner: Coordinates that are formatted as Degrees Minutes Seconds, can be added using various delimiters, such as spaces, dashes, underscores, colons, or d (degree), single quote (minute), double quote (second). We entered the last 3 provincial capital cities using these formats: Points can also be plotted from previously created MAP Locations (to learn about this tool, visit the MAP Locations page in our Support Centre). This is how we plotted a MAP Location for Ottawa on our map. In the MAP Point Plotter tool window, we selected the hamburger menu and selected Plot MAP Locations. Then we selected our MAP Location for Ottawa and set the Destination Layer to Existing… and added it to the Capitals MAP Point Layer. After clicking OK the point was added to our map! Finally, we used other MAPublisher finishing tools to stylize and complete our map so it would be ready to post on this blog just in time for Canada Day! For more information about the MAP Point Plotter tool, check out its documentation page in our Support Centre! In this month’s Map Gallery Spotlight, we are showcasing an honourable mention of the 2021 Avenza Map Competition. This relief and land cover map of the San Francisco Bay Area was created by Evan Applegate of The Map Consultancy. The map shows the lakes, rivers, forests, grasslands, croplands, wetlands, and urban areas of the Bay Area. Applegate created the map as a dedication for two of his friends who were married on a beautiful cliffside north of the city. The North Bay Area is known for being the least urbanized part of the Bay Area, and housing the Napa and Sonoma wine regions. The map highlights various natural features throughout the San Francisco Bay Area, such as elevation peaks, water features, and some landmarks. It also includes 50-meter bathymetry contours. The shaded relief details the varying elevation of the region, colour-coded to display the borders between forests, grassland, farmland, and urban land. The location of Applegate’s friends’ wedding, Slide Ranch, is identified on the map. Select the images below to see a detailed look at Evan’s map Applegate pre-processed his data in QGIS, GDAL, and Adobe Photoshop, and then used the Avenza MAPublisher plugin for Adobe Illustrator to composite it all together. This is made easy by the way MAPublisher retains the georeferencing of the data imported from other GIS software. Data that does not have any georeferencing when it is imported, can also easily be georeferenced using MAPublisher’s Georeferencer tool. The finishing touches were also added to the map using MAPublisher. The Label Features tool was heavily used in the placement of labels, saving Applegate several hours of manual labeling. Using this tool, label settings can be applied and multiple layers of data can be labeled at once if desired. Finally, labels are added to the map under one Text layer, to ensure organization. Stylistic elements of the map were touched up using native Adobe Illustrator tools, MAP Layout tools, and a graticule was added. Check out our other Map Gallery Spotlight blogs here! Today is May 20th, which means that it is World Bee Day! This year we will be celebrating with an infographic map detailing the prevalence of beekeeping in the nation of New Zealand. The map has been compiled and designed using the Avenza MAPublisher extension for Adobe Illustrator. Beekeeping, also known as apiculture, is the maintenance of bee colonies by humans, commonly in man-made hives. Beekeeping results in the creation of many products in our lives such as beeswax, royal jelly, and many different types of honey. World Bee Day was first celebrated in 2018, after being proposed by Slovenia to the United Nations in prior years. May 20th is the birthdate of the pioneer of beekeeping Anton Janša, who was born in Carniola in 1734, which was a region that falls within present-day Slovenia. The purpose of World Bee Day is to celebrate the importance of bees and other pollinators to many aspects of the world’s ecosystems and economies. They are responsible for the pollination of many crops, with nearly ⅓ of every spoonful of food we eat depending upon pollinators. This makes bees a very important part of the agricultural industries, and therefore the economies of many countries. With many pesticides and other chemicals negatively contributing to the health of the world bee populations, it is crucial to raise awareness and promote care when creating agricultural and other environmental policies and processes. New Zealand is one of the top 20 countries ranked by total number of beehives, with over 835,000 registered beehives. The organization Apiculture New Zealand, or ApiNZ, was created in 2016 to support, advocate for and benefit the apiculture industry of the country. Membership is voluntary and consists of about 2500 beekeepers. New Zealand produces many different types of honey, including population variations such as mānuka honey. The story map we have created using MAPublisher locates the 23 known beekeeping clubs across New Zealand, as well as highlights some interesting facts about beekeeping in the island nation. All in all, beekeeping is an important part of the New Zealand economy and agriculture industry. Here are a couple fun facts you might not know about bees and how important it is to continue protecting them: In the spirit of World Bee Day we encourage you to learn more about beekeeping! Check out these great bee resources; World Bee Day website, Apiculture New Zealand website. We are showcasing the Runner-Up of the 2021 Avenza Map Competition. This impressive topographic reference map of the Monte Rosa area was a collaborative effort between Remo Nardini, Founder and Chief Technical Officer, and the whole 4LAND team. The map is centered on two of the most renowned mountains of the Alps: Monte Rosa and Monte Cervino (commonly referred to as the Matterhorn). The map encompasses a massive and diverse area. From the glaciers and valleys crossed by the Alta Via n.1 highway in the Aosta valley to the panoramic snow-capped peaks that the Alps are known for. The high valleys of the Monte Rosa area emanate a particular charm, with its woods and pastures making it stand out among other areas in the Aosta Valley. Remo and his team manually collected trail information and point-of-interest data directly in the field with the Avenza Maps App and combined this with carefully crafted shaded relief techniques to bring the mountainous terrain of this rugged area to life. The map itself is designed for print at 1:25000 scale and is meant to offer a high-quality, waterproof, and tearproof map for use on the trails. The map provides an abundance of useful information for hiking, camping, mountain biking, and a host of other summer and winter outdoor activities. Smart label placement means this map is not only impressive to look at but highly functional when out on the trails. Select the images below to see a detailed look at 4LAND’s map The 4LAND team is known for ground-truthing and manually collecting the data that goes into their map products. Trails, placemarks, and other important data were collected directly on the ground using the Avenza Maps App. Supplementing this with pre-existing and custom-developed cartographic datasets meant the map could provide a substantial amount of valuable information to its users. Using the Geographic Imager Plugin for Adobe Photoshop, the team could elaborate on a custom elevation product to create the enhanced shaded relief basemap that gives the map its gorgeous look. They then crafted the details of the map in Illustrator using MAPublisher. After importing all map datasets, the team used MAP views to align, scale, and project map data layers onto an Illustrator artboard. The team made use of the Vector Crop and MAP Selection tools to filter and process the data down to their specific area of interest. The 4LAND team applied a custom stylesheet using MAP Themes to create the beautiful textures and colours that make each part of the map stand out. MAP Themes applies rule-based styles that are based on MAP Attribute data contained in each map data layer. This careful work ensures each region is distinct and eye-catching. Every glacier crevasse and serac is carefully shaded to create depth, and woodlands are textured to reflect the irregular patterns of foliage. One of the most impressive features of this map is the wonderfully detailed labels. This was achieved using the LabelPro add-on, and enabled Remo and his team to perform rules-based, collision-free label placement using a comprehensive suite of user-defined labelling parameters. With LabelPro, they could specify how each label should be stylized (to give each label type a unique look and feel) and also define how the labeling engine would handle label placement to avoid overlap, crowding, or mislabelling. Lastly, stylistic elements of the map were touched up using native Illustrator tools, MAP Layout tools, and grids and graticules. The map itself is available in digital form for use with the Avenza Maps app. Visit the Avenza Map Store to see other fantastic maps by 4LAND or check out their website to learn more about their other high-quality mapping products.
MAPublisher Virtual Training: November 5-7, 2024
Avenza Maps Virtual Training: November 21-22, 2024
Formation en ligne inter-entreprise sur MAPublisher: 2-6 décembre 2024

Avenza Maps Virtual Training: December 18-19, 2024
MAPublisher Virtual Training: December 3-5, 2024
Mapping Canadian Capitals for Canada Day
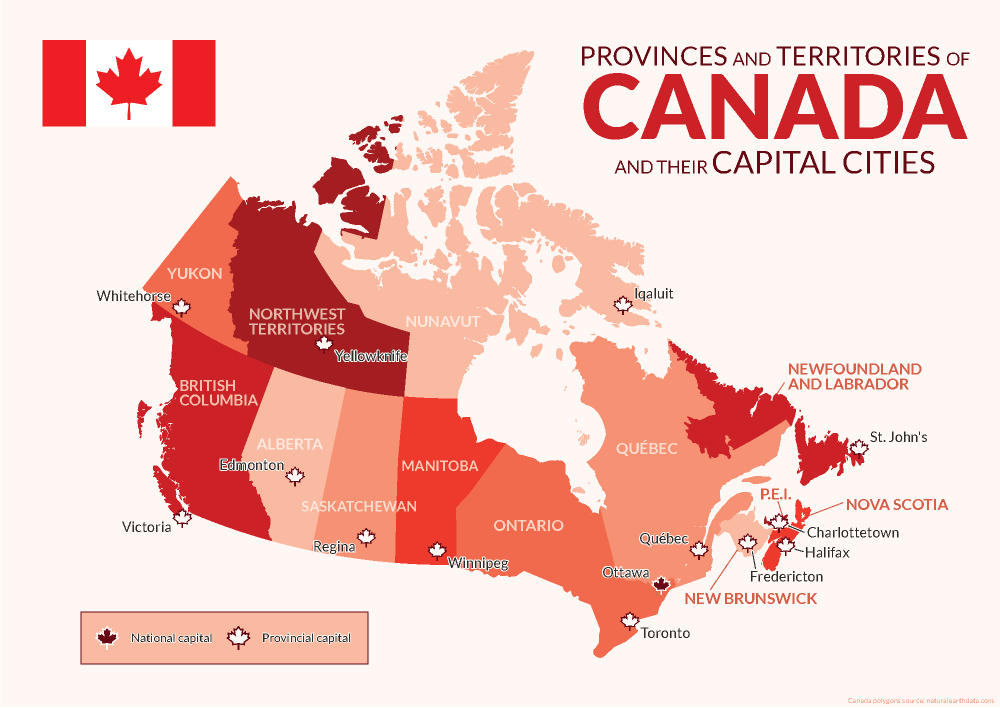
Using the MAP Point Plotter Tool to Plot Canadian Capital Cities
Using a Point’s Address
Using a Point’s Coordinates in Decimal Degrees
Using a Point’s Coordinates in Degrees Minutes Seconds
Using MAP Locations to Plot a Point
Map Gallery Spotlight: Evan Applegate
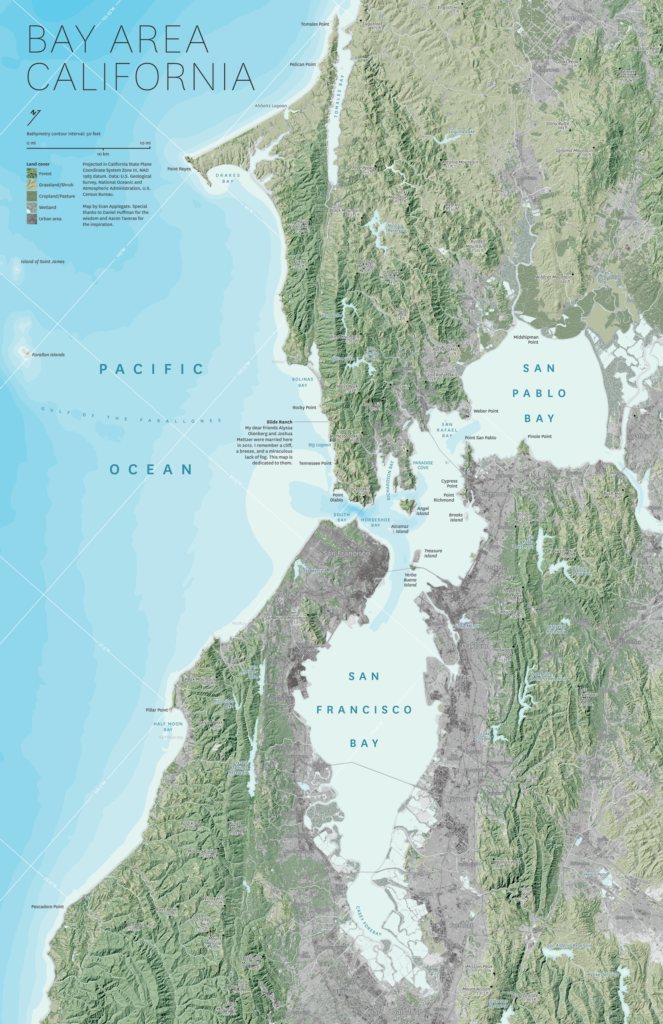
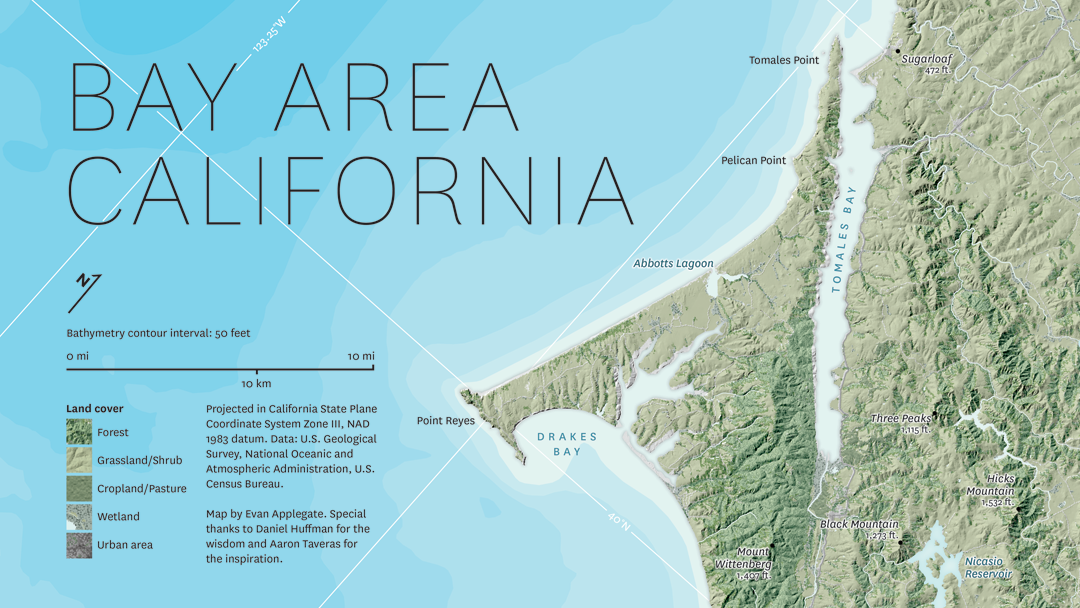
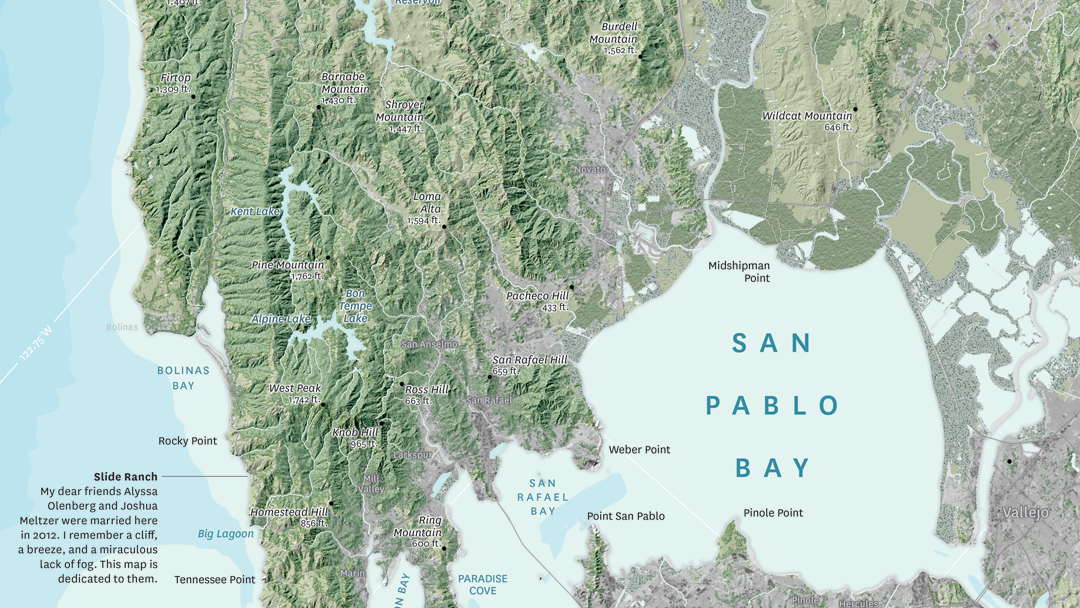
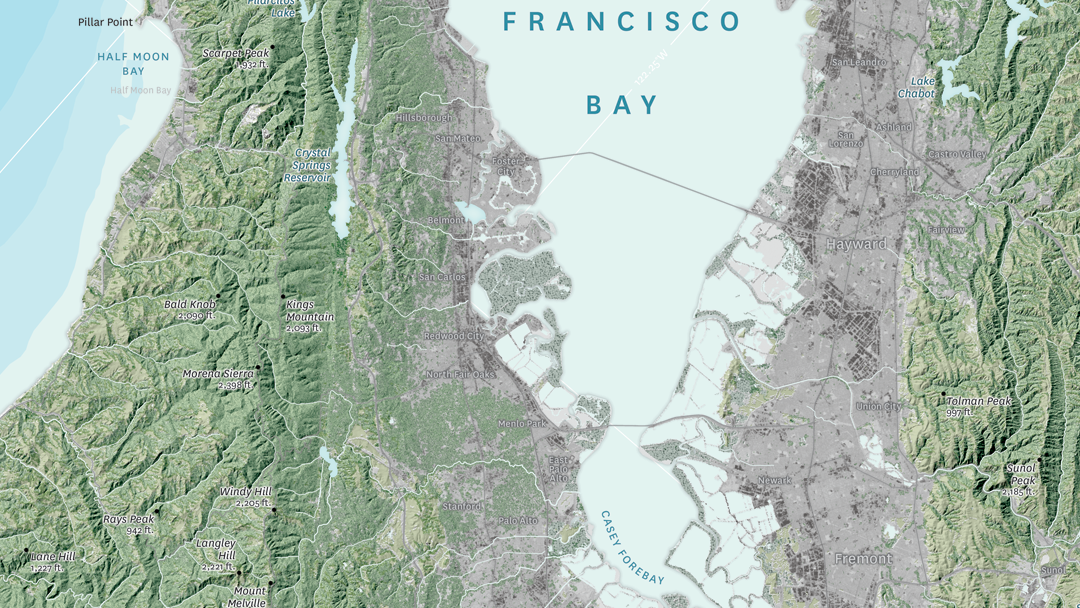
Making the Map
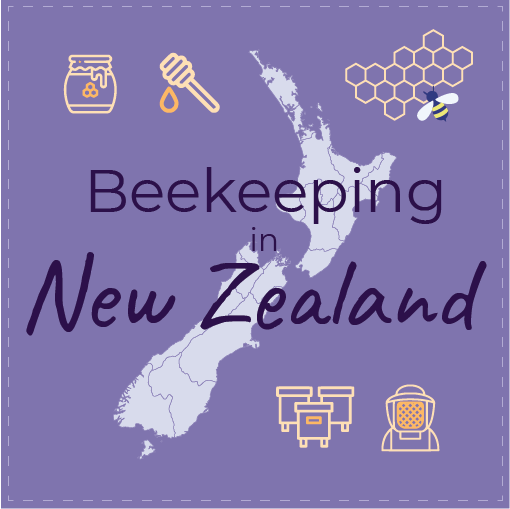
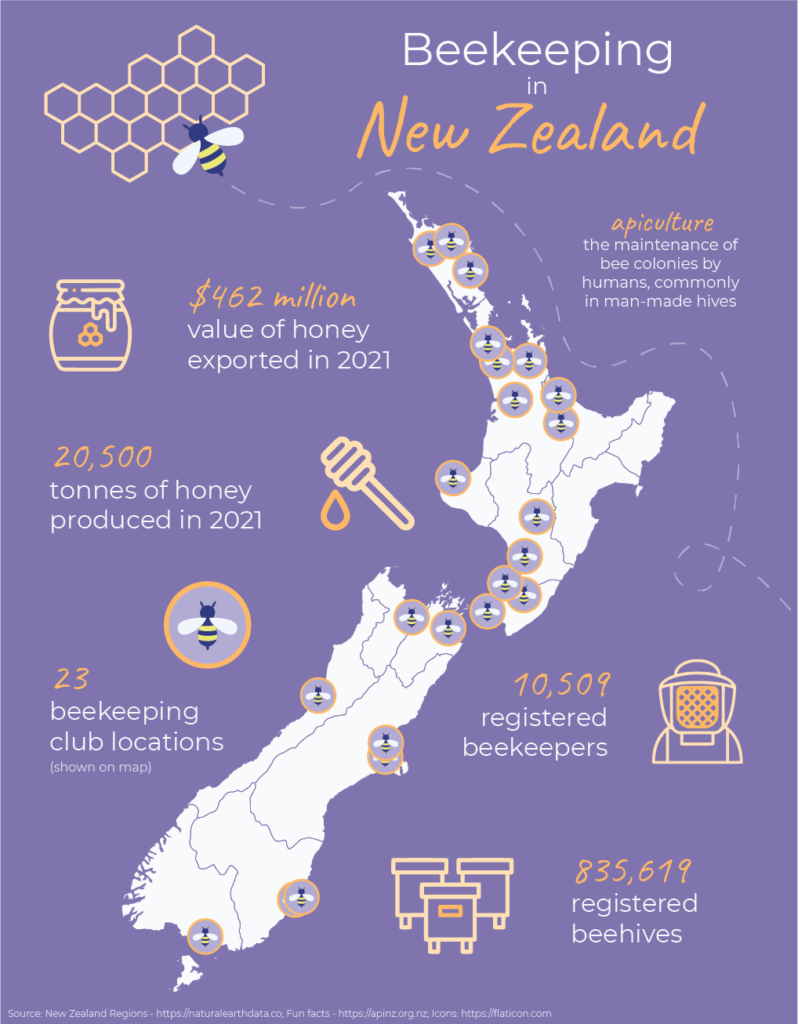
World Bee Day 2022
Beekeeping in New Zealand
What is Beekeeping?
Why do we celebrate World Bee Day?
Beekeeping in New Zealand
Fun Facts About Bees
Feeling Buzzed About Bee Day? Learn More!
Map Gallery Spotlight: 4LAND
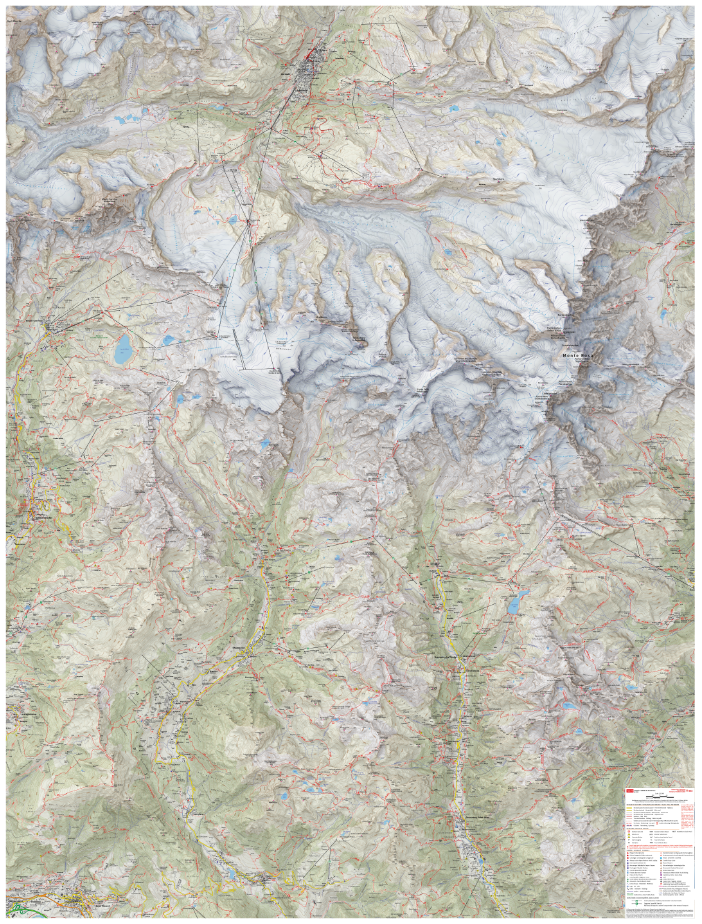
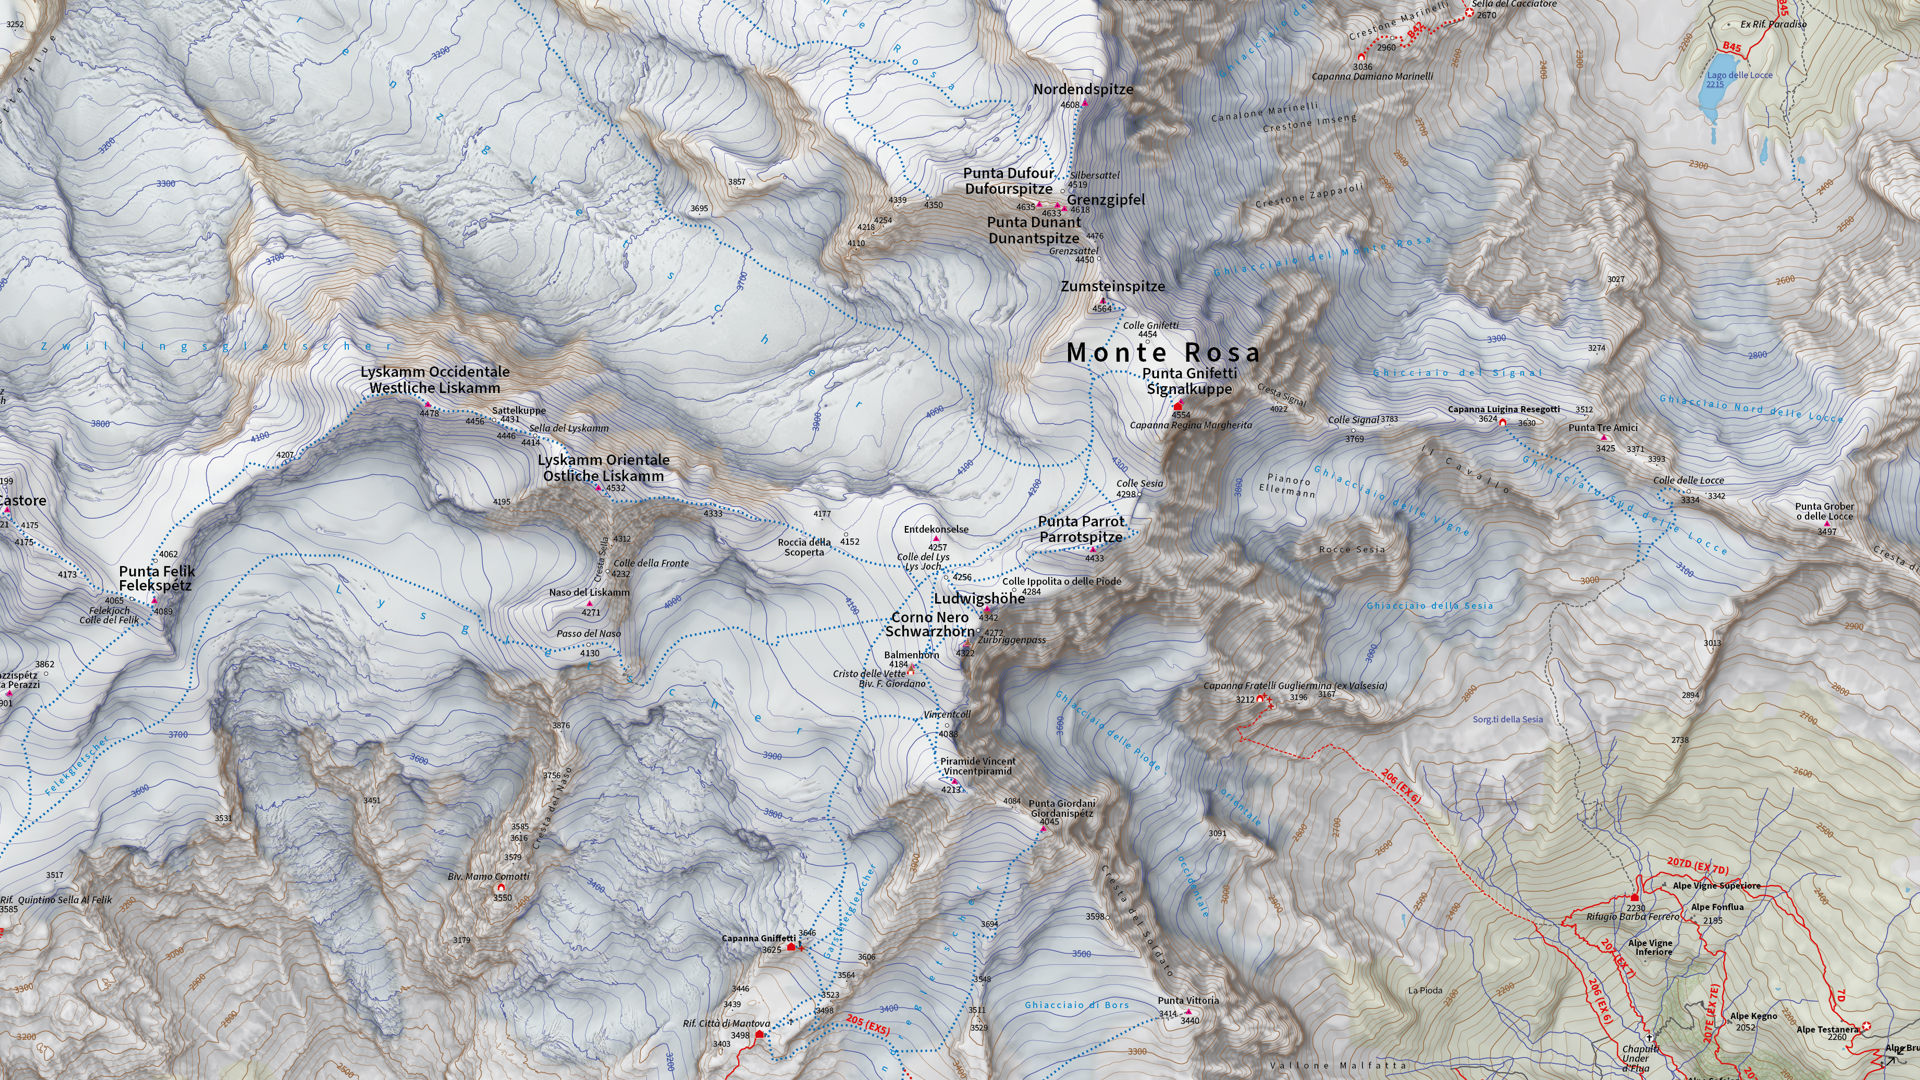
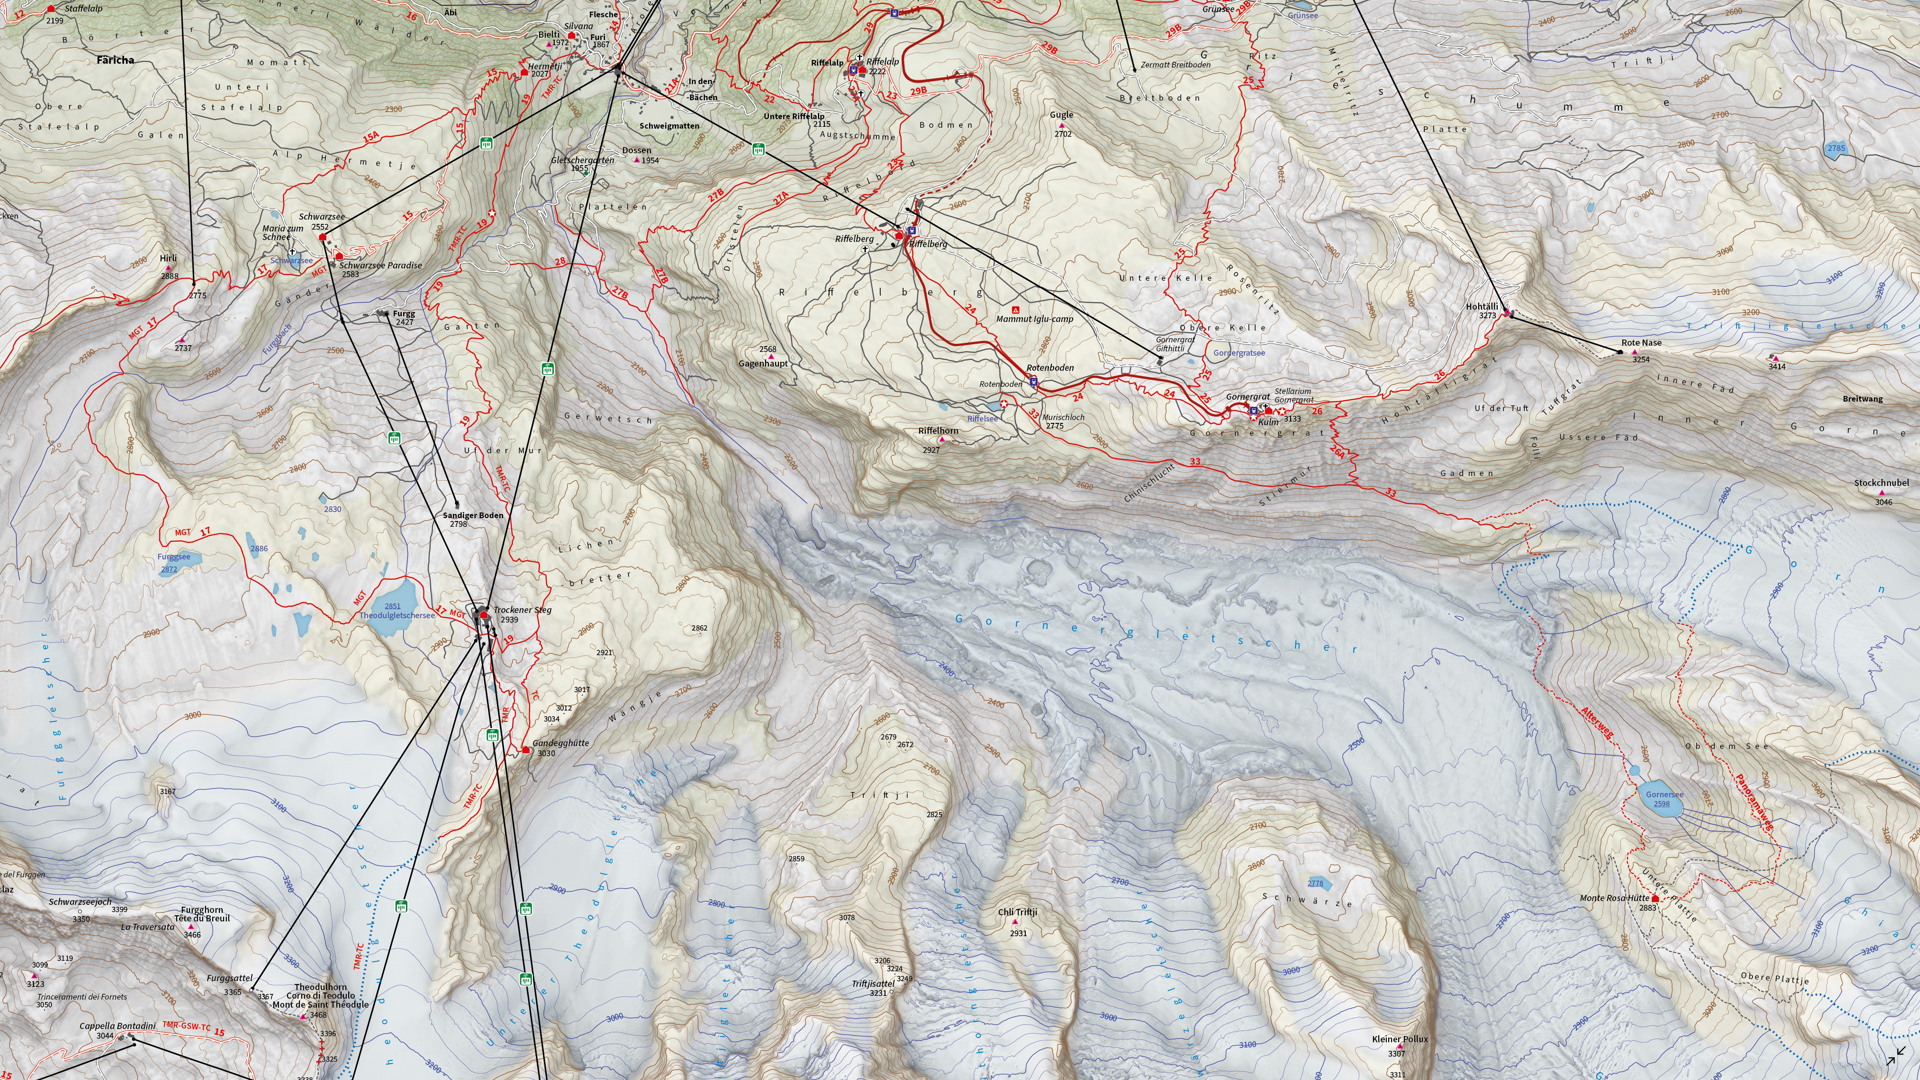
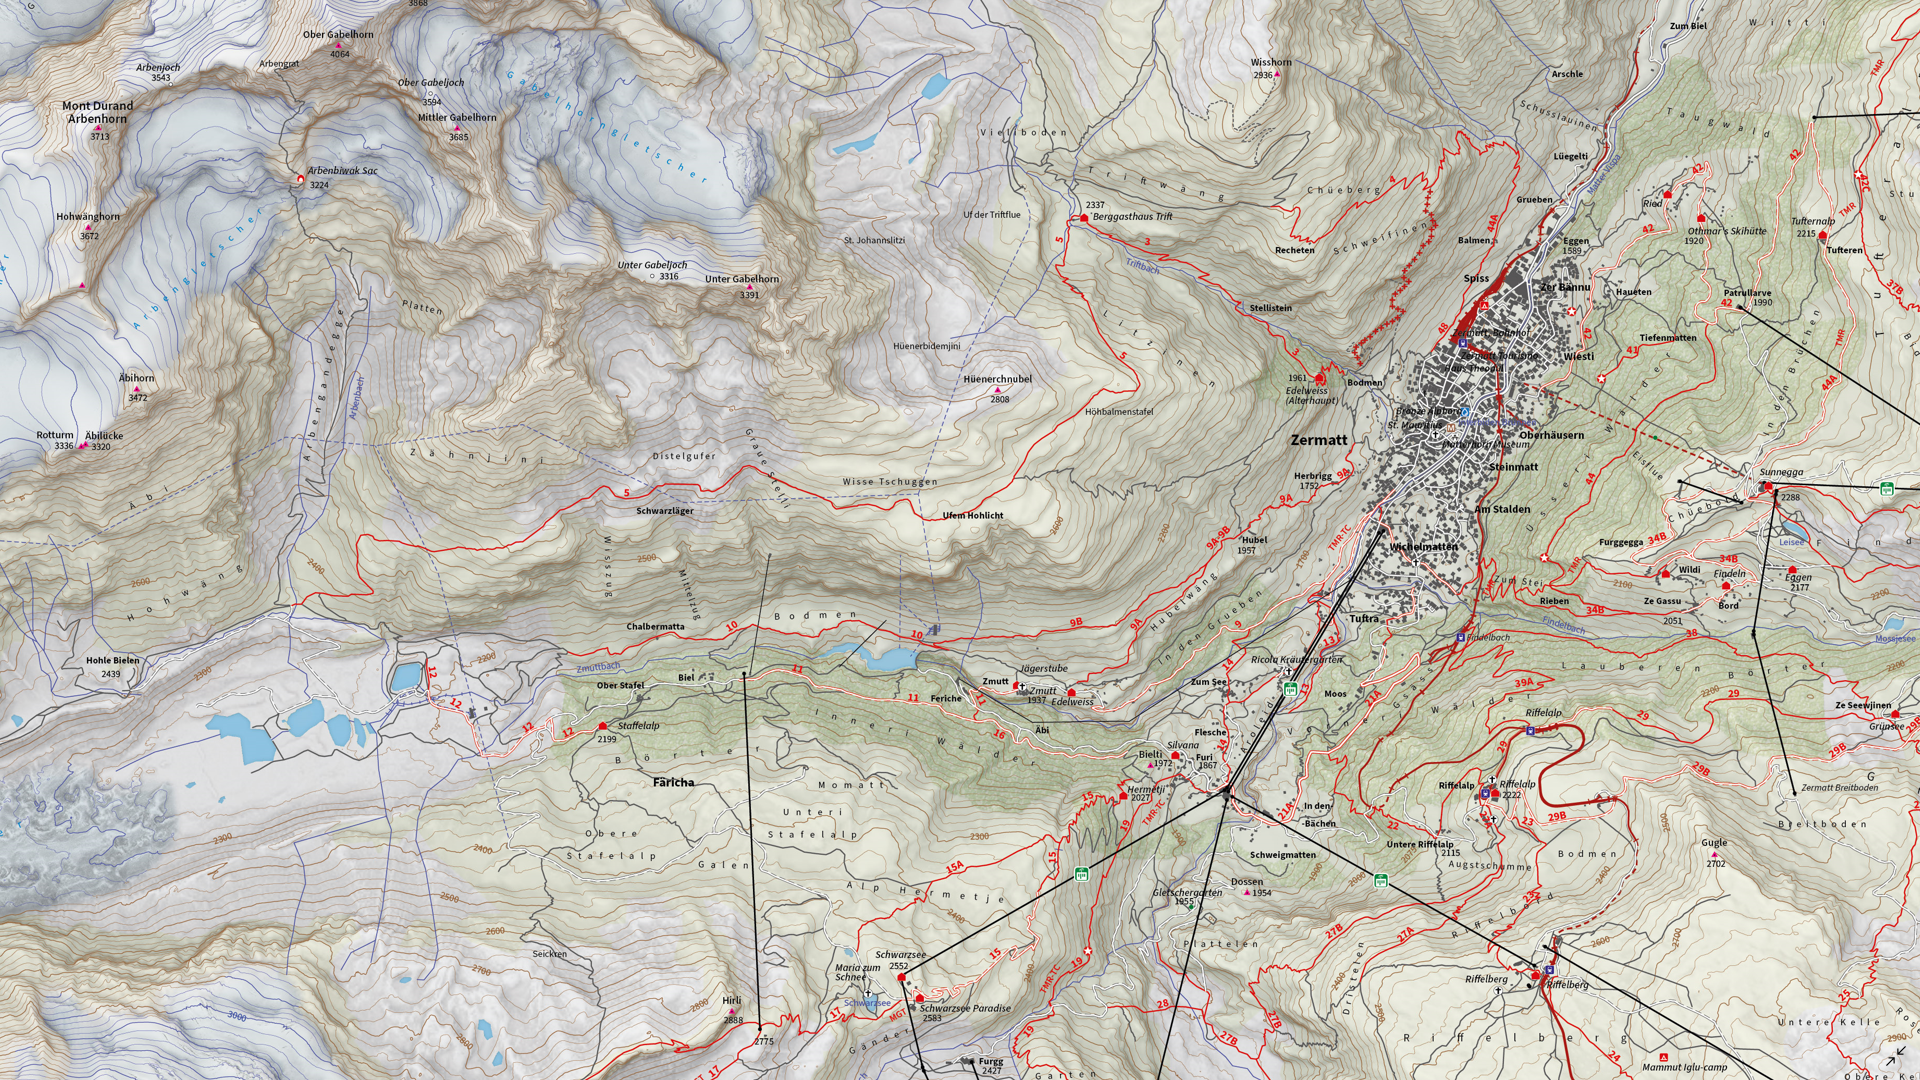
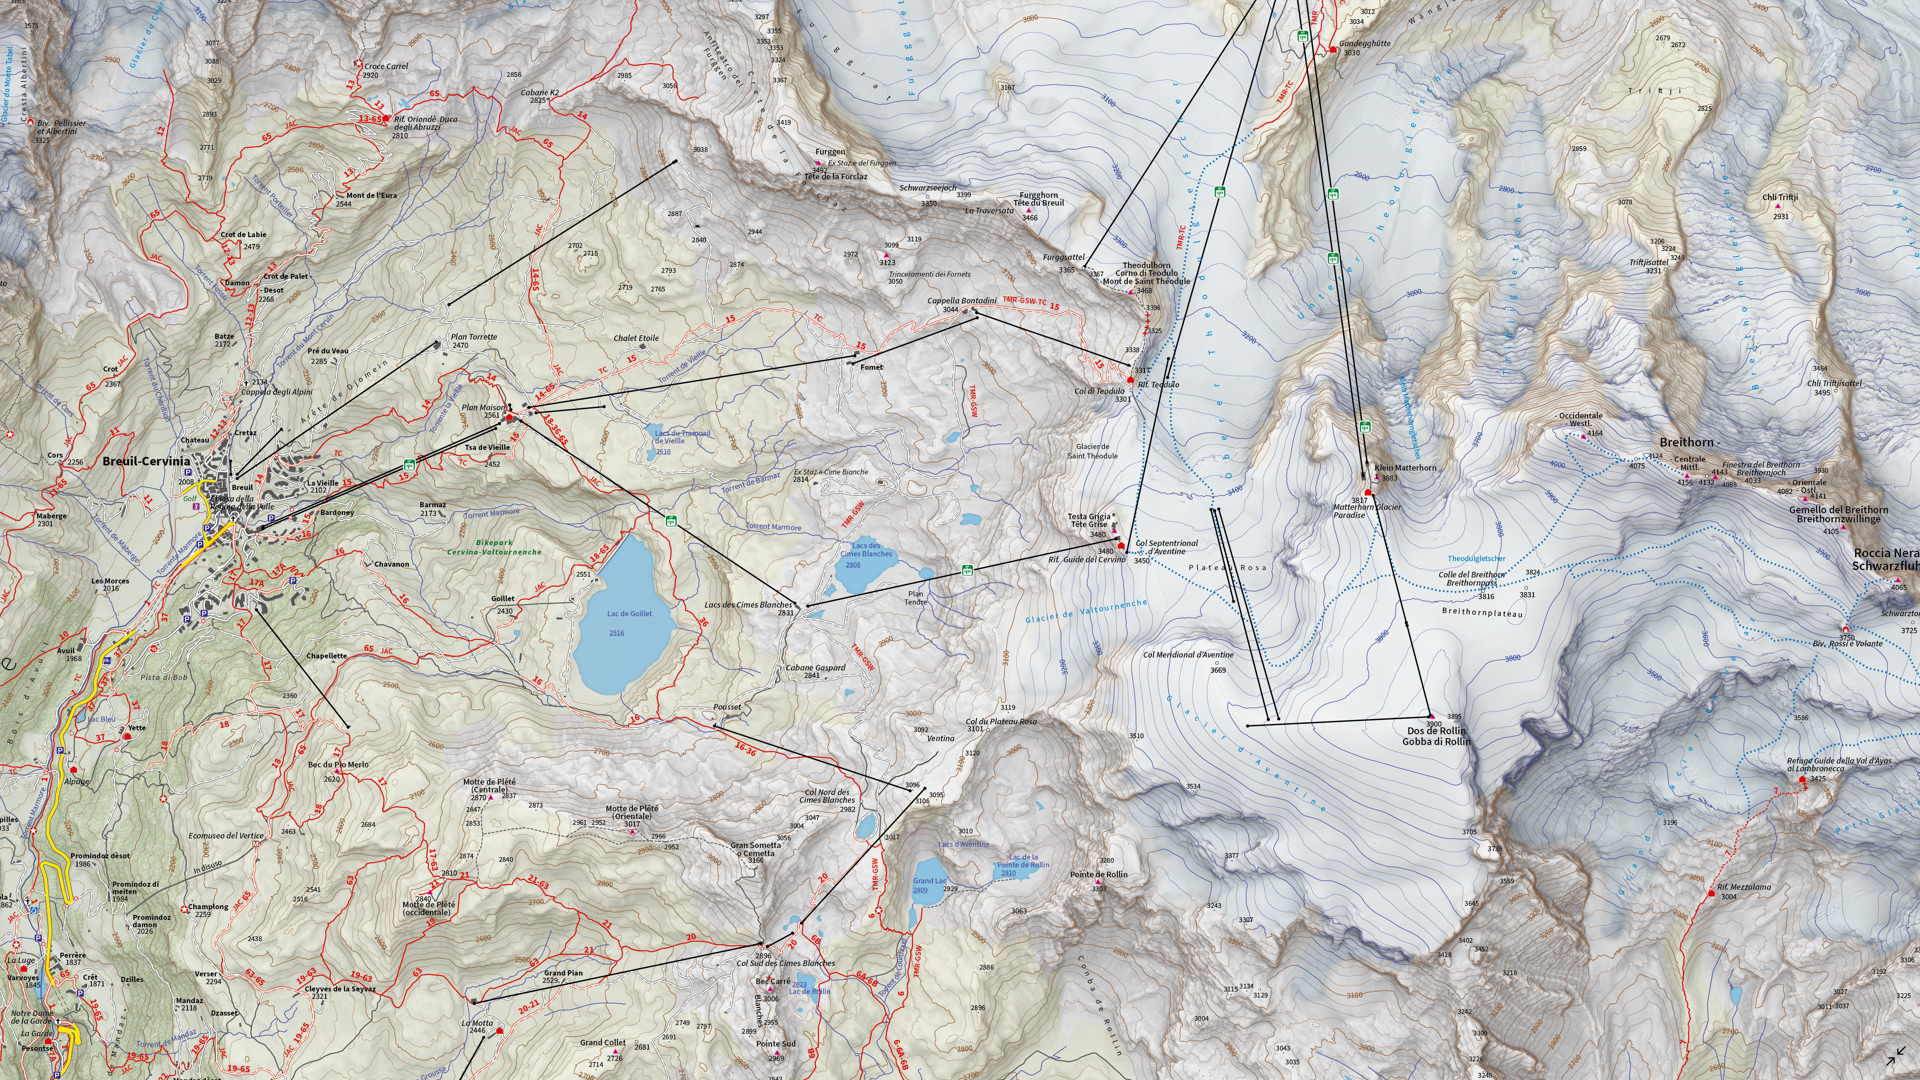
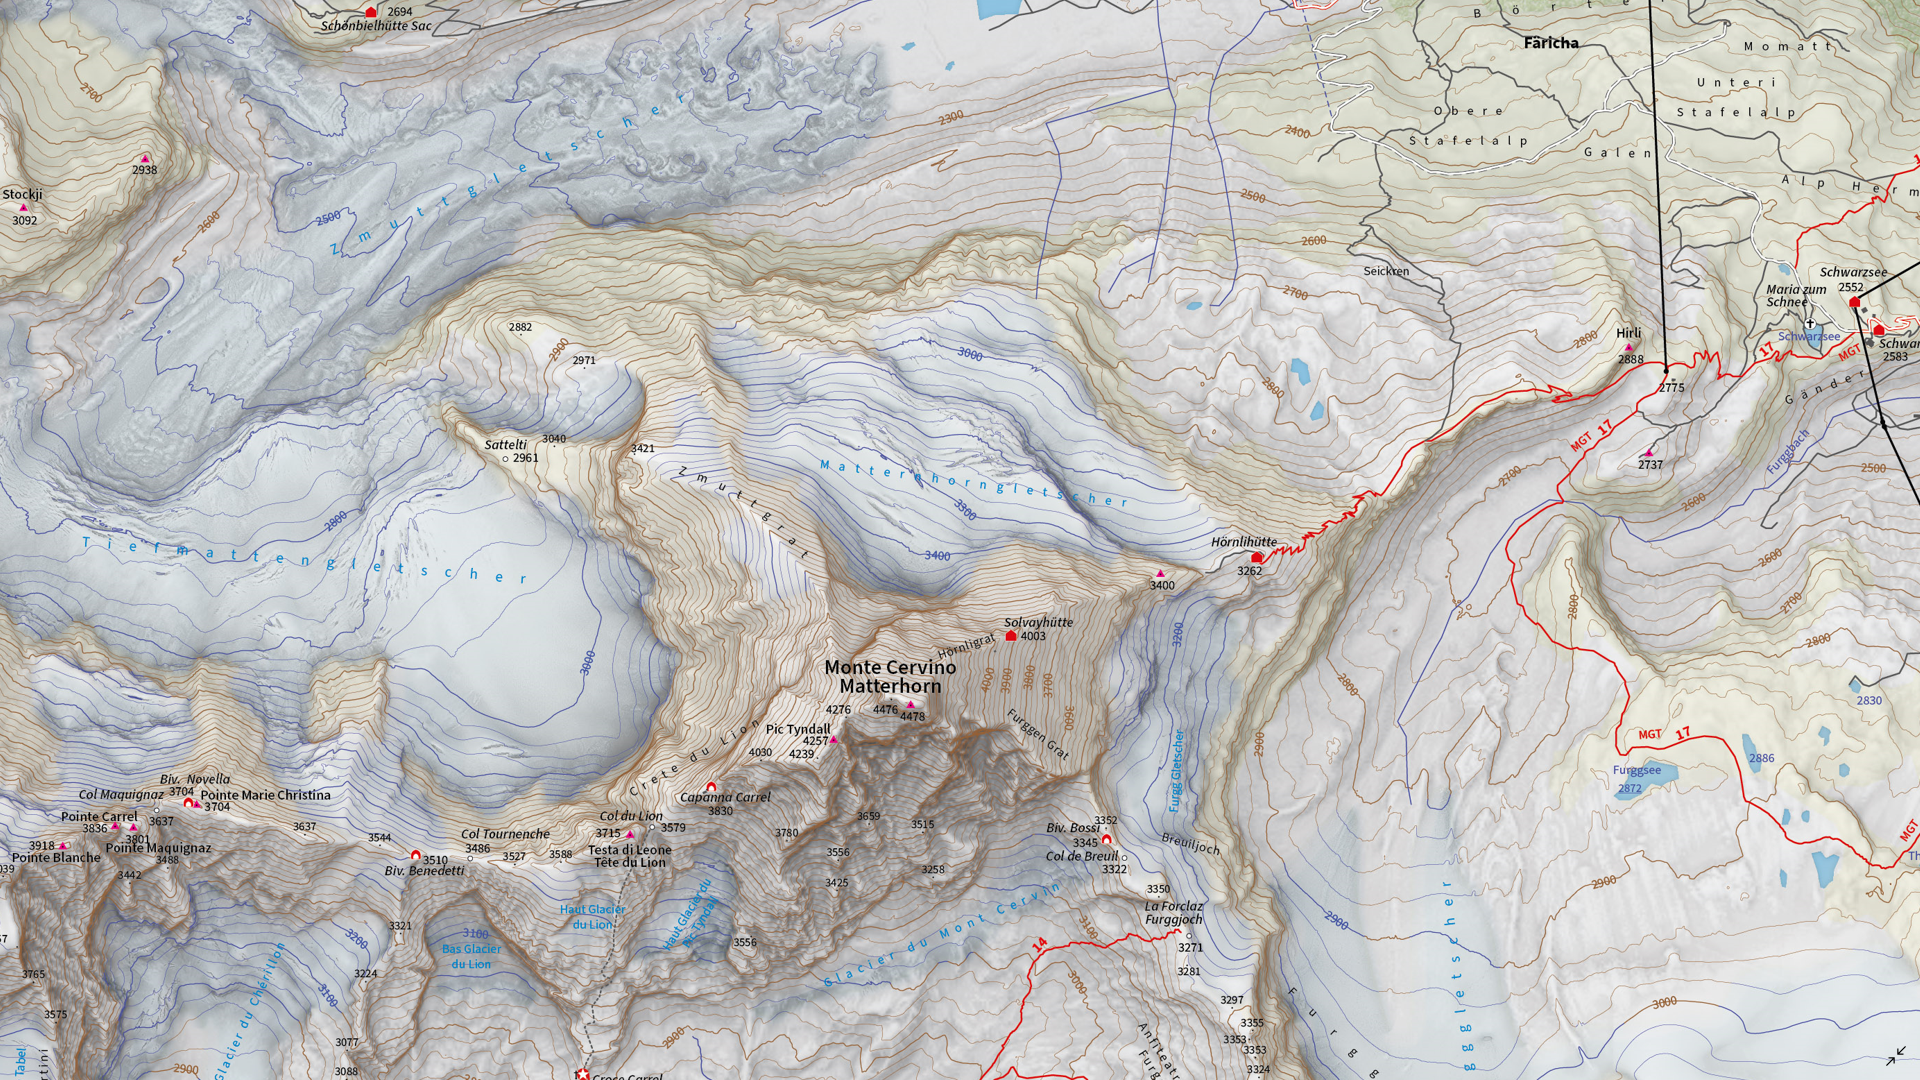
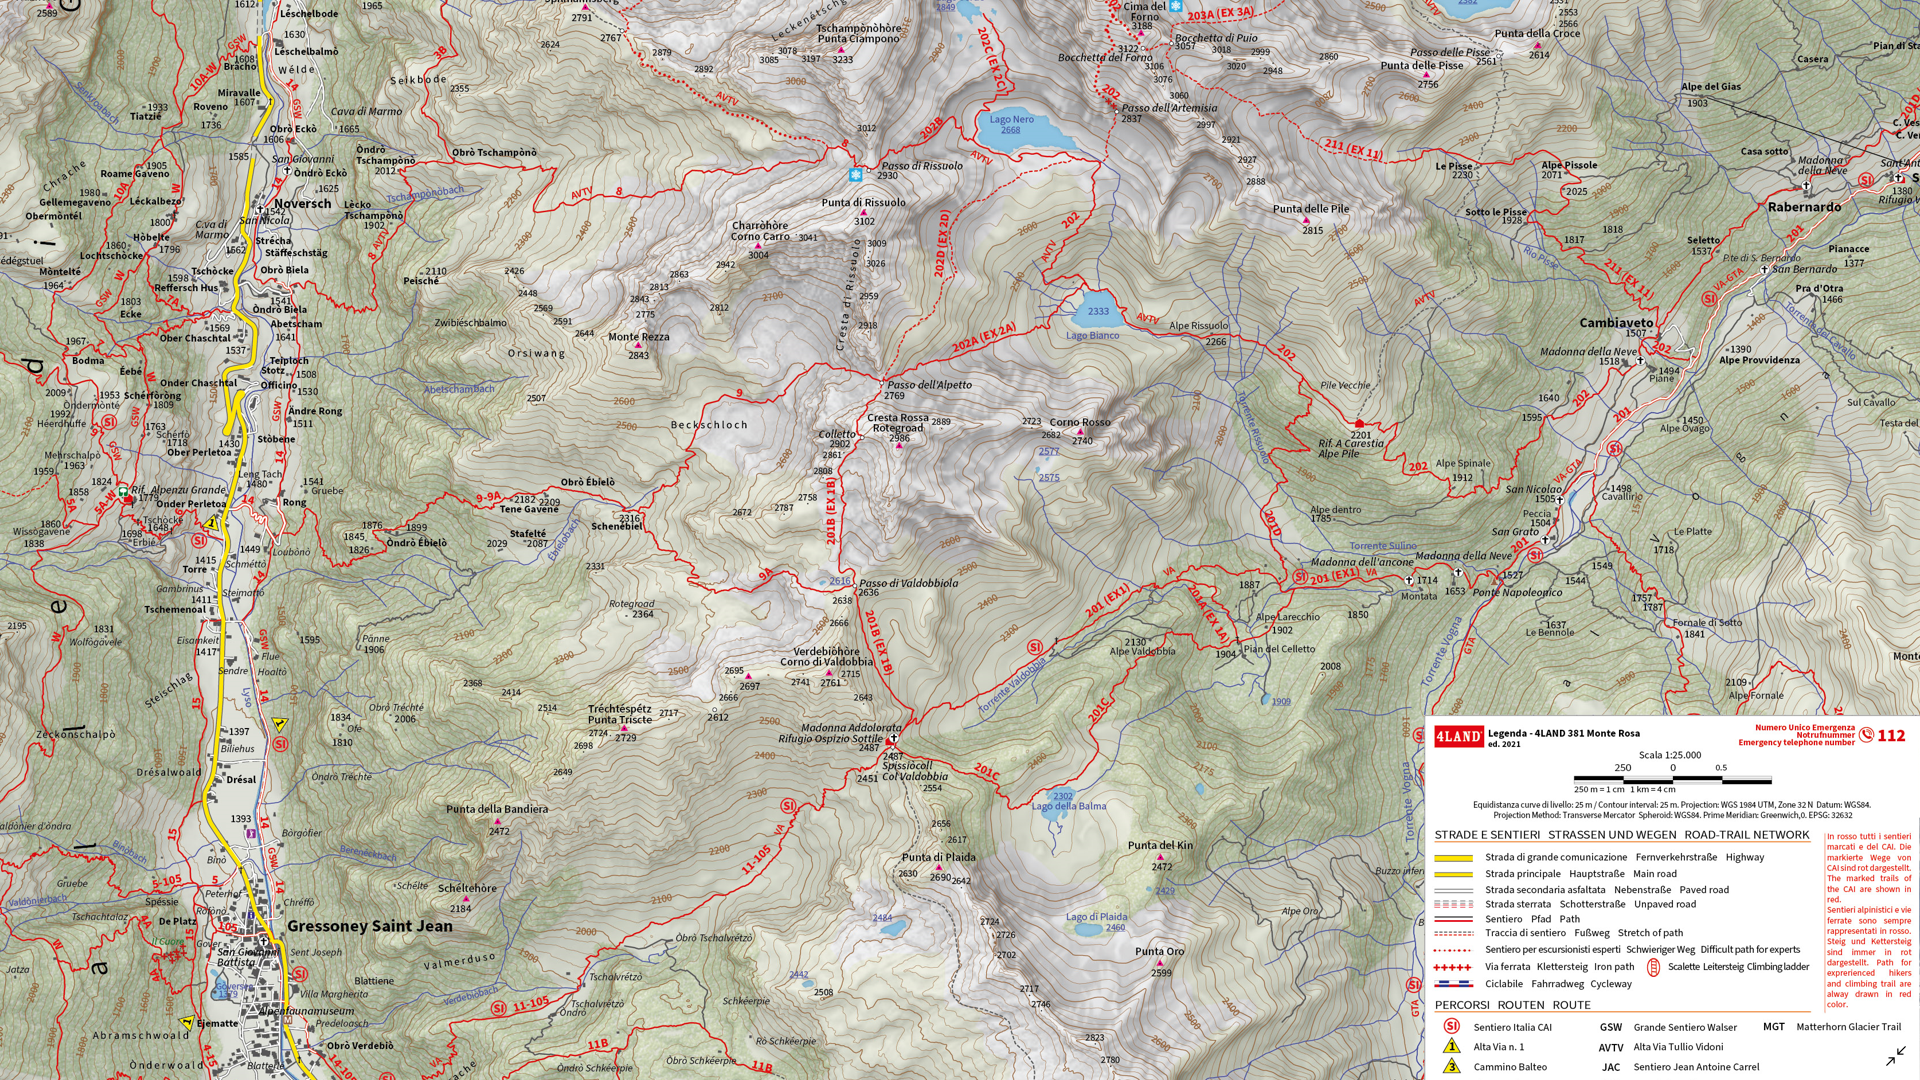
Making the Map