Toronto, ON, November 5, 2024 – Avenza Systems Inc., producer of the Avenza Maps® app for mobile devices and geospatial extensions for Adobe Creative Cloud®, including Geographic Imager® for Adobe Photoshop®, is pleased to announce the release of MAPublisher® version 11.5 for Adobe Illustrator®. This version introduces several compatibility updates, importing Vector Basemaps from custom tile sources, the ability to use the Join Table feature with existing MAP Layers, a new Split Line path utility, and several performance enhancements and bug fixes.
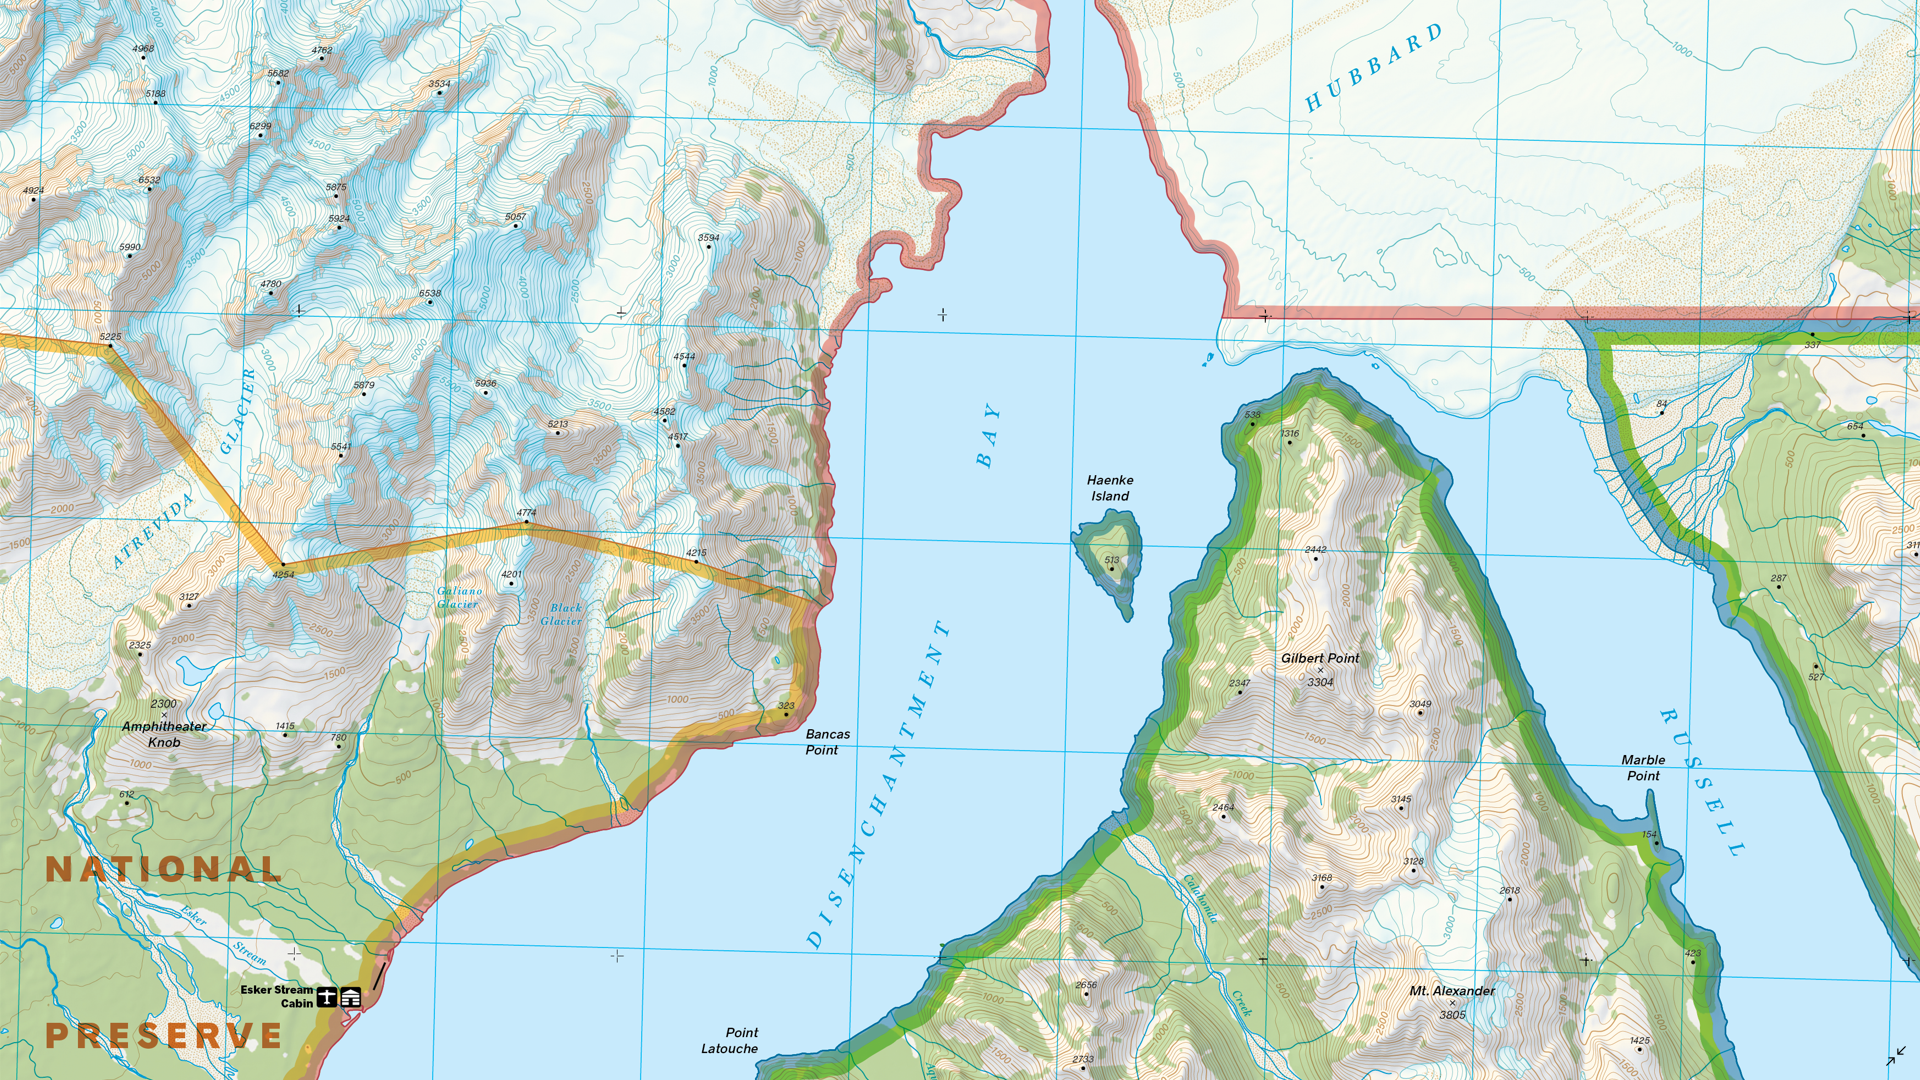
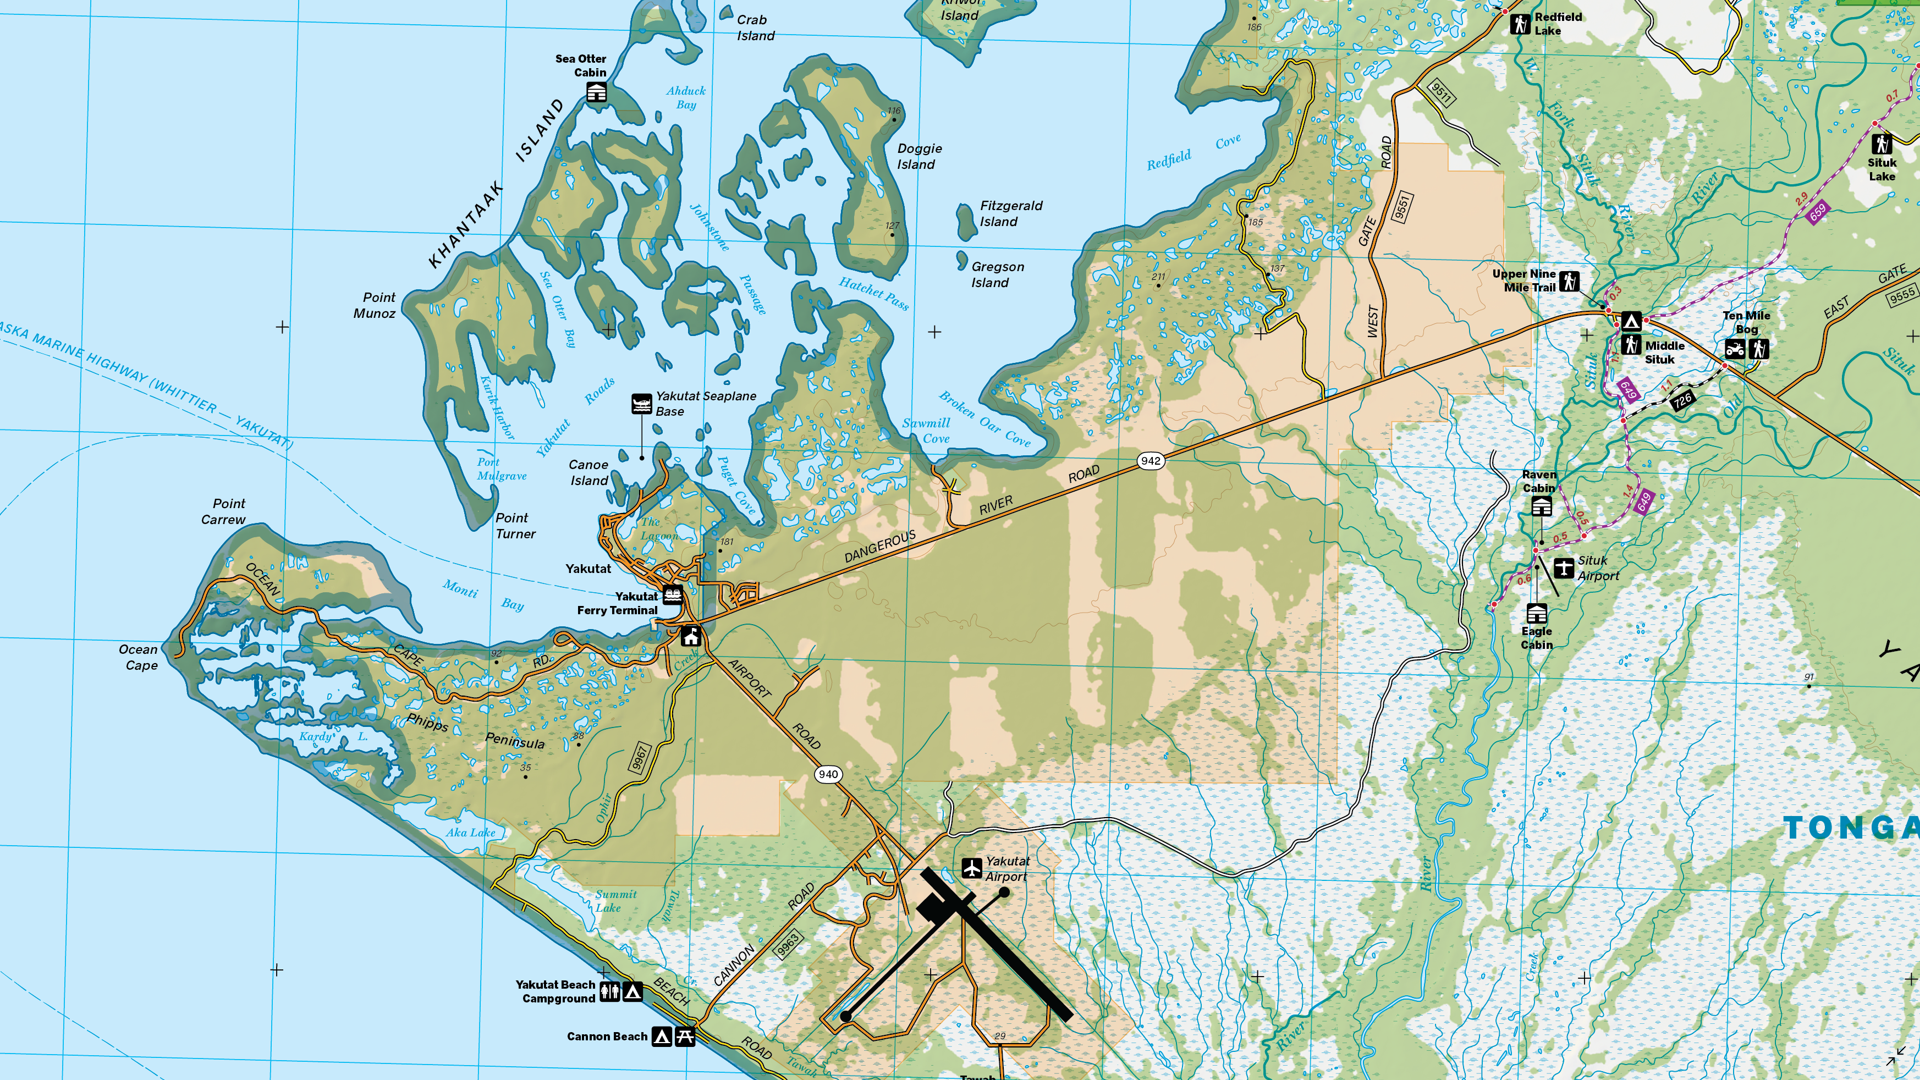
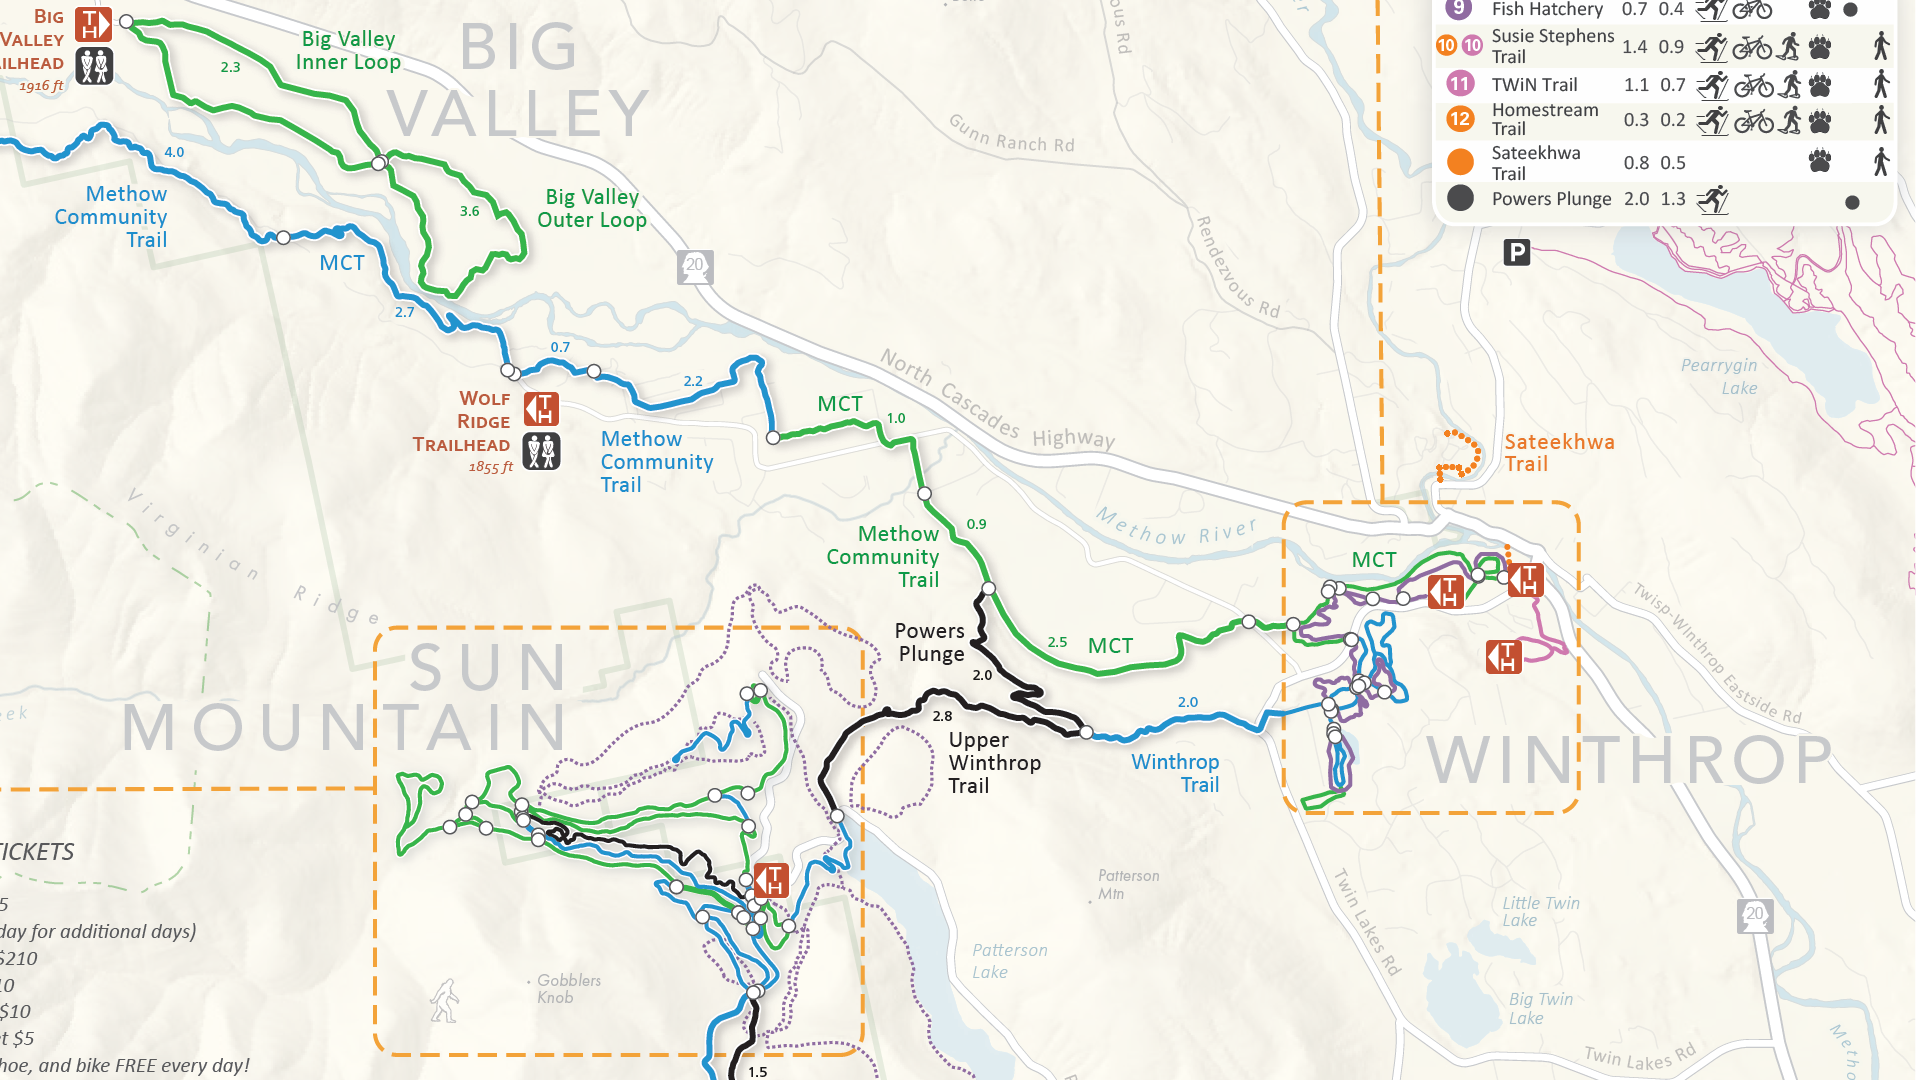
MAPublisher cartography software seamlessly integrates more than seventy GIS mapping tools into Adobe Illustrator to help users create beautiful maps from geospatial data. Import industry-standard GIS data formats and make crisp, clean maps with all attributes and georeferencing intact using the Adobe Illustrator design environment.
New features of MAPublisher v11.5 for Adobe Illustrator include:
- Adobe Creative Cloud 2025 compatibility: MAPublisher now supports Adobe Illustrator 2025 (version 29.0) on both Mac and Windows
- macOS Sequoia compatibility: MAPublisher also officially supports the new macOS Sequoia (version 15) update
- FME Form 2024 compatibility: MAPublisher now supports the recent FME 2024.1 update when using the FME Auto add-on
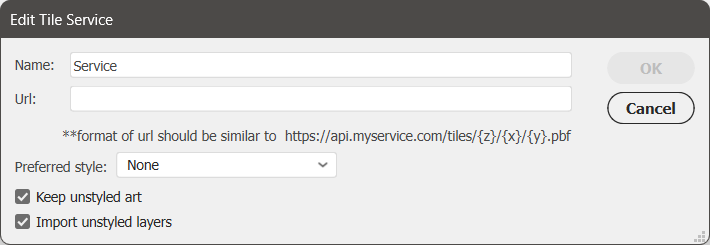
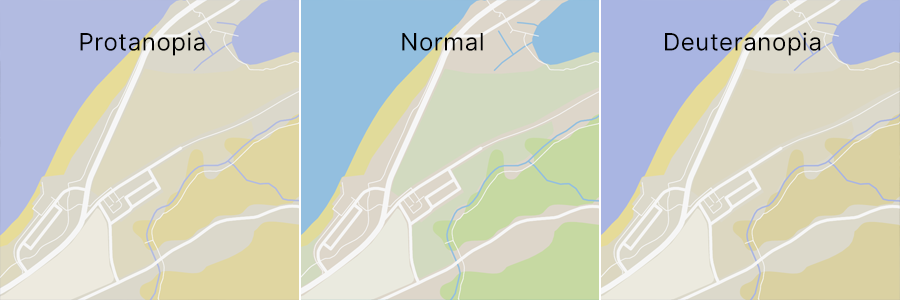
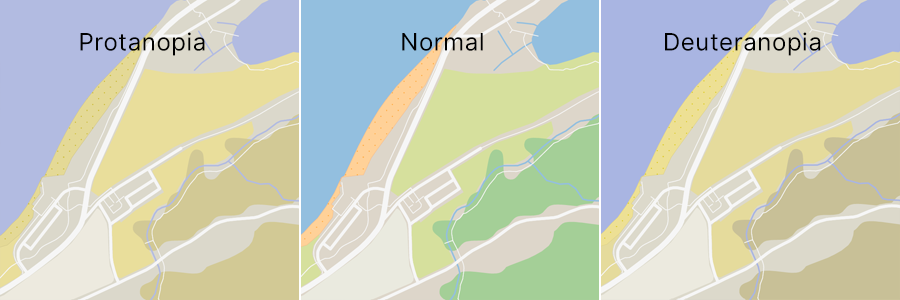
- Importing Vector Basemaps from custom tile sources: Vector Basemap data can now be imported from custom tile sources such as Mapbox, Esri and OpenStreetMap. Data can be imported unstyled and later configured with the brand new “MAP Basemap Styling” panel, which can be found under the Thematic Tools section of the MAPublisher Toolbar.
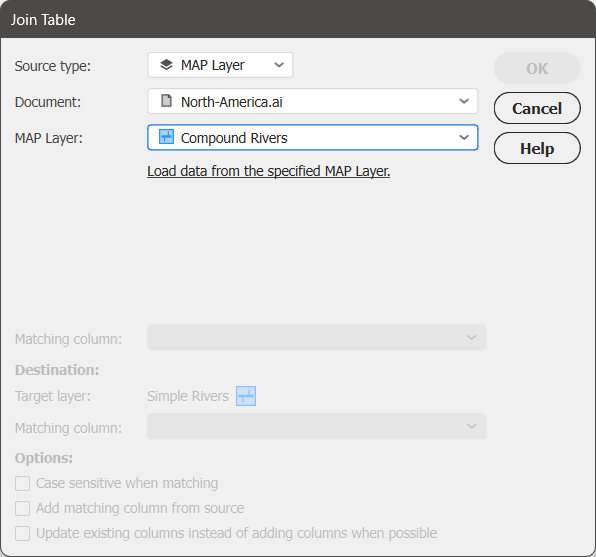
- Join Table from existing MAP Layer: Users can now use the Join Table feature in the MAP Attributes panel to join tables from existing MAP Layers using the “Source Type” drop-down list. These layers may be contained within the active document or any other currently open document.
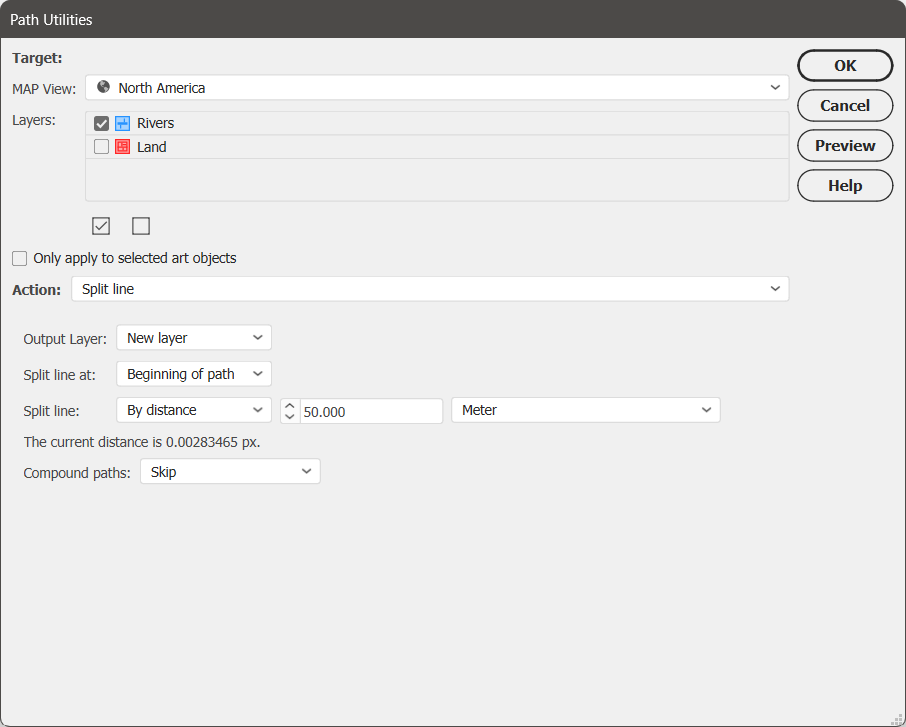
- Split Line action added to Path Utilities menu: The Split Line utility splits a selection of lines into two separate segments at a certain specified length, which can be either relative (i.e. as a percentage of the total line length) or absolute (i.e. at a specified distance in selected units).
- Performance enhancements: MAPublisher v11.5 has improved performance when working with files containing a large number of features and attributes. Users can expect improved performance in multiple areas including coordinate system reprojection, applying stylesheets, deleting art, moving art between layers, and splitting layers.
- Additional performance improvements and bug fixes
Users require a valid Adobe Creative Cloud subscription and a compatible operating system to utilize the improvements and enhancements offered in MAPublisher v11.5. For questions and information on how compatibility requirements may affect your organization, please contact our Support Centre.
MAPublisher v11.5 is immediately available free of charge to all current MAPublisher users with active maintenance and as an upgrade for non-maintenance users starting at US$739. New licenses are available from US$1,699. MAPublisher FME Auto and MAPublisher LabelPro are also available as add-ons starting at US$569. Academic, floating, and volume licenses are also available. Prices include one year of full maintenance. Visit www.avenza.com/mapublisher for more details.
More about Avenza Systems Inc.
Avenza Systems Inc. is an award-winning, privately held corporation that provides cartographers and GIS professionals with powerful software tools to make better maps. Avenza also offers the mobile Avenza Maps app to sell, purchase, distribute, and use maps on iOS and Android devices. For further information contact: 416-487-5116 – info@avenza.com – www.avenza.com
###