This post was contributed by Hans van der Maarel of Red Geographics.
The problem with using GIS data for point symbols is that depending on the scale and symbolization you often end up with symbols partly overlapping each other. Of course, the symbols can be manually moved around after initial placement to get a more aesthetically pleasing result, but that can be a tedious and time-intensive task.
Thankfully, there is a way to automate at least part of this process by using MAPublisher and LabelPro.
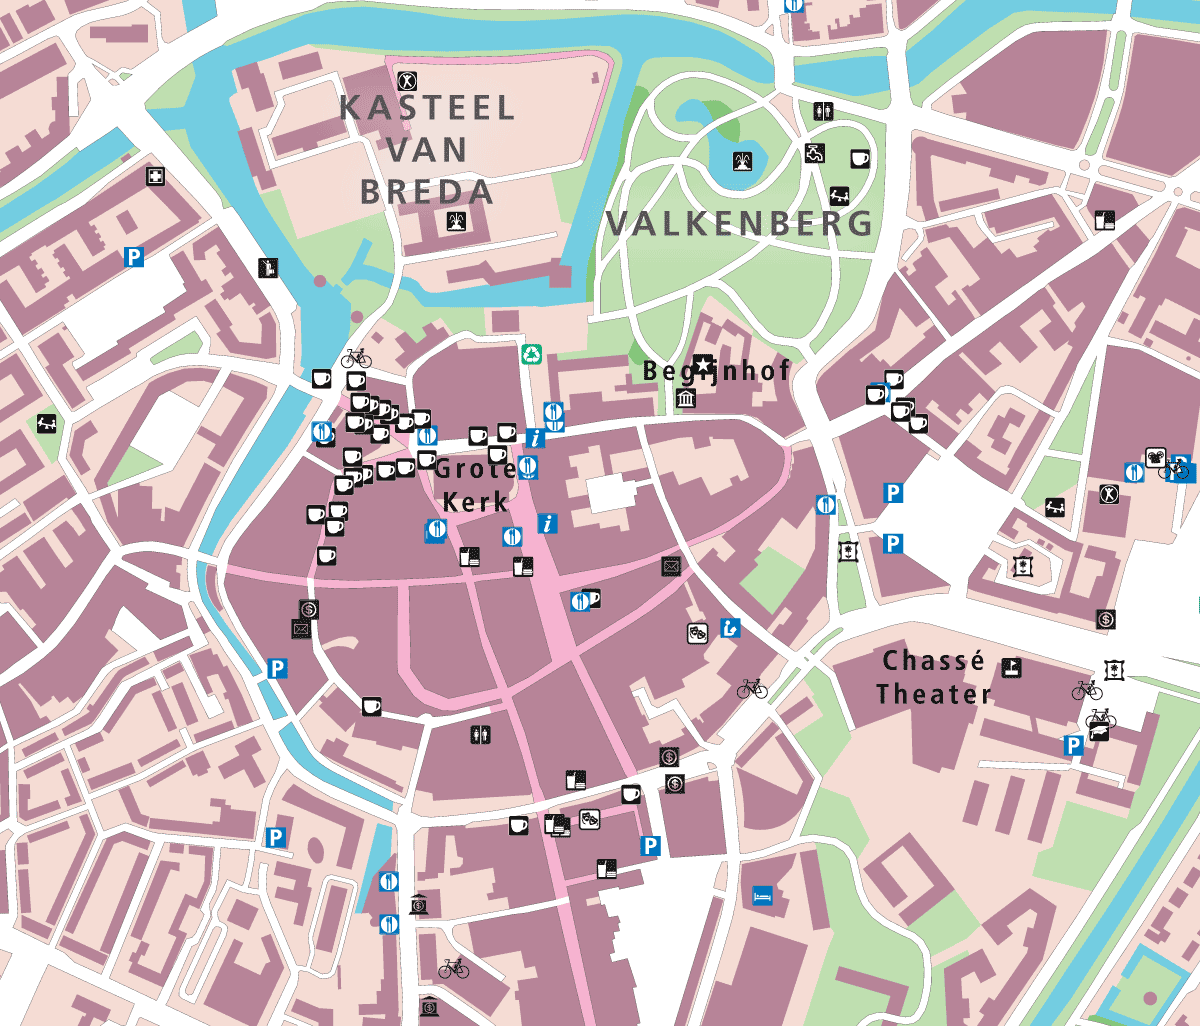
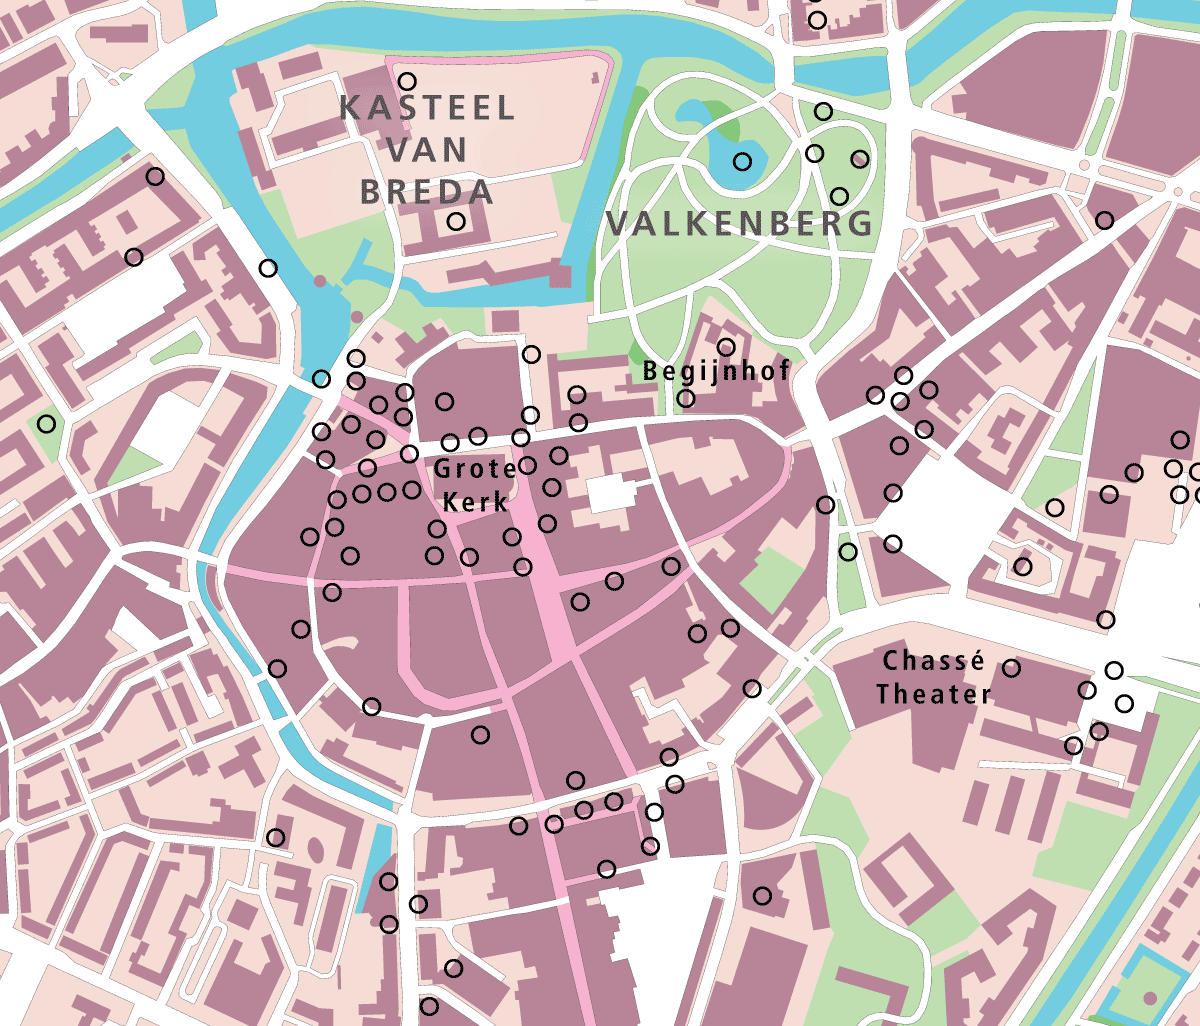
Example map of Breda, The Netherlands
This example shows the heart of an old European city (Breda in The Netherlands to be exact). The map is composed of Dutch Top10NL topographic base data, a few labels were manually added for larger features (such as the park), and points imported from OpenStreetMap (OSM) and styled using a Map Theme. As you can see, there are a number of spots where the symbols are densely located and overlap each other.
The MAPublisher LabelPro add-on is capable of collision-avoidance to make sure overlaps don’t happen. But it only works when generating labels (text). Fortunately, the solution is to trick LabelPro into processing symbols too, so that they can benefit from better placement without overlaps.
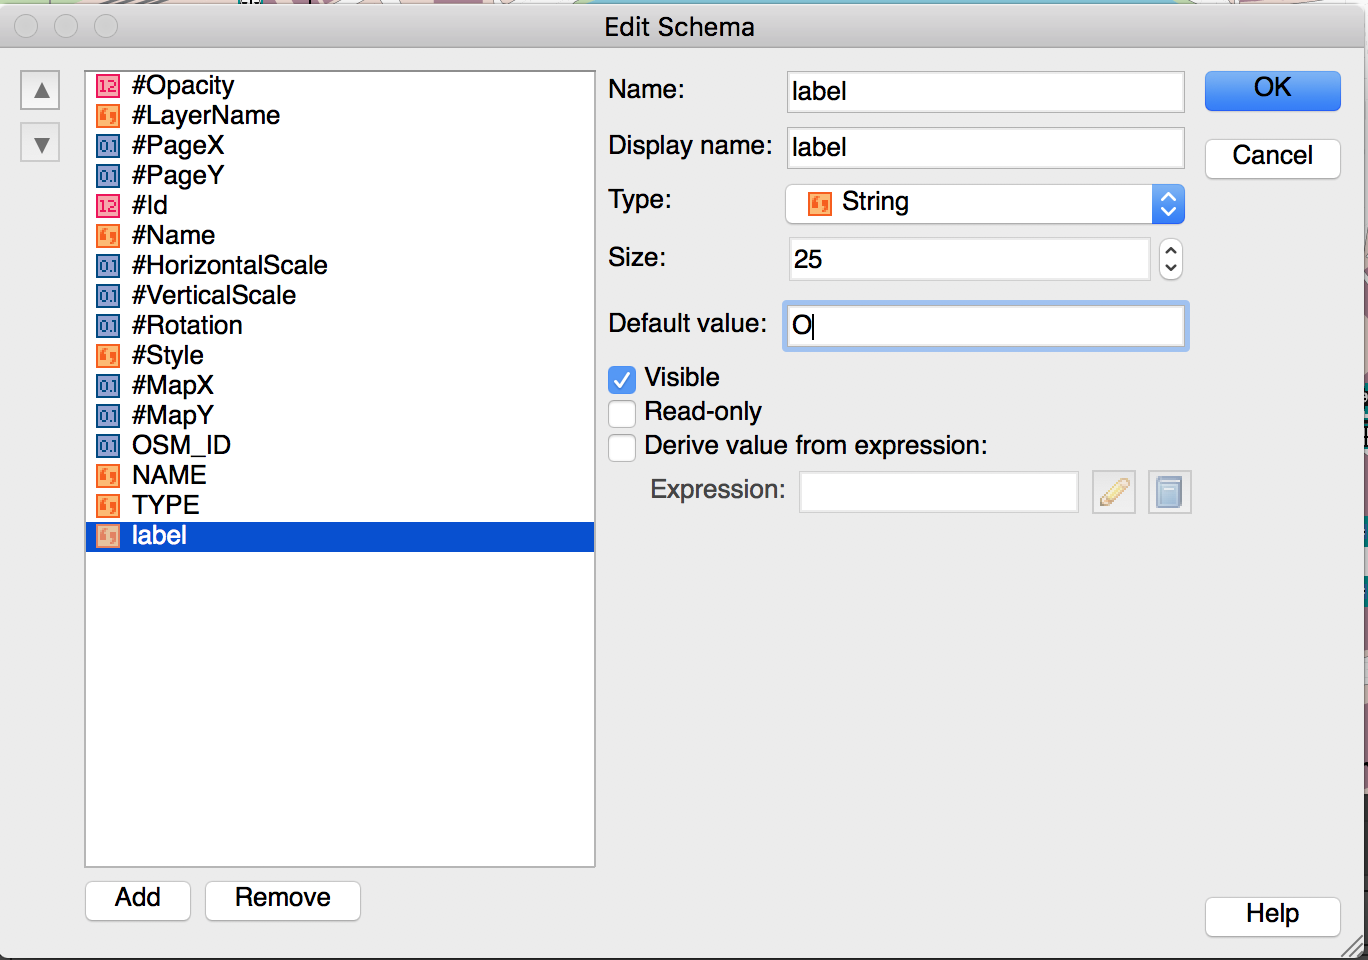
Let’s start by adding a column to the attributes to the OSM points layer and filling it with a default value, a capital O.
Thankfully, there is a way to automate at least part of this process by using MAPublisher and LabelPro.
Editing the attribute schema
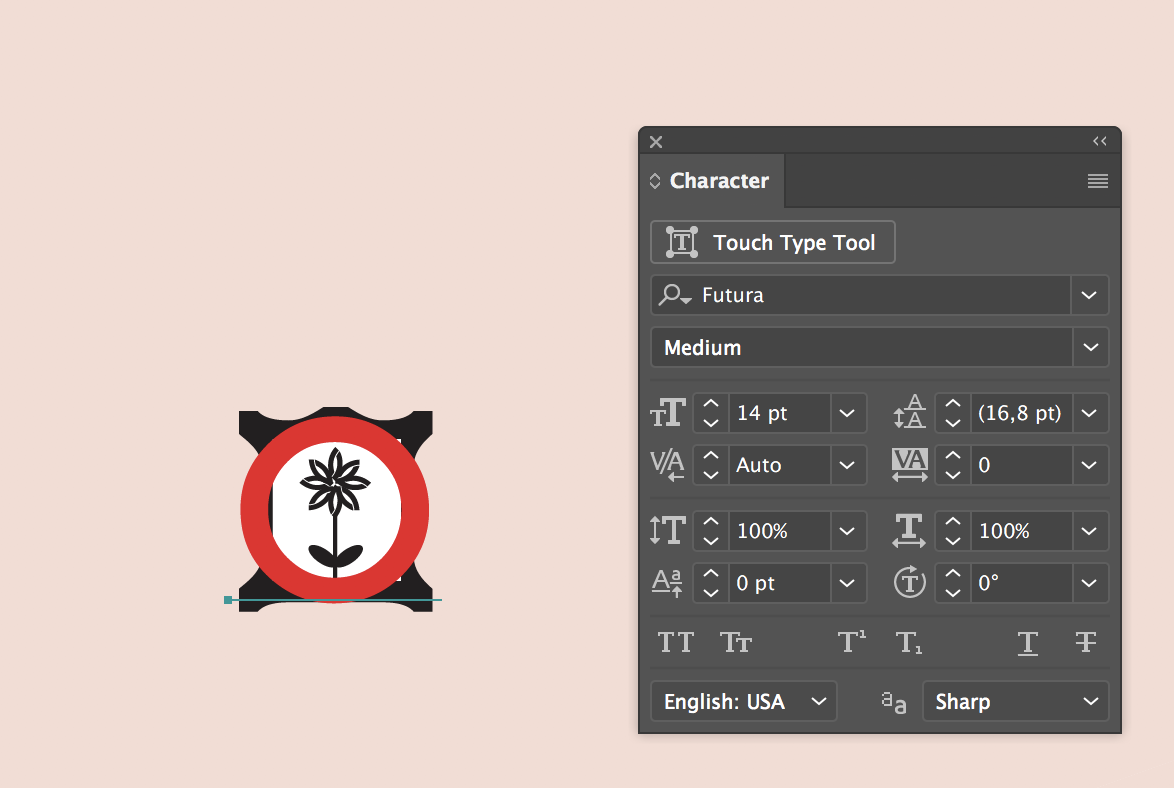
Next, determine how big the symbols are. On the artboard, use the Type tool to place a capital O and adjust its size so that it’s about the same size as one of the point symbols. In this case, a 14 pt Futura Medium, shown here in red, seems to cover it well (your results might be different).
Determine the approximate font size
Futura is a good font in this case because the O is a perfect circle. Once you’ve determined the approximate font size to use, delete the O text as it won’t be needed anymore.
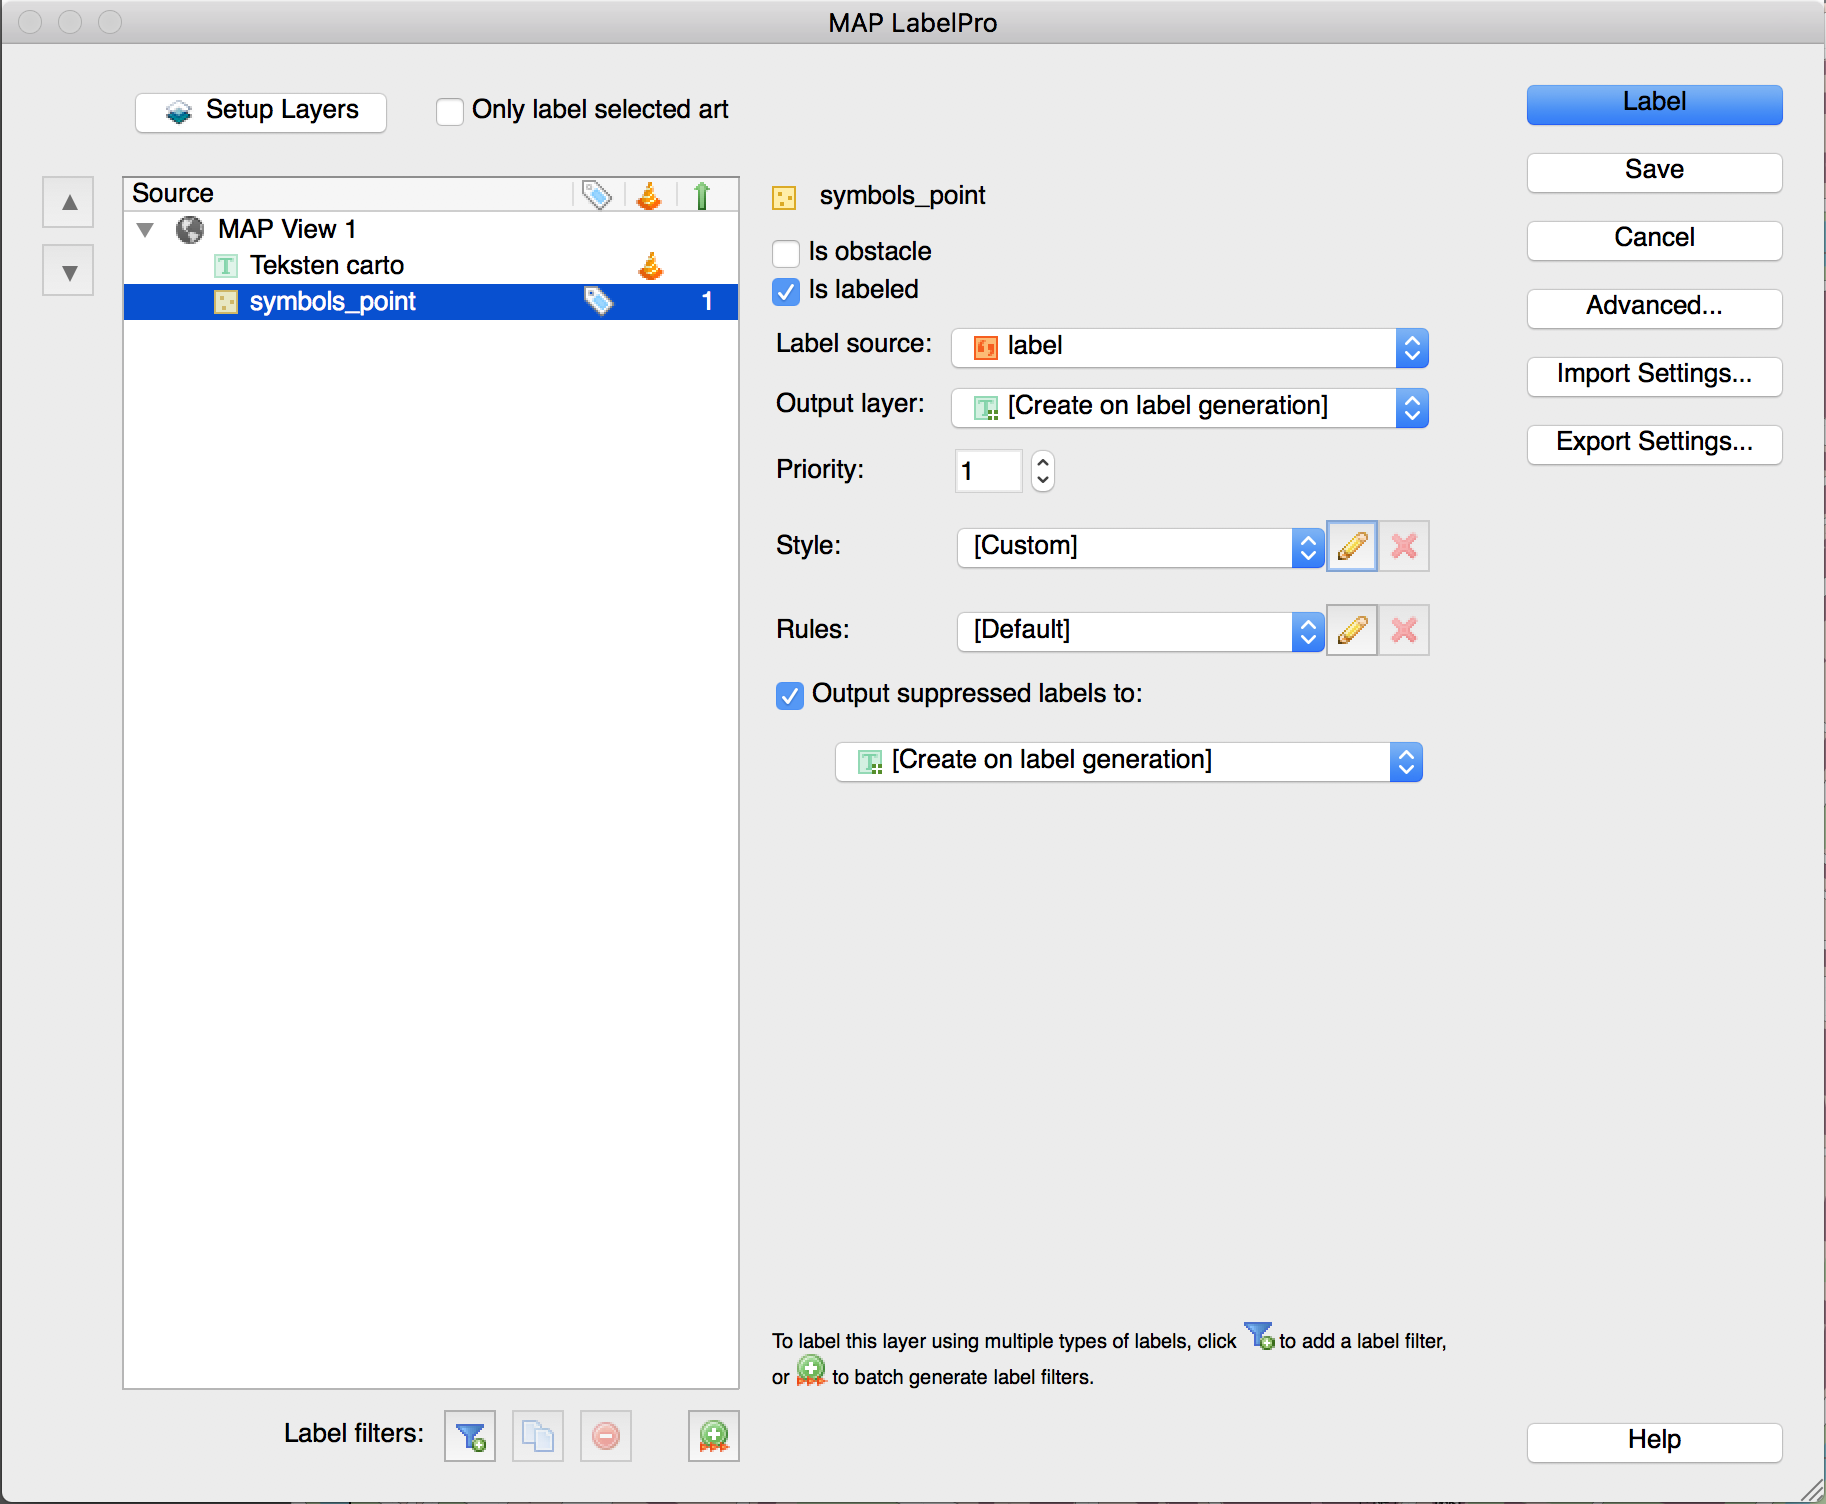
Next, set up the LabelPro labelling rules. Since there is already a layer with the manually placed labels and the symbols shouldn’t interfere with them, the manually placed labels will be designated as an obstacle layer. The symbols layer will be labelled with the attribute created earlier and the style set to the font and size that was just determined.
Set obstacle layer
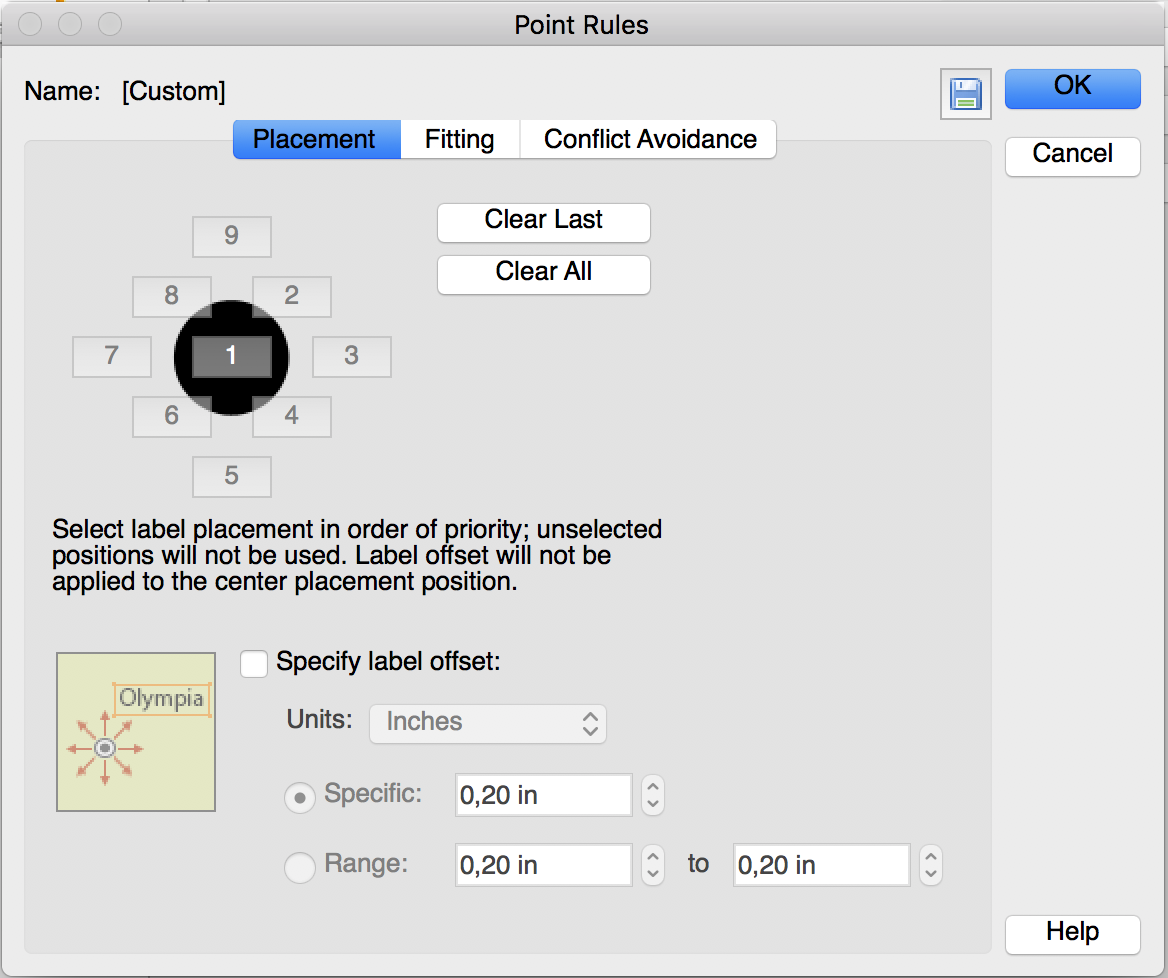
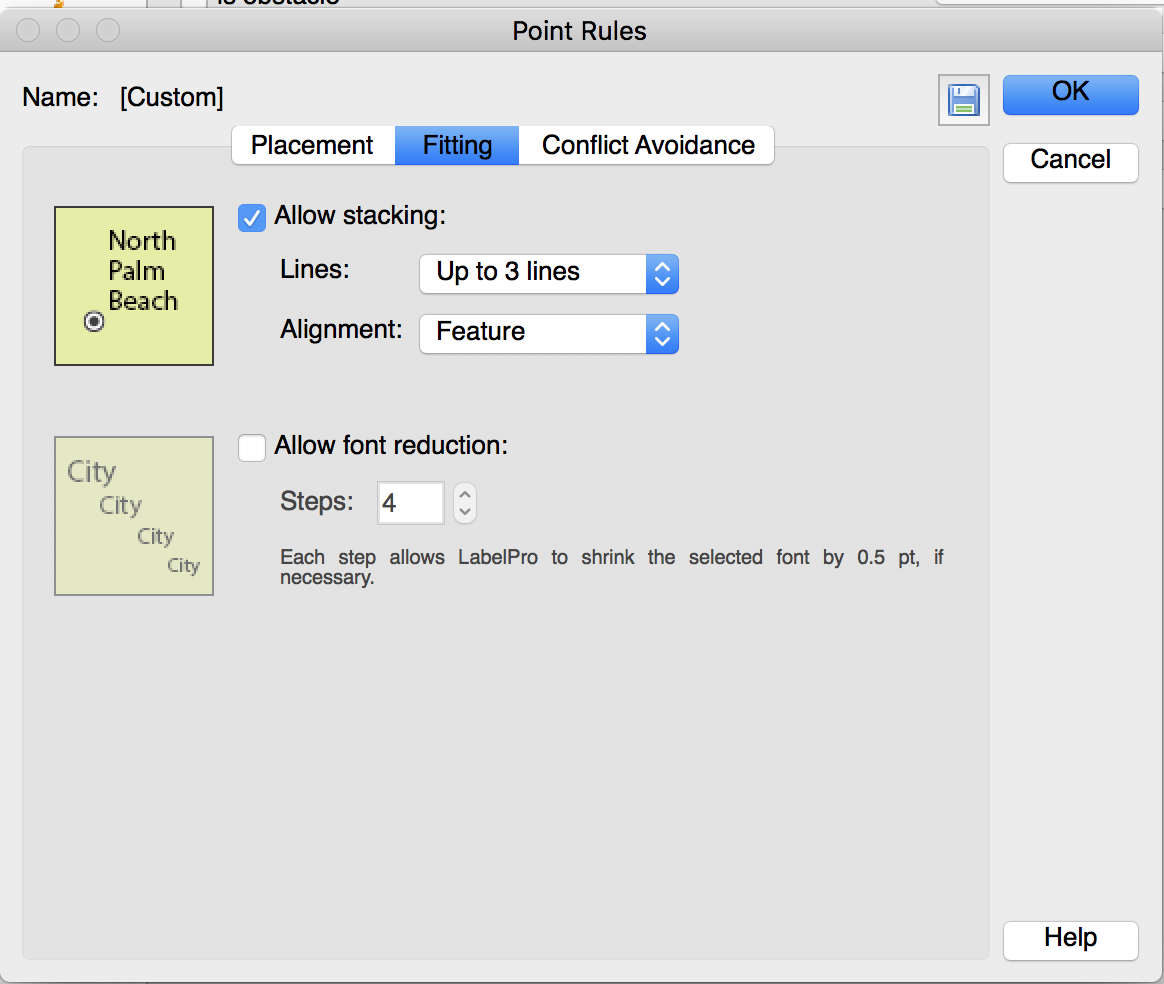
Setting the appropriate rules partly depends on personal preference but it’s important to specify that the placement prefers the center position (position 1 on the placement control). In other words: if there’s enough space for placement, the label doesn’t need to be moved or offset. Another important rule to configure is that font reduction should be turned off. All of the labels (eventually symbols) are going to be a fixed and similar size.
Set placement point rulesSet fitting point rules
Also, another good practice is to specify a suppression layer. Any labels that can’t be placed with the rules set will be placed on the suppression layer. After placement, you can determine if any labels need to be adjusted manually.
Let’s label! Go ahead and label with these settings and afterward hide the original symbols layer and the suppression layer. The map is filled with O’s where the original symbols are located.
O labels placed
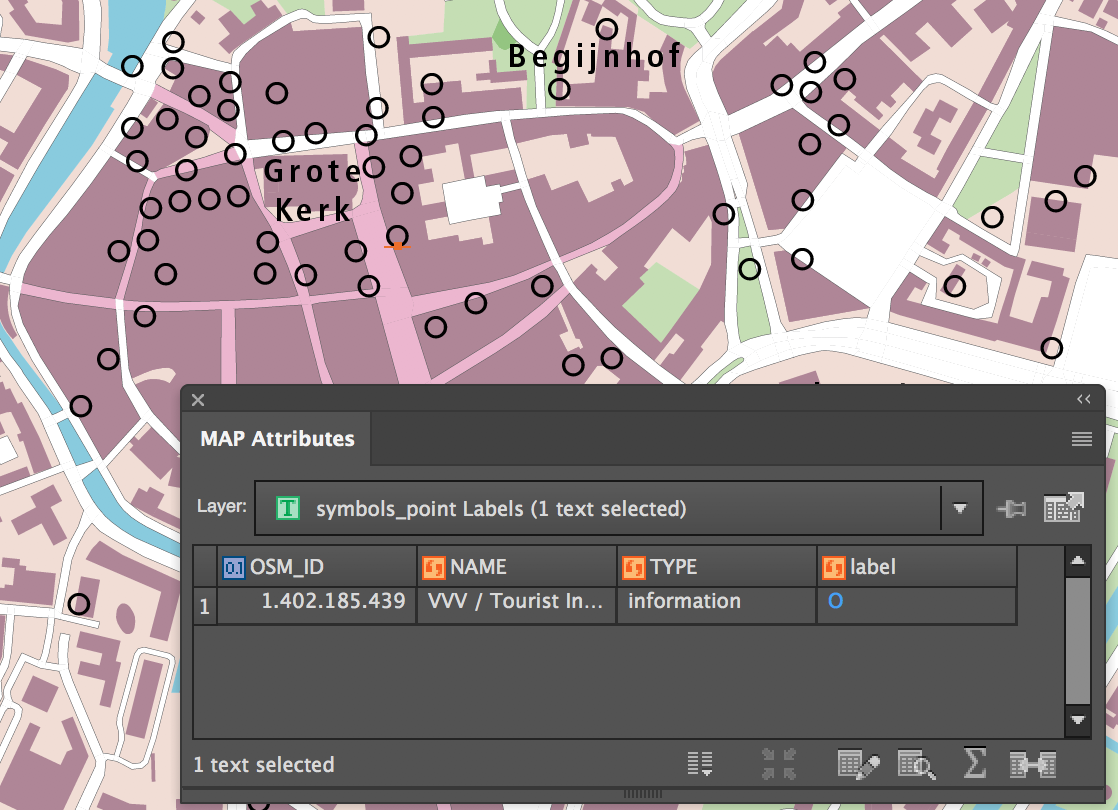
At first glance, this does not seem very useful, but closer inspection shows that the labels have retained the attributes of the original OSM point symbols.
Attributes migrated to the O labels
This means that if they can be turned back into points, they will be able to be styled!
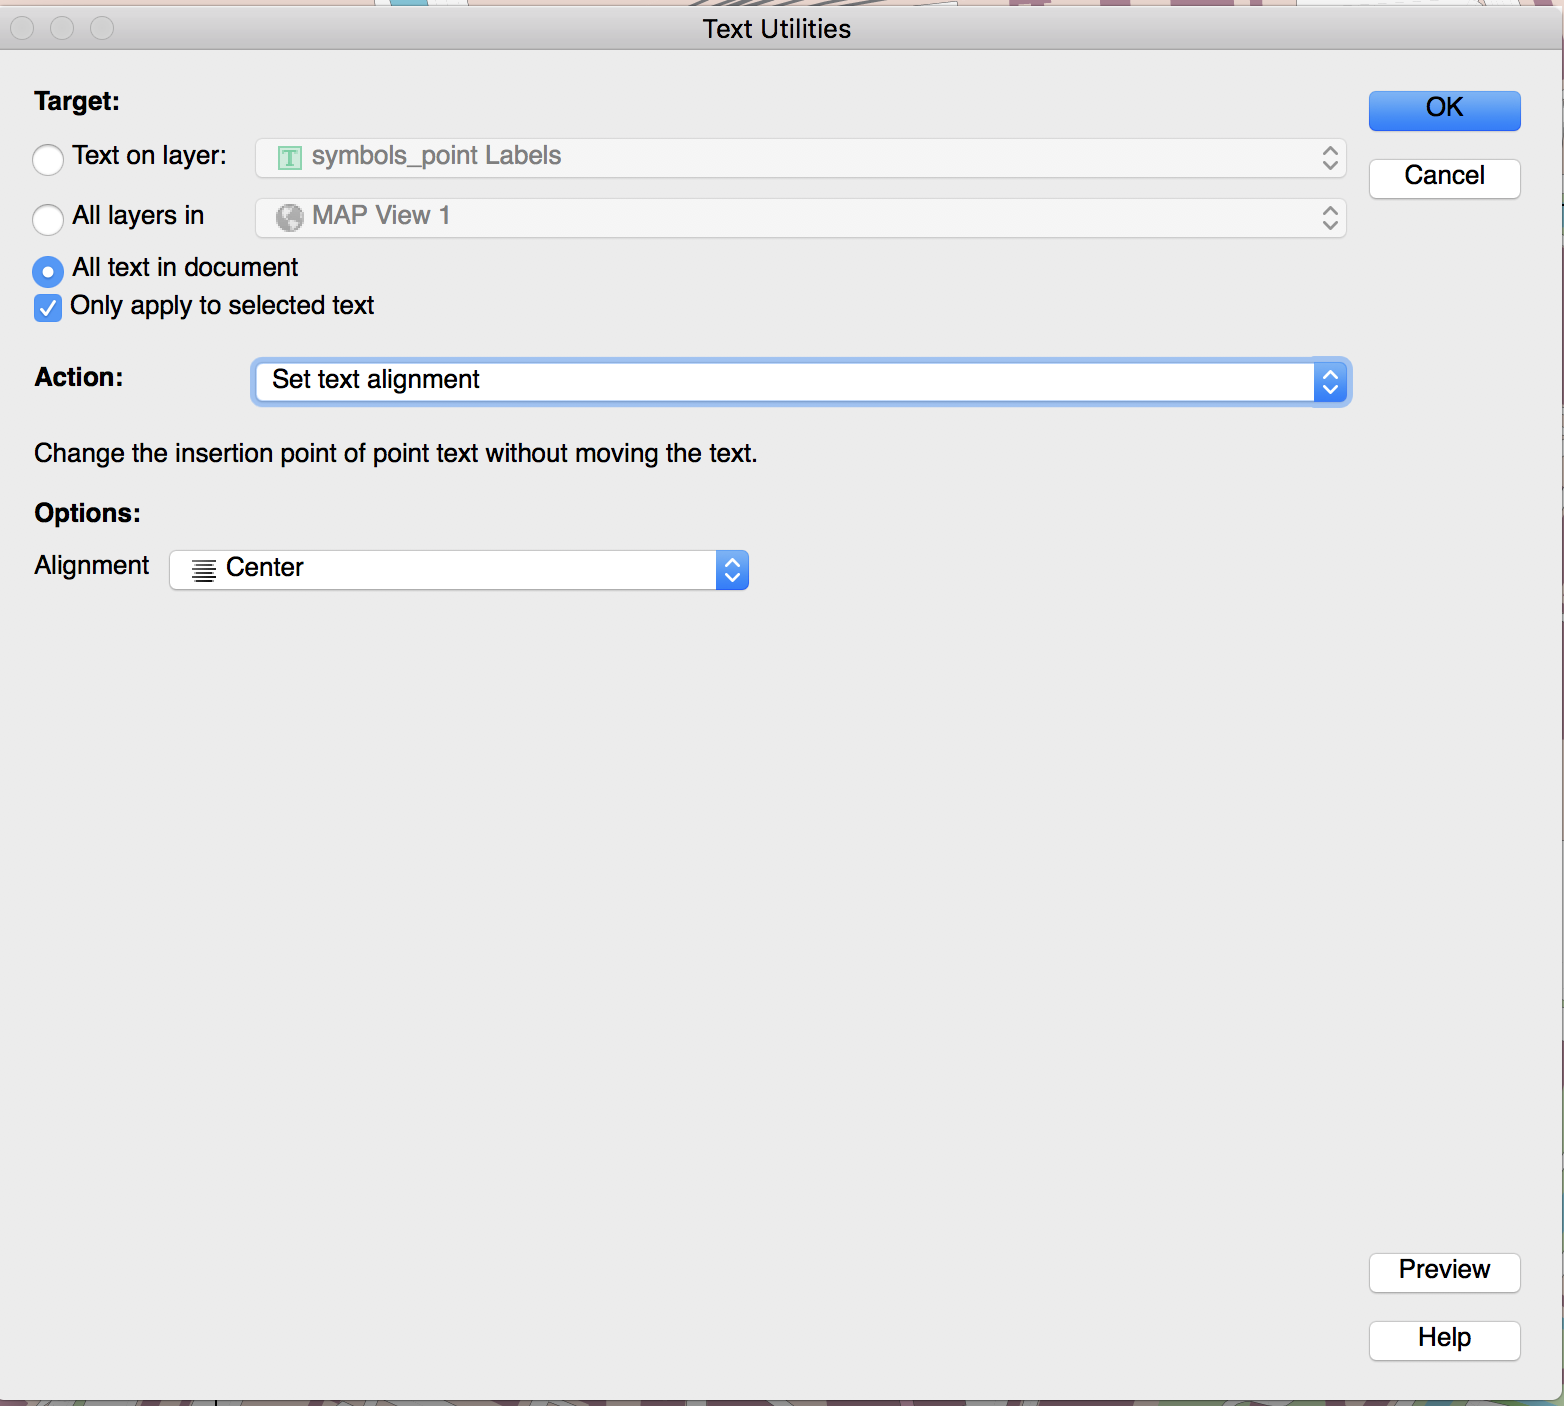
In order to turn them back into points, a text reference point needs to be created. In other words: a little dot on the text selection line, in the center of the O. This is a two-step process. First, select all the O’s on the artboard, open MAPublisher Text Utilities, and set the Action to Set text alignment and Alignment to Center. This action changes the alignment of the text without changing the actual position of the text (due to LabelPro labeling the text alignment is different based on where the label ended up in relation to the original point). This step takes care of the horizontal positioning.
Set text alignment in MAPublisher Text Utilities
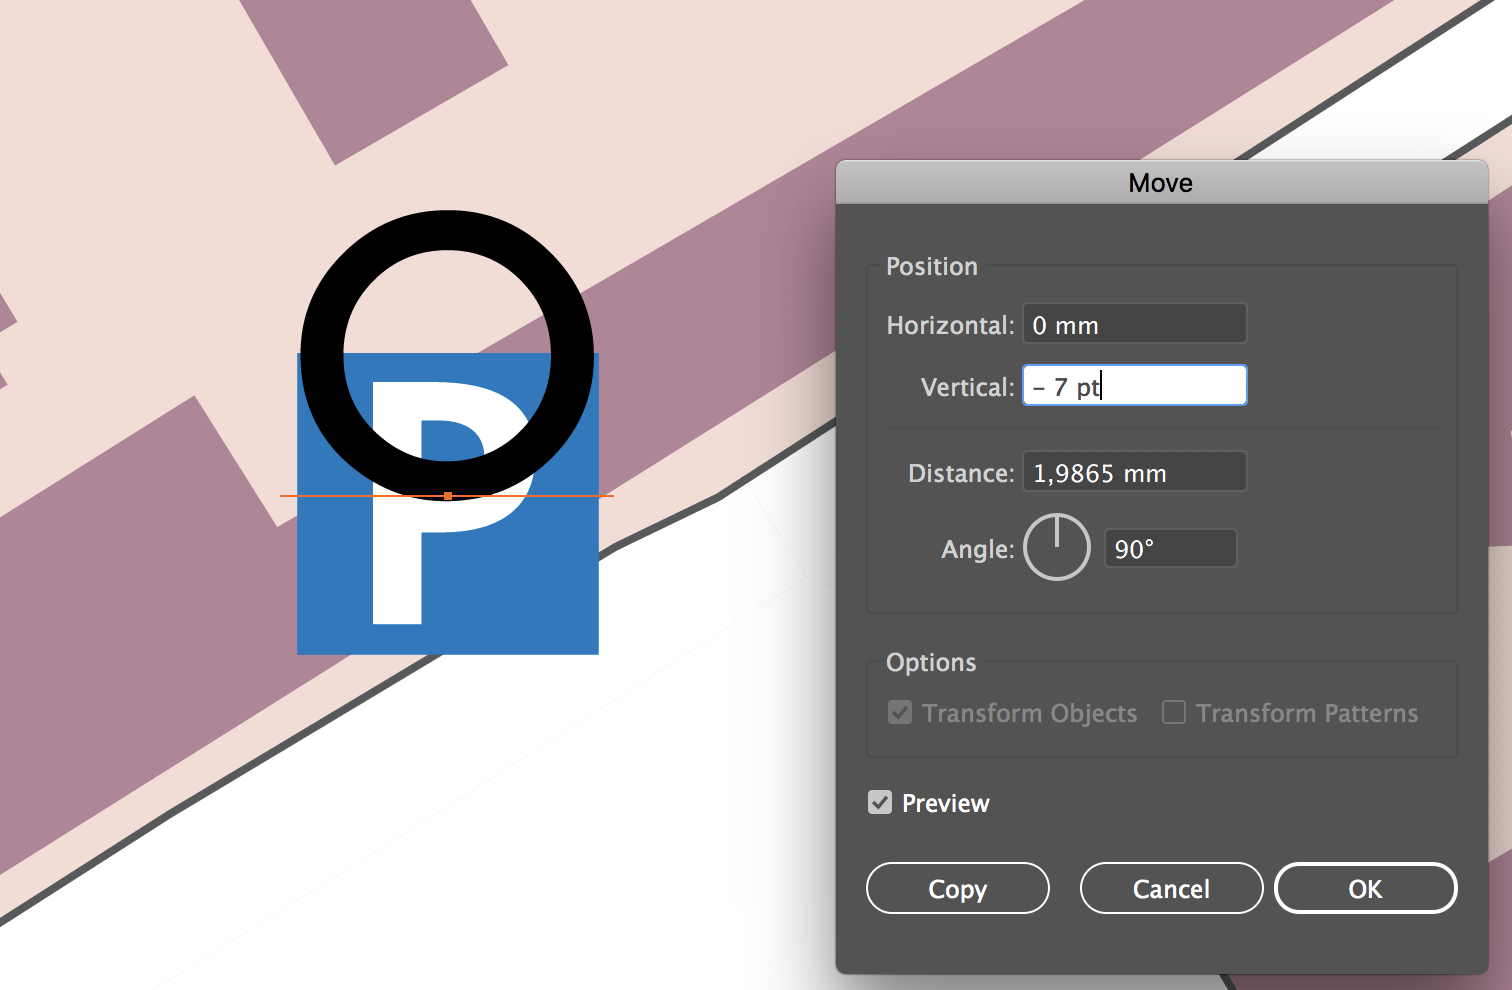
The second step is to adjust vertical positioning. Vertical positioning is adjusted by moving all text up by a certain distance. Make sure all the O’s are selected, then use the (Adobe Illustrator) Move tool. In the Position group, set the Horizontal to 0 (no adjustment here since Text Utilities was used), set the Vertical to minus half the text size (font size in this example was 14 pt, so a vertical adjustment of -7 pt), and the Angle to 90 degrees.
Use the Move panel to fine tune position
For reference, this example is zoomed into a symbol that did not get displaced.
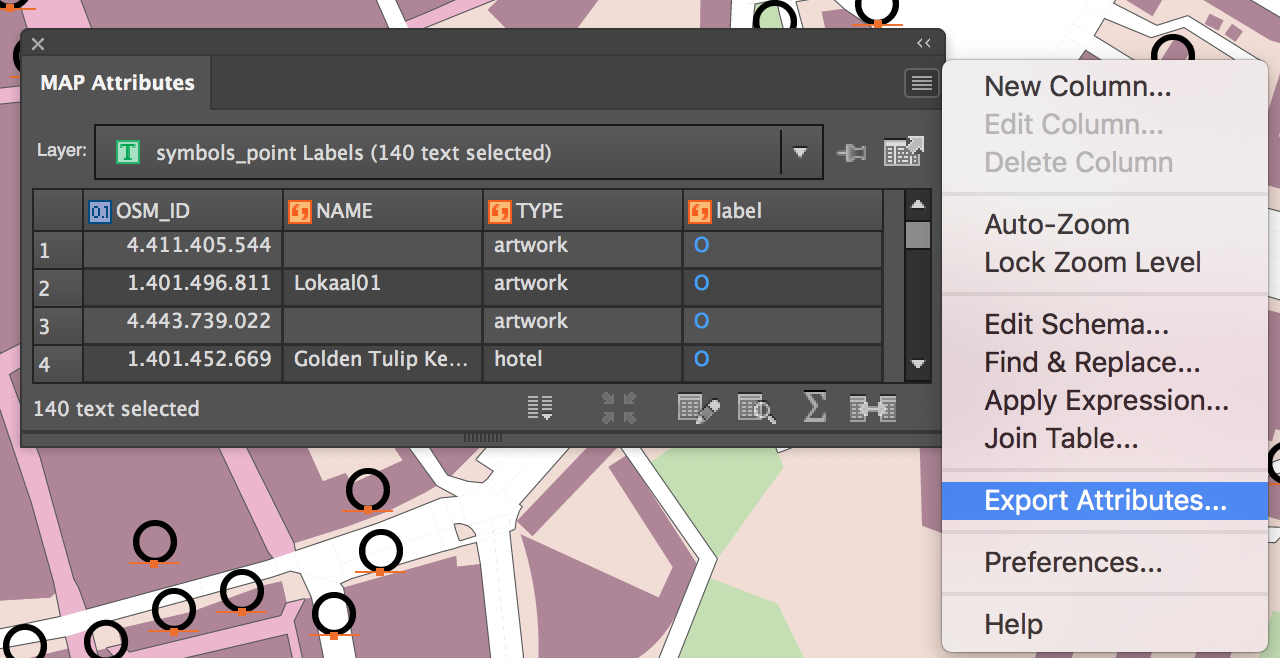
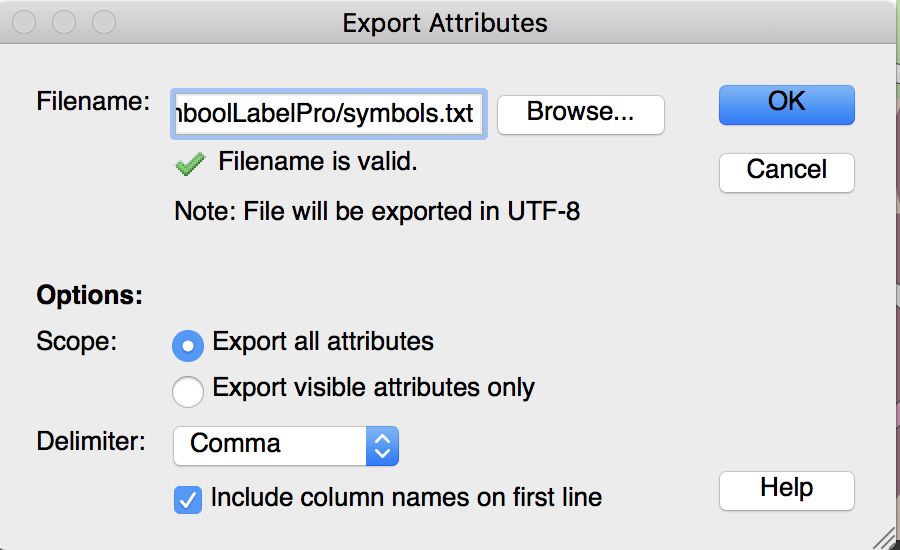
Next, these labels need to be turned into point symbols. There is a handy option in MAPublisher Text Utilities that can do that, but it places a point to the lower left of the text and the symbols need to use the center text reference point that was just created. Instead, with all of the O labels selected, open the MAP Attributes panel and export the attribute table to a text file. Make sure to specify the option Export All Attributes because there are two important hidden attributes needed to make this work: #MapX and #MapY, which are the coordinates of the text reference point.
Export attributes to a .txt file (Click for larger version)Export attributes to a .txt file
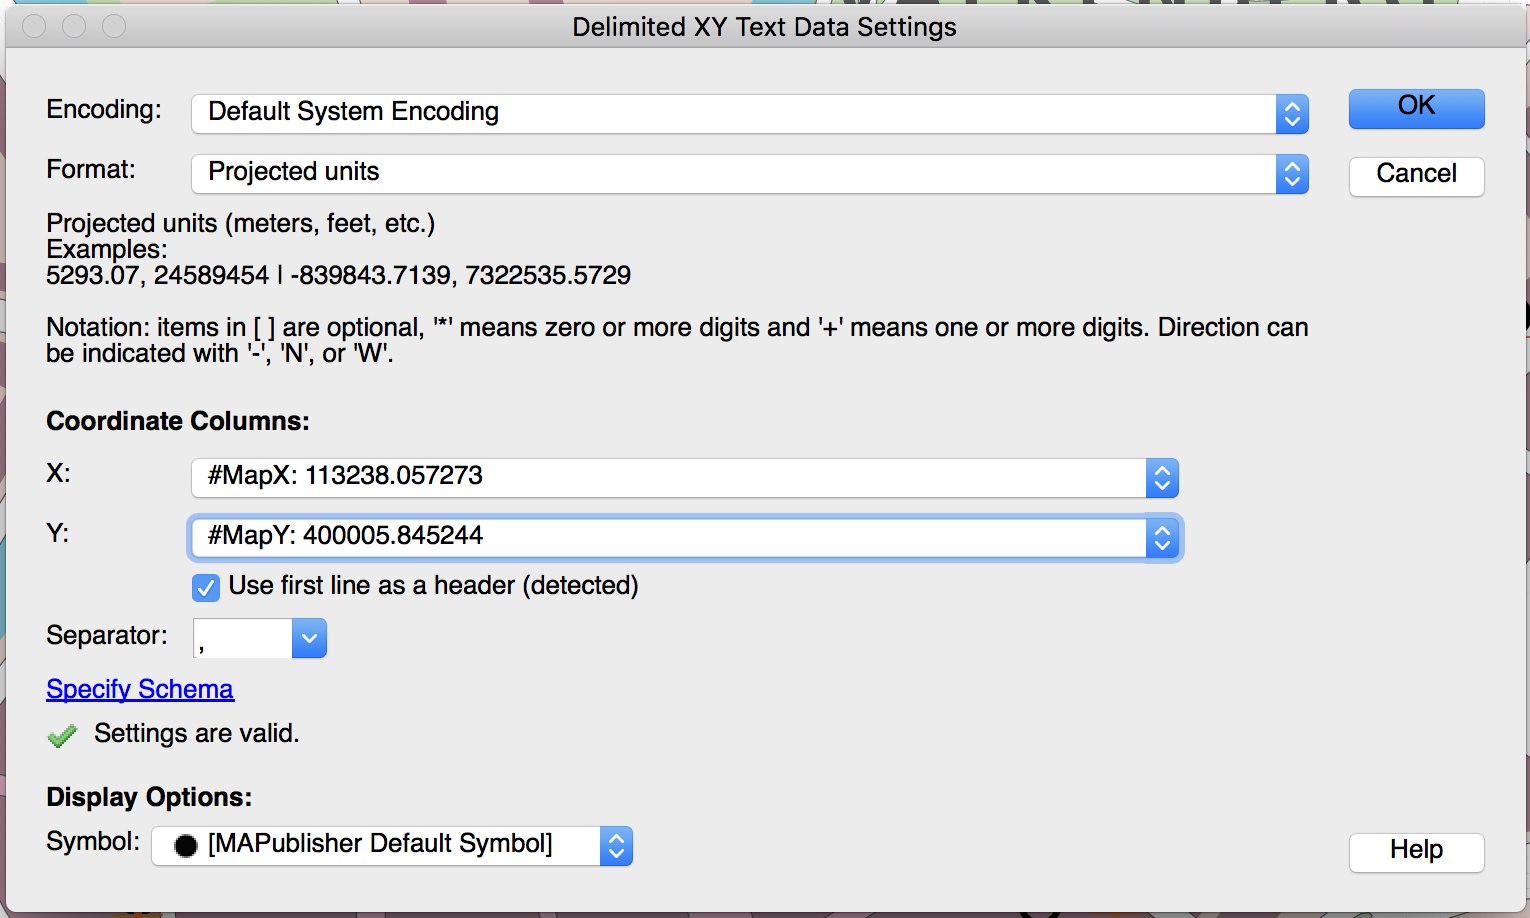
Using MAPublisher Import, add the attributes text file that was just created to the map and make sure to appropriately specify #MapX and #MapY in the X and Y coordinate columns.
Import .txt file as Delimited XY
Since there is no projection information stored in the text file, you’ll need to specify that the coordinates are in the same system as the MAP View it’s coming from and you’ll need to add it to that MAP View upon import.
On the map, there is now a new point layer and because they still have all of their original attributes, the layer can simply be added to the MAP Theme to have all the point symbols reapplied to them instantly. Let’s admire the results:
Symbols reapplied with MAP Themes
If needed, repeat the last few steps for the suppressed labels as well (to a different file and different layer of course) to see what still needs to be done manually.
INTERGEO is the world’s leading conference trade fair for geodesy, geoinformation and land management. With over half a million event website users and more than 17,000 visitors from 107 countries at INTERGEO itself, it is one of the key platforms for industry dialogue around the world, and covers a wide variety of fields ranging from surveying, geoinformation, remote sensing and photogrammetry to complementary solutions and technologies.
Avenza product specialists will be present to demonstrate and discuss MAPublisher, Geographic Imager, and the Avenza Maps app during each day of the exhibition. Visit us in booth #C3.064 in Hall 3.
Don’t miss this chance to share knowledge and expertise with Avenza and other specialists. The INTERGEO conference, presentations, and forums give you the opportunity to find out about the latest technologies and discuss them with experts.
Date: September 26 – 28, 2017 Venue: Messe Berlin, South Entrance Venue Address: Messedamm 22
14055 Berlin
Visit the INTERGEO site or email us for more information and how to register, or to make an appointment with an Avenza staff member.
The Interagency Visual Media Group (IVMG) Annual Meeting will take place in Washington, D.C., USA, September 27, 2017.
Avenza will be participating as an exhibitor at the annual meeting. Avenza product specialists will be available to discuss how Avenza Maps technology is changing the cartography industry and how MAPublisher and Geographic Imager desktop mapping solutions can be a great fit for your organization.
Who can attend the annual meeting?
All government civilian, military, and contract visual media professionals who support the national security mission are invited to attend the IVMG annual meeting at no charge. Previous attendees include video producers, photographers, graphic designers, and web developers — among others — from the Intelligence Community and the Department of Defense.
Why attend?
The IVMG annual meeting is a great way to network with your media peers throughout the IC, learn new skills, and be inspired! This year’s event marks the 10th anniversary of the organization. It will be a great celebration of the past with an eye toward the future. Although the event is being hosted by NGA, all sessions are held at the unclassified level. In addition, this year’s event will include more than 20 industry technologies and products, which will be showcased during the Technology Exposition.
Whether you’re new to MAPublisher®, an experienced user, or simply thinking about a purchase, Avenza software training is a worthwhile experience. Get hands-on training from Avenza product specialists at one of our training courses around North America.
Who should attend?
GIS professionals who want to produce better quality maps
Map makers and cartographers incorporating GIS data to improve accuracy in their maps
New MAPublisher users who just purchased a license
Users who want to experience the latest features of MAPublisher
Cost
Cost of the two-day training course is $1,000 USD per person. Discounts are available to groups of three or more from the same organization and for returning students desiring a refresher or update. Major credit cards are accepted.
Training details
Hands-on training takes place at a training center classroom where Windows computers and all required software and training data are provided.
Attendees will learn the fundamentals of MAPublisher and learn how to use all major features. Attendees will also receive basic instruction on the use of Adobe Illustrator as it relates to MAPublisher and cartographic production. A basic knowledge of Adobe Illustrator is recommended, but not required.
Attendees are encouraged to bring his or her own datasets. There will be some time during the end of the course to discuss these with an instructor.
Attendees that are Mac users may opt to bring his or her own Mac and software. Make sure to inform Avenza a week before training to setup the system properly for training.
Classes may be cancelled up to seven business days prior to the confirmed training date (depending on the number of reservations received).
Join Avenza Systems, mapmakers, map users, map librarians, and map enthusiasts in Montreal, QC, Canada this October 10-13, 2017 to share research, recent projects, and expertise with colleagues from around the world. The meeting will be held at Le Centre Sheraton, Montreal.
Avenza product specialists will be present to demonstrate and discuss MAPublisher, Geographic Imager, and the Avenza Maps app during each day of the conference.
Nick Burchell will be presenting an overview of advancements in MAPublisher in 2017 including MAPublisher 10, one of the most exciting releases of the cartographic product in recent years. See the NACIS schedule here.
Avenza will be showcasing at the Frankfurt Book Fair from October 11 to 15, 2017. Visit us in Hall 3.1 Booth J92 where we’ll be featured by the International Map Industry Association (IMIA).
Avenza product specialists will be present to demonstrate and discuss MAPublisher, Geographic Imager, and the Avenza Maps app during each day of the exhibition.
About the Frankfurt Book Fair
The Frankfurt Book Fair is the biggest book and media fair in the world – with around 7,300 exhibitors from around 100 countries.
For more details about the Frankfurt Book Fair, click here.
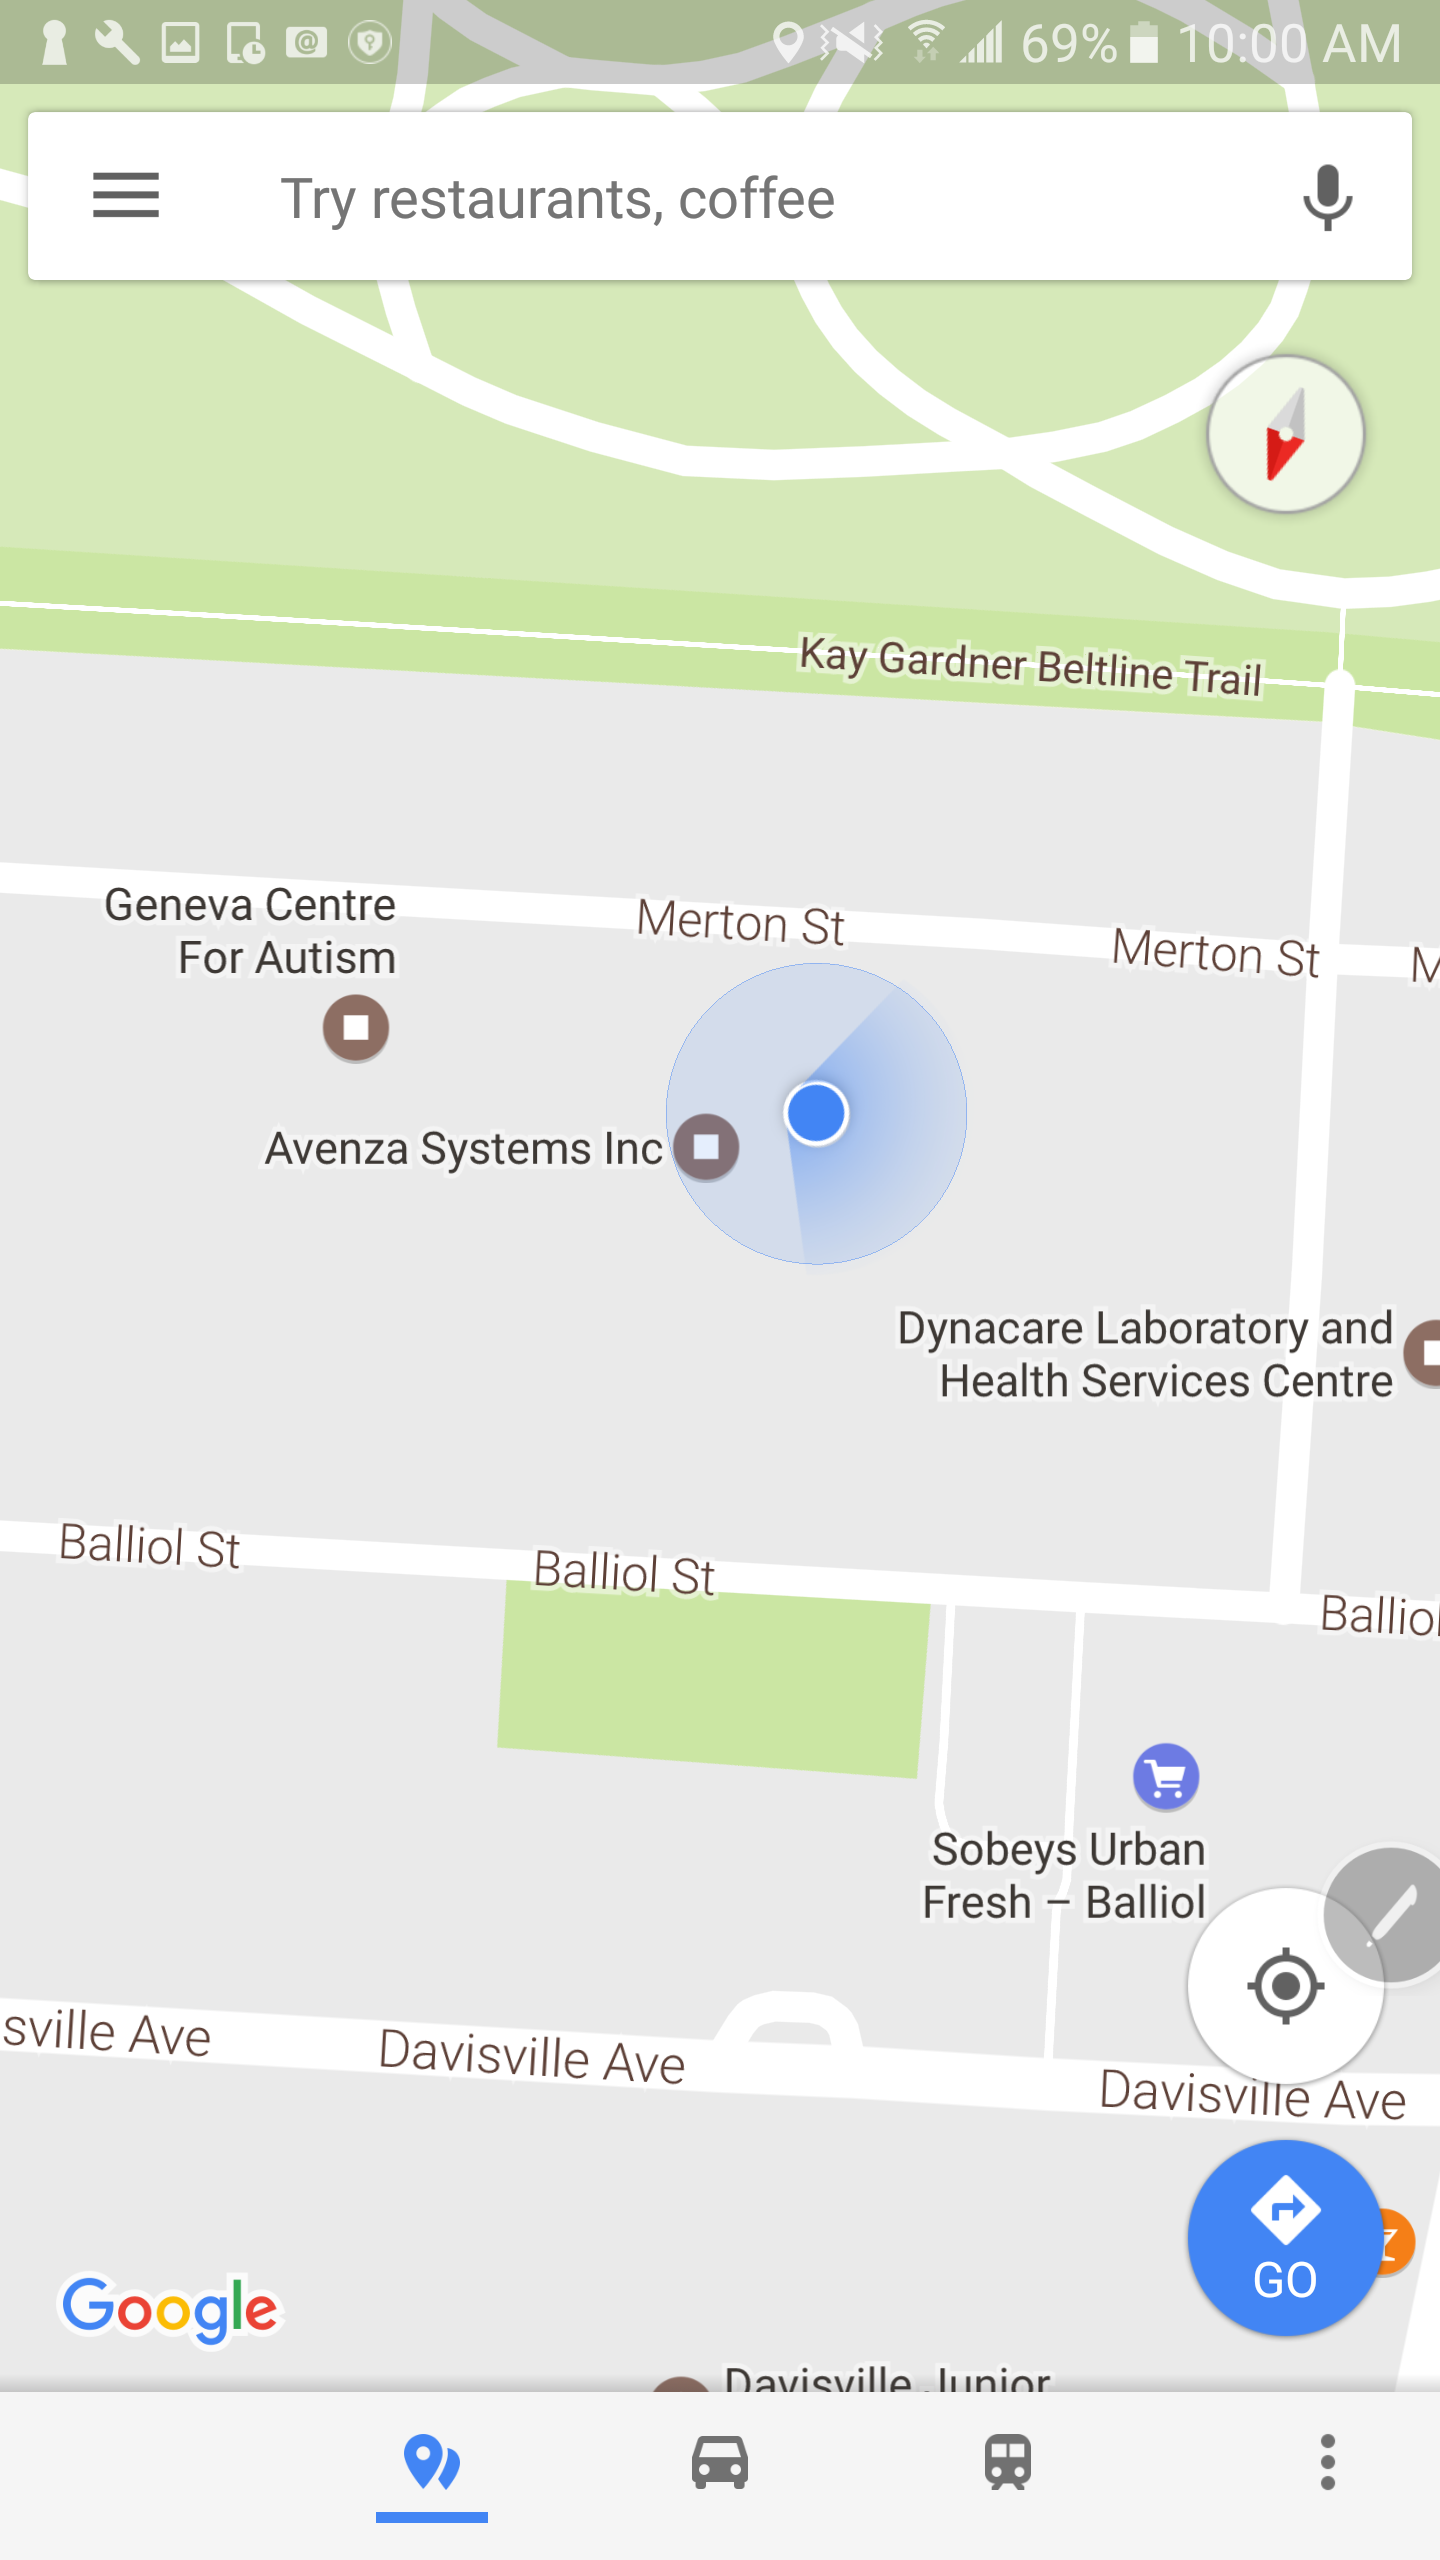
One of the great features of Avenza Maps is being able to navigate offline using your own maps or maps from the Map Store. By tapping the GPS icon twice (once to locate yourself and then again to enable the compass), the map will rotate and align with your compass. Your current location is represented by a blue dot and the little arrow points in the direction you are facing. This feature allows you to navigate easily, however it can be problematic when your devices’ compass isn’t calibrated. If you notice that your blue dot’s arrow is not pointing in the right direction, or isn’t functioning as you’d expect, try these steps to calibrate your device’s compass!
Android
Not calibrated (Android)
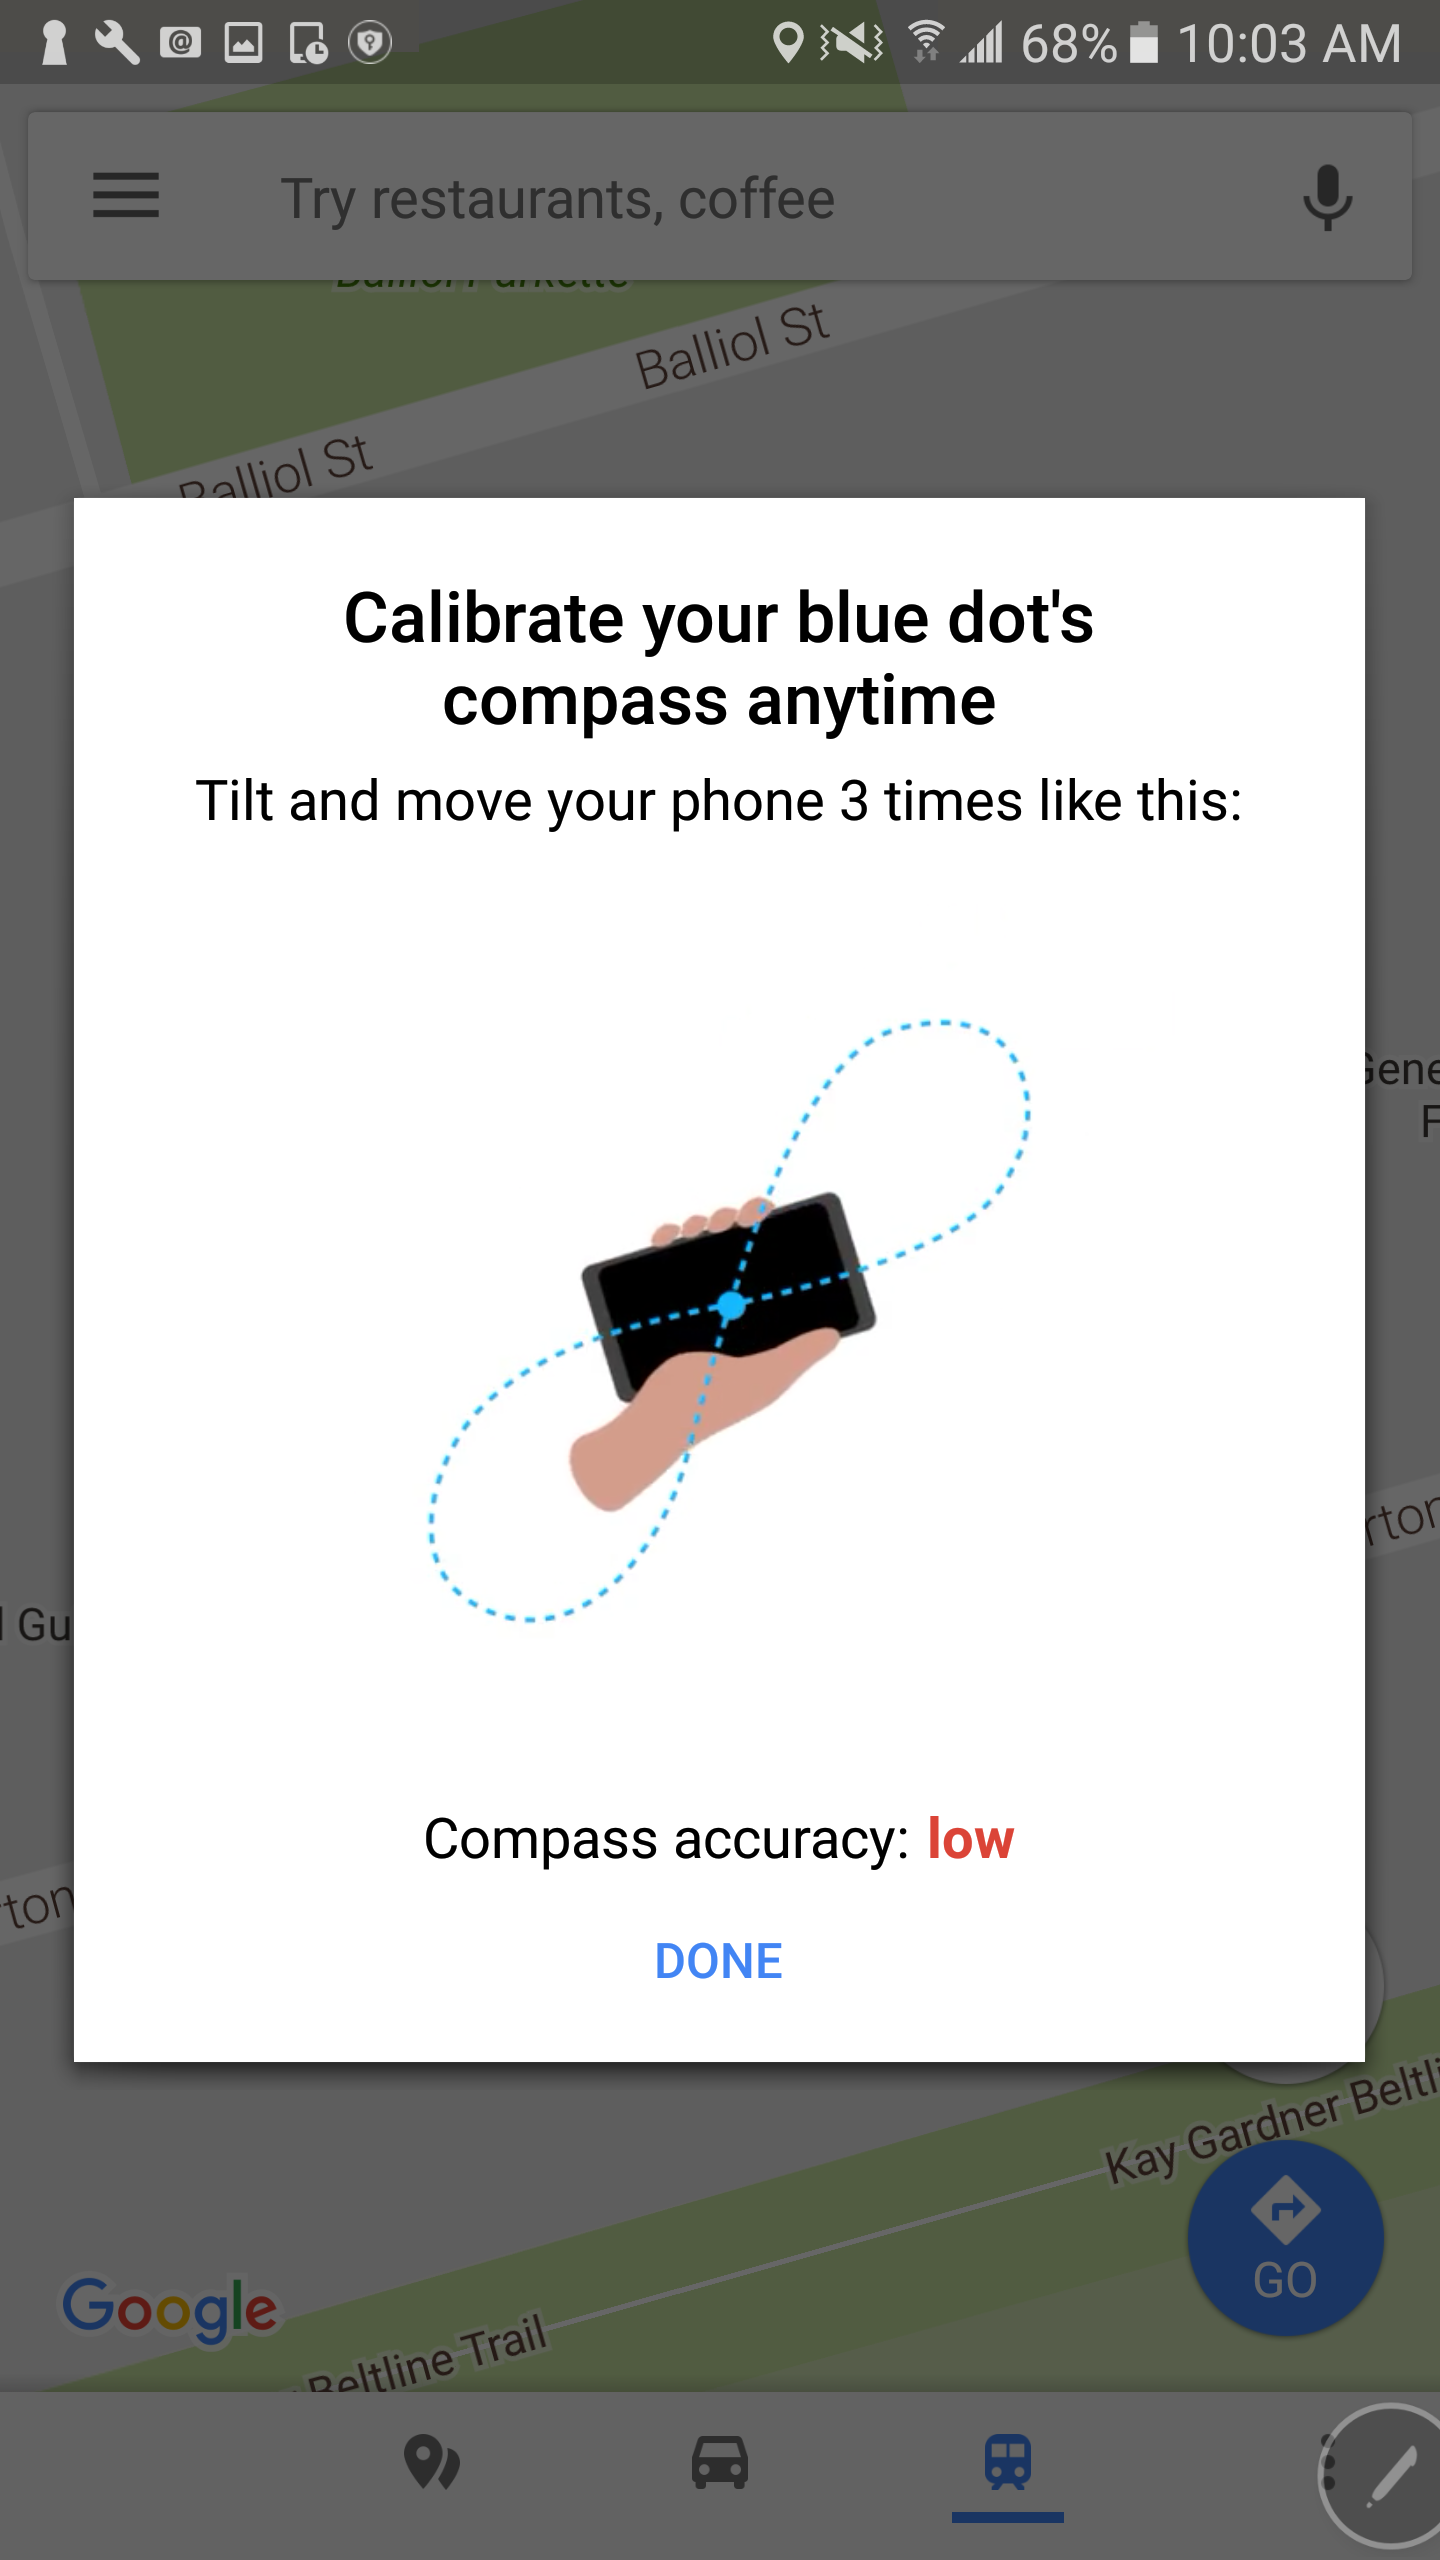
To calibrate your compass on Android, go to your Google Maps app. If your blue dot’s beam (the blue shading coming out of it) is pointing in a different direction to where you are facing or is very wide, your compass will need to be calibrated. To calibrate, tap the blue dot and select “calibrate blue dot compass”. From here, you will be instructed to move and tilt your device in a figure 8 pattern, shown in the following diagram.
Calibrate device (Android)
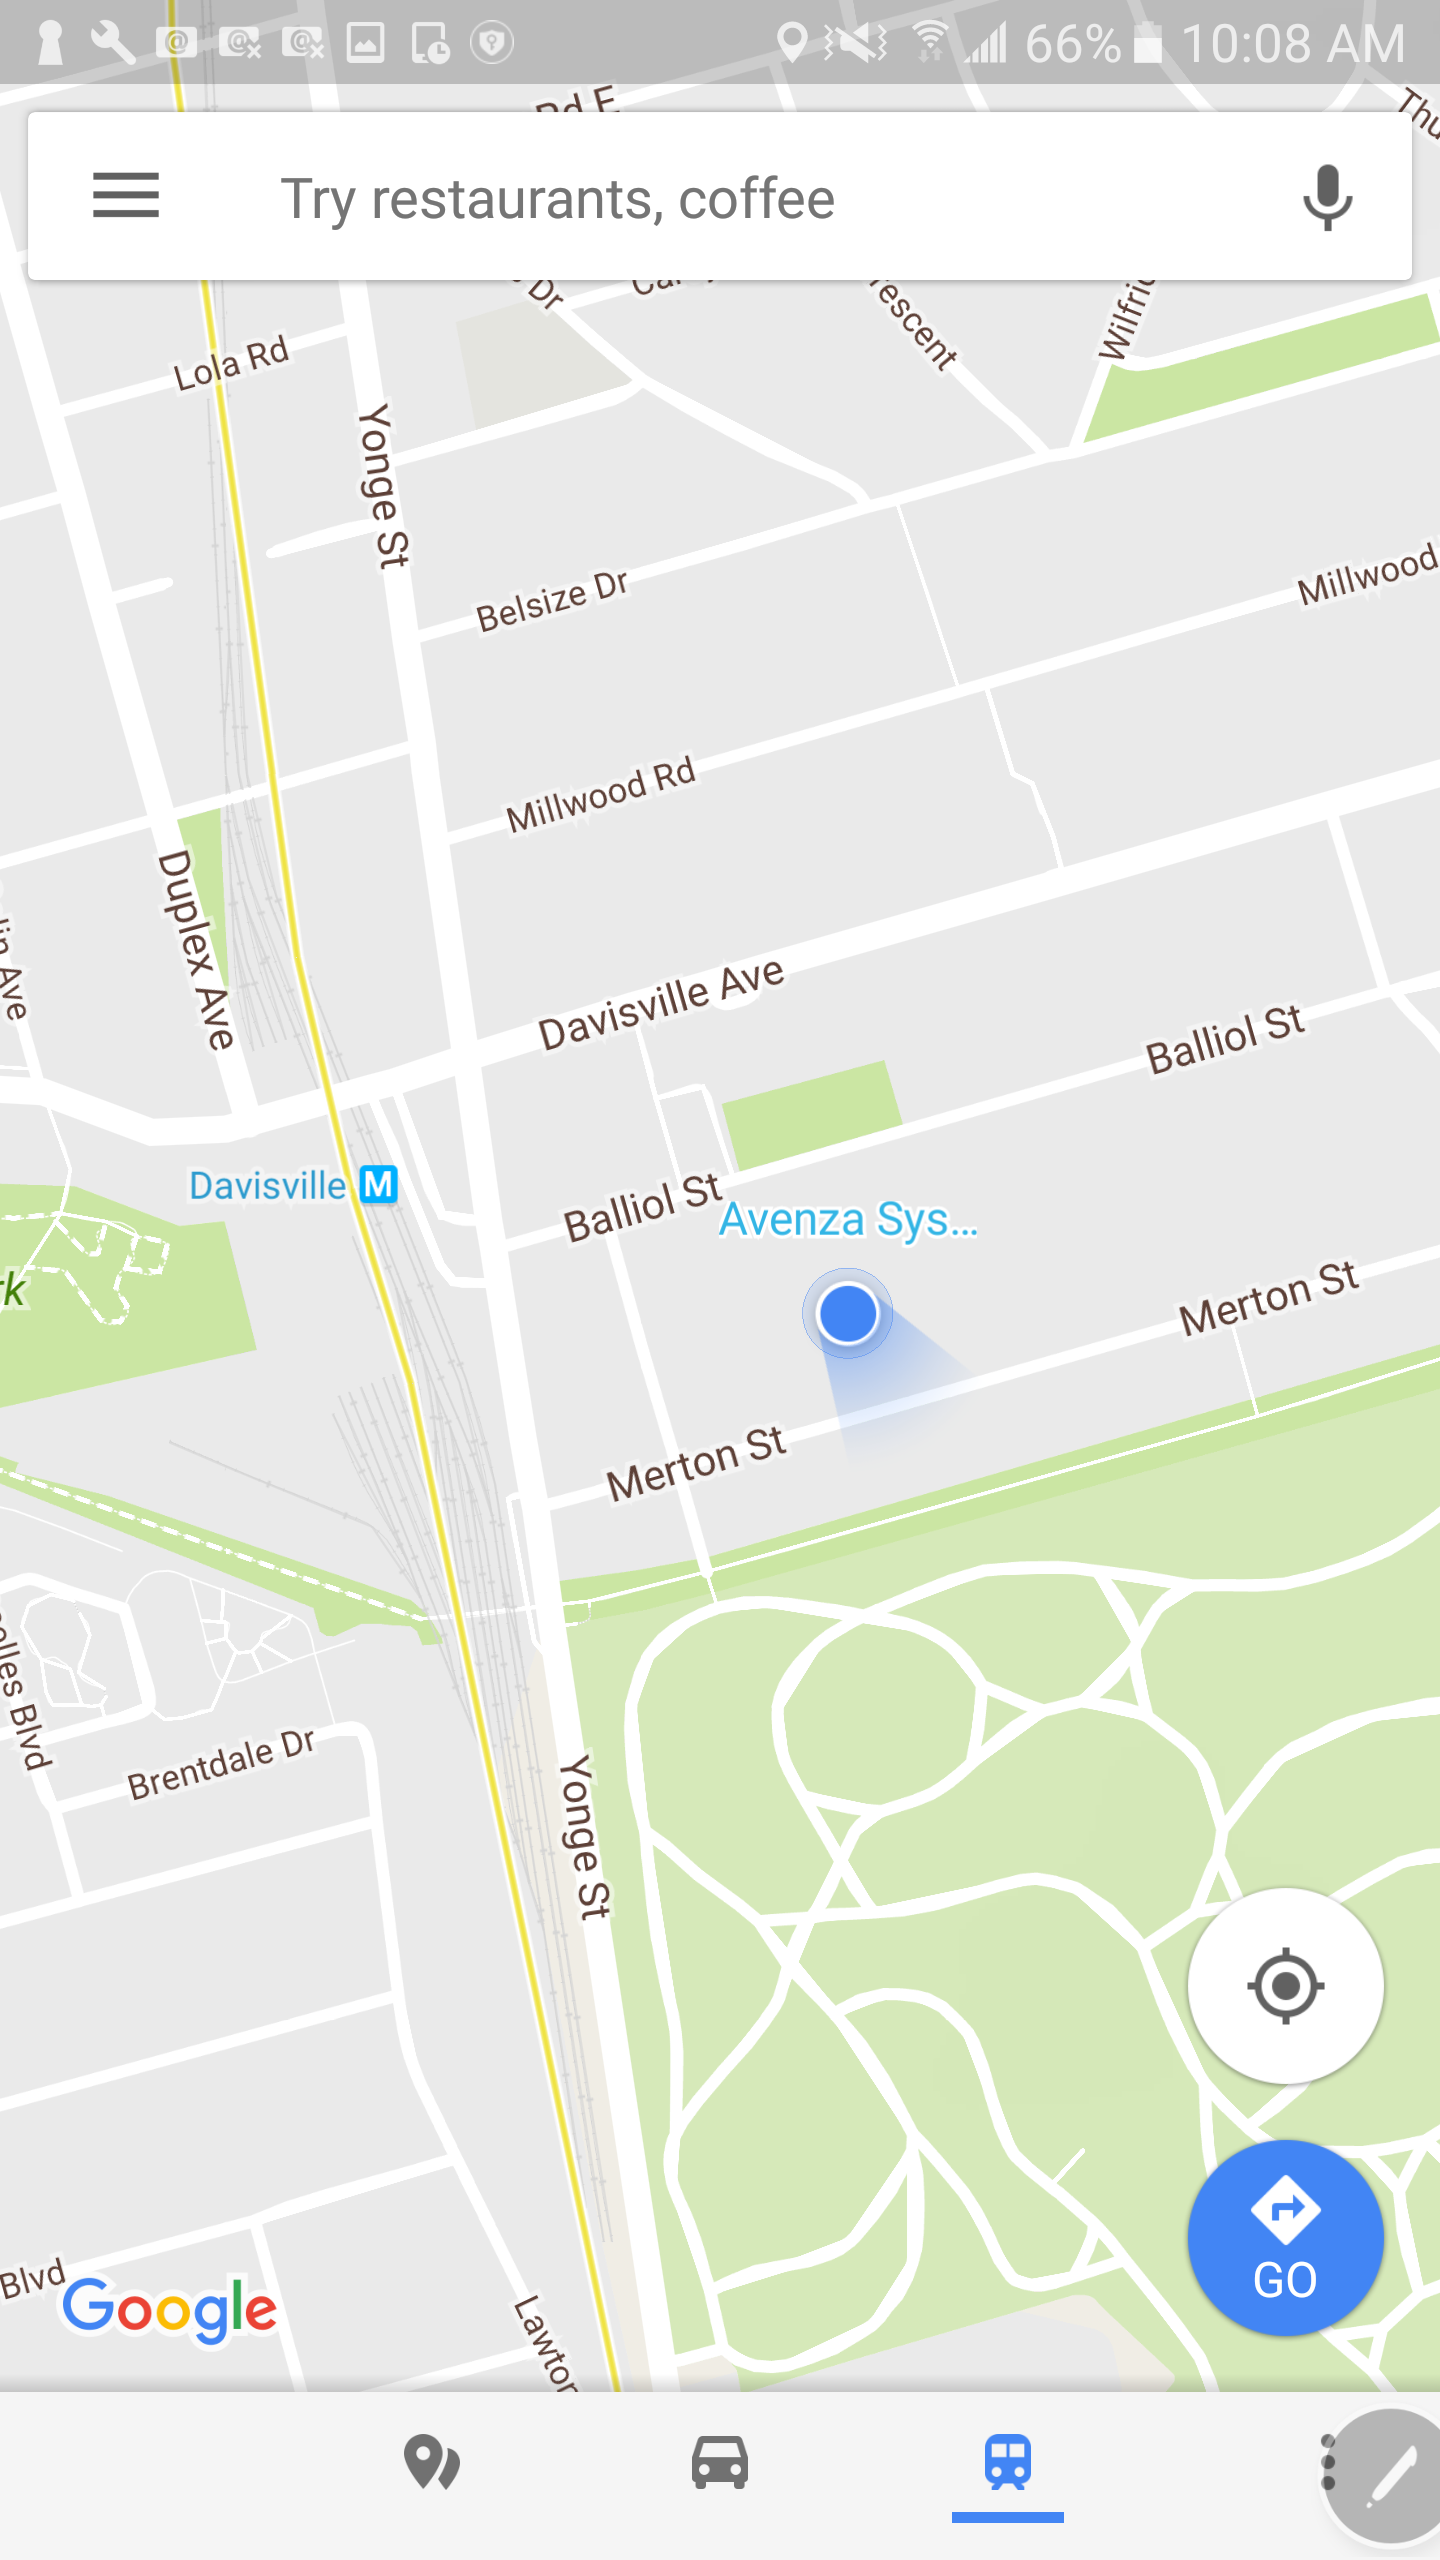
Your compass accuracy will improve as you continue to do this. When you are happy with your compass accuracy, tap Done. The beam from the blue dot on the display will now be narrower and point in the right direction. If at any point the accuracy lowers again, this process can be repeated. If this does not solve your issues, you can select “report blue dot issues” by pressing the blue dot again. For more information, click here.
Calibrated device (Android)
iOS
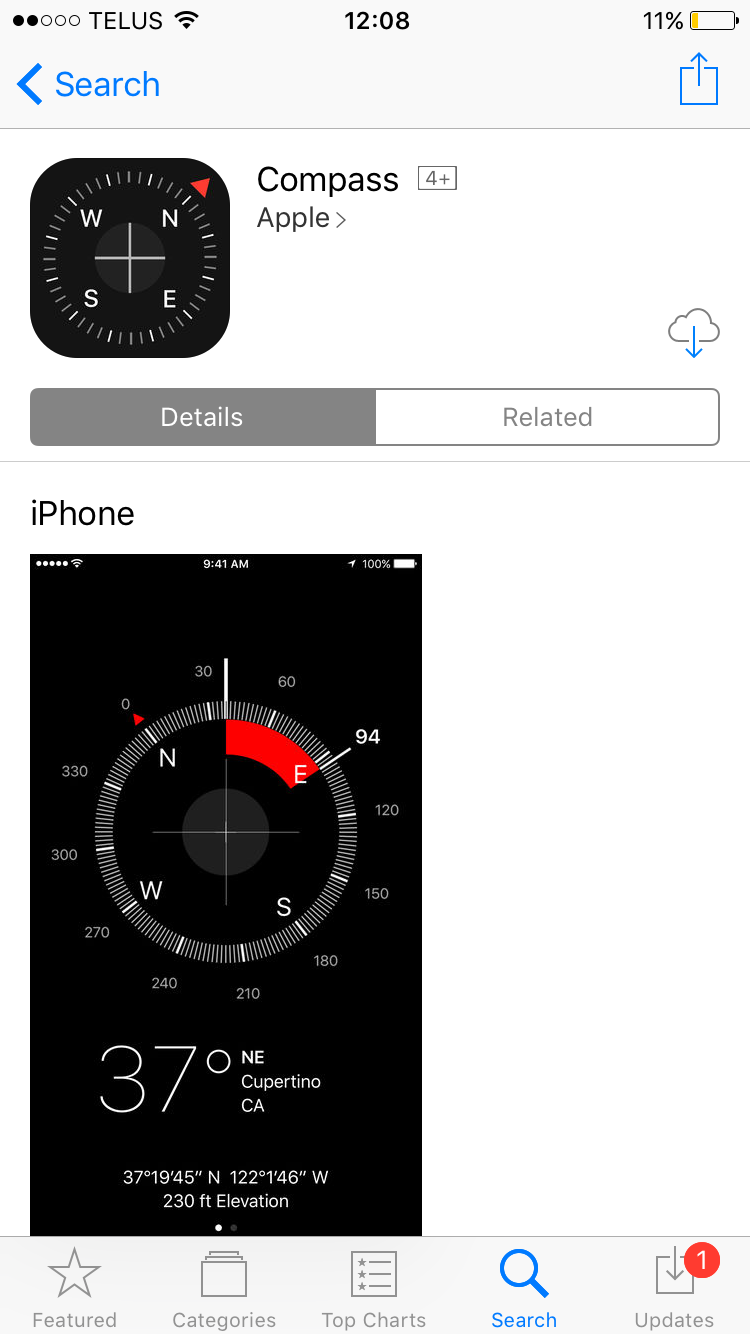
On Apple devices, use the Compass app to calibrate your compass. This app comes pre-installed on iPhone devices. If for any reason it has been deleted, it can be found in the App Store if you search for “Compass”.
Compass app on App Store (iOS)
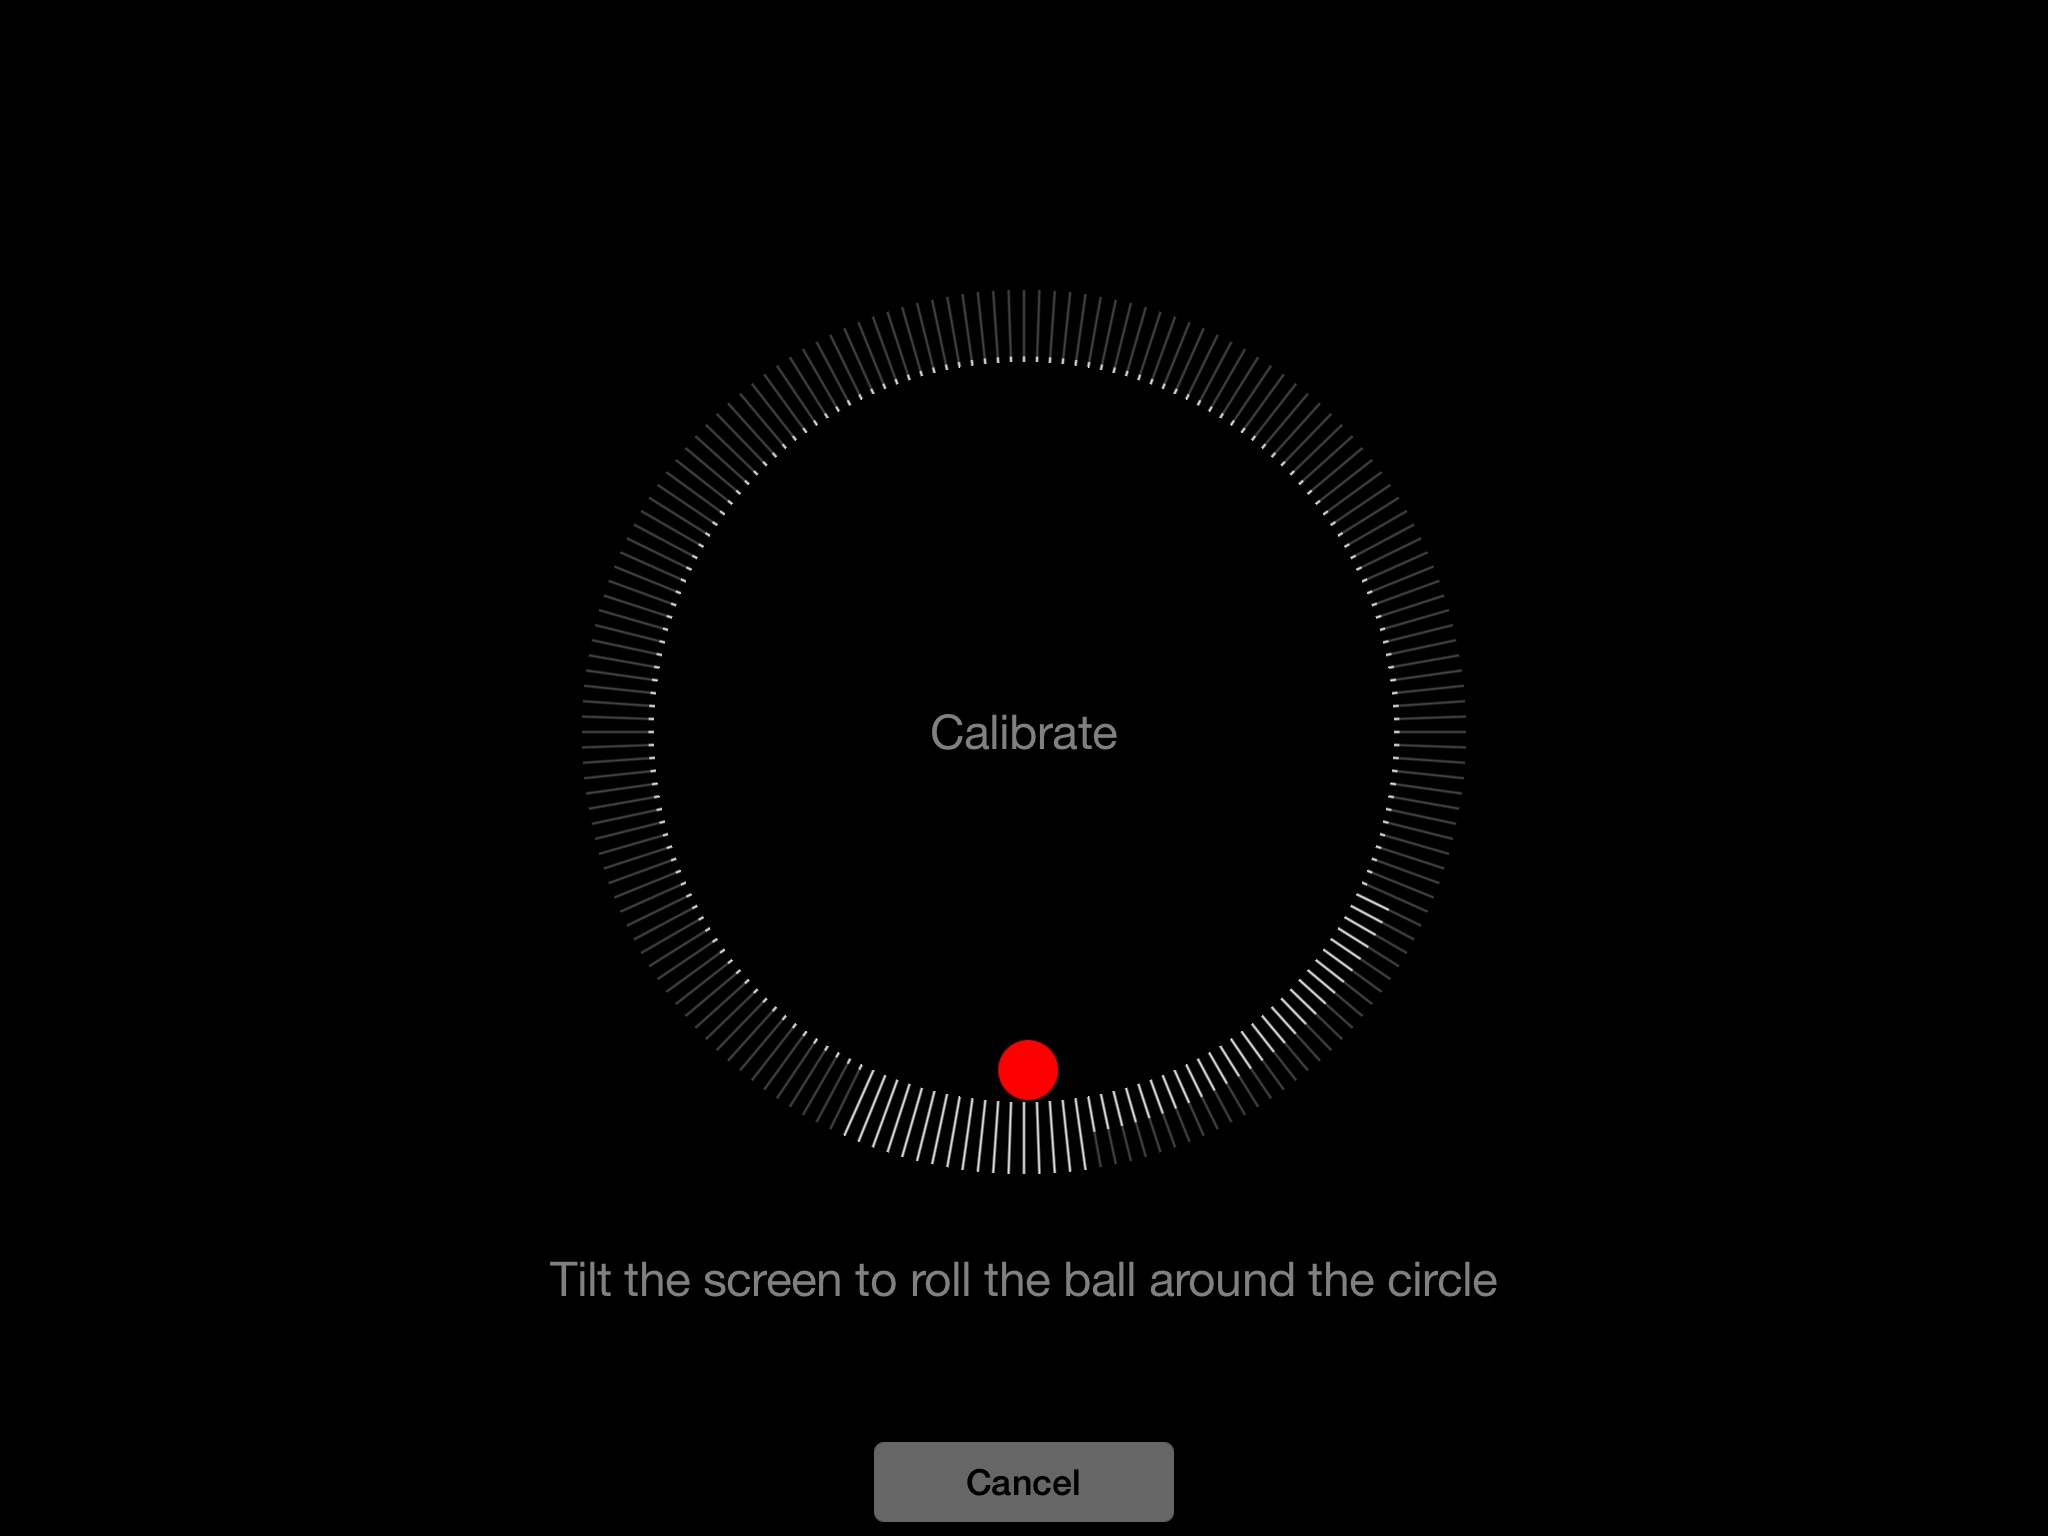
When the calibration screen appears after you open the Compass app, you’ll need to perform a few easy steps to calibrate the compass. Follow the on screen instructions and tilt your phone until the ball moves all the way around the circle. If you are using an earlier iOS, you will be prompted to move your phone in a figure 8 motion.
Calibrate device (iOS)
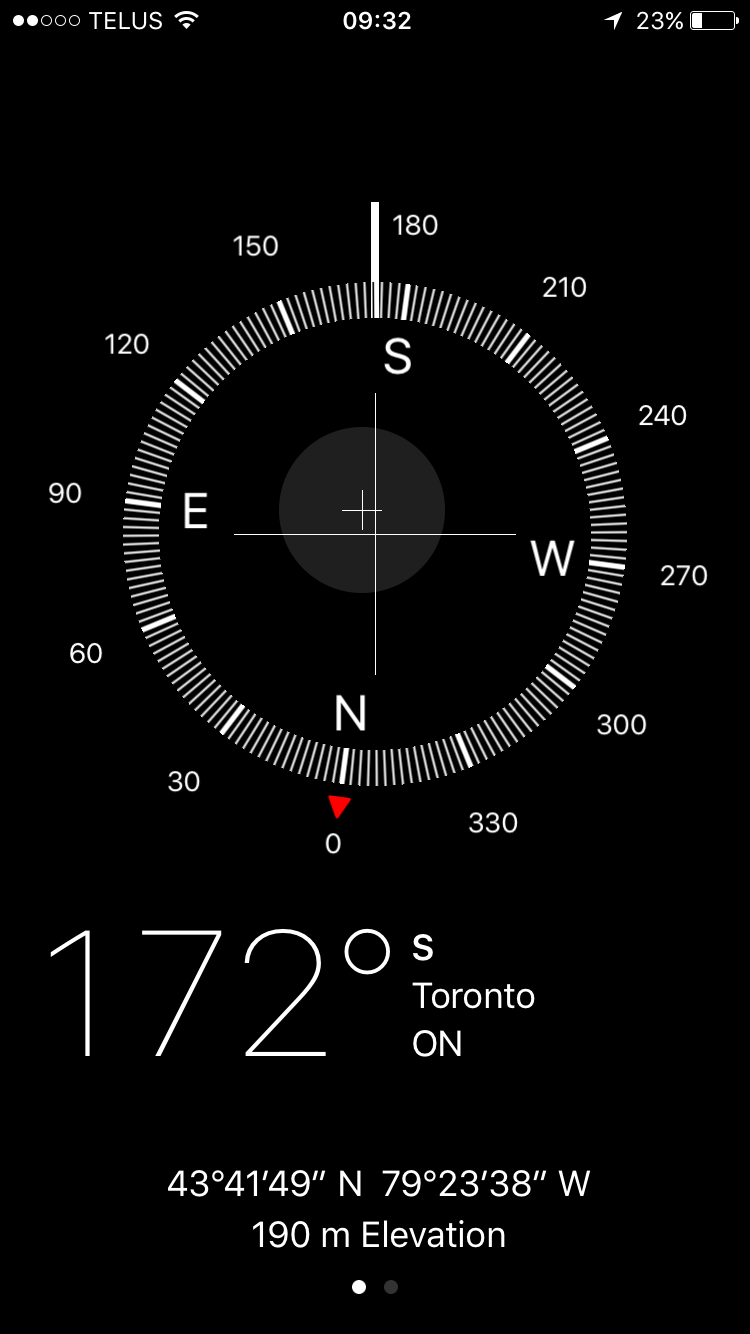
Once this process has been completed, the default compass screen will appear – your compass is calibrated and ready to be used! If the default compass screen appears as soon as the app is opened, your compass is already calibrated. If you see a different page appear on screen, the Compass app also doubles as a leveler; swipe left you will return to the compass screen.
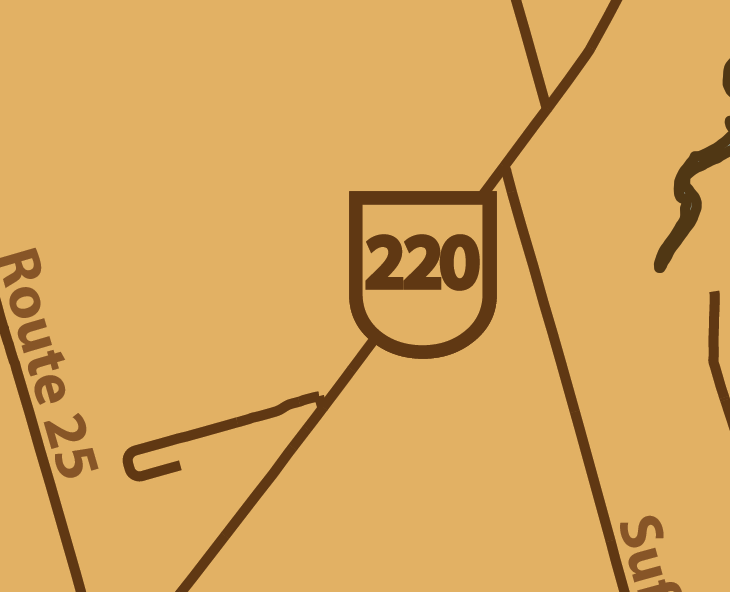
MAPublisher LabelPro intelligently labels your map layers using custom rules and styles. One of the popular uses of this feature is to create highway shields. The result is a cleaner map and is widely used on road maps around the world. While MAPublisher has many default options for highway shields, it is possible to create custom shields to improve your map as well. This blog will outline the steps to create and customize highway shields for your map.
Step One
Import your data into MAPublisher, ensuring your road line data has an attribute field for highway route numbers. Highway shields can work with any data type, however, traditional highway shields are created with a highway number with no additional characters. Using the integer data type enforces this and is recommended for highway shields.
Step Two
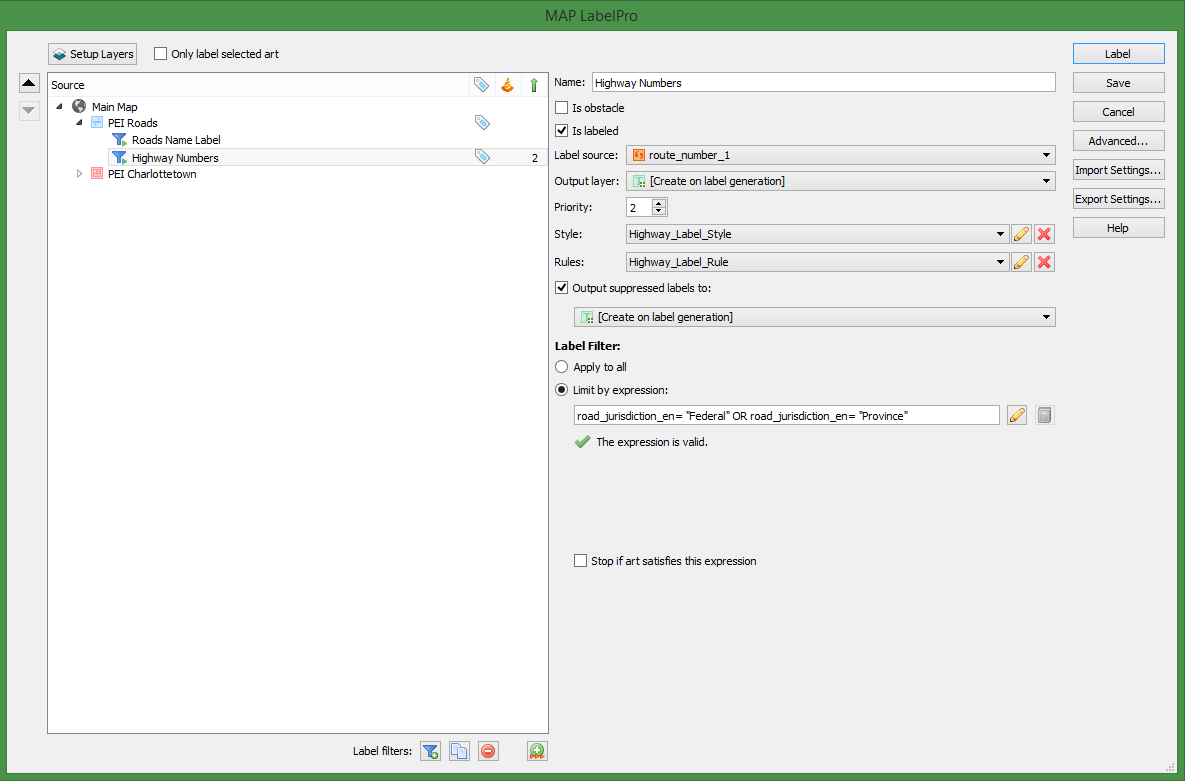
On the MAPublisher toolbar, in the Labels subsection, click the MAP LabelPro button.
Step Three
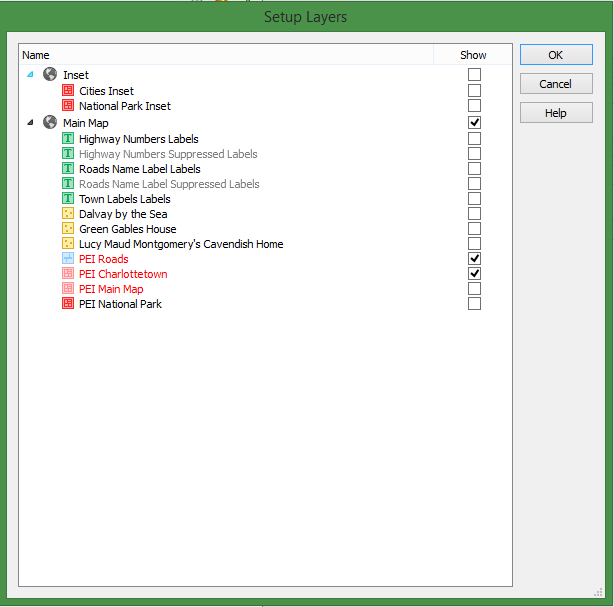
On the MAP LabelPro dialog box, click the Setup Layers button. This allows you to select which layers are going to be labeled or used as obstacles. This means you can label multiple features at the same time as the highway shields. Click the checkbox next to your roads layer and click OK.
Step Four
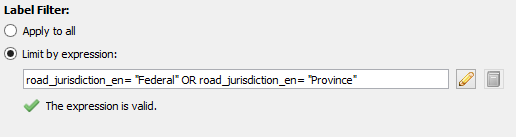
Optionally, you may want to only create highway shields on some of the roads within your road layer. For example, if your roads layer also contains roads that are not highways, you don’t want them labelled with a highway shield. The solution is to create a Label Filter. To do this, first create a new filter by clicking Add label filter button at the bottom of the dialog box. Next, in the Label Filter section, select Limit by expression and click the Edit icon. This opens the Expression Builder dialog box. In this example, the expression entered selects only roads that have a jurisdiction designated as “Federal” or “Province”. Only these roads will be labelled with a highway shield.
Step Five
If you didn’t create a label filter, click the layer in the Source list you would like to label. On the right side, ensure that the “Is labeled” checkbox is checked. Immediately below, in the Label Source drop-down, select the field that contains the highway route numbers.
Step Six
Select or create a rule from the Rules drop-down. The pre-defined Highways and Interstate rules that are included with MAPublisher follow conventional mapping patterns, but if you want to customize the setup of your shields, click the Edit button. Once you are satisfied with your rules, click OK to return to the MAP LabelPro dialog box.
Step Seven
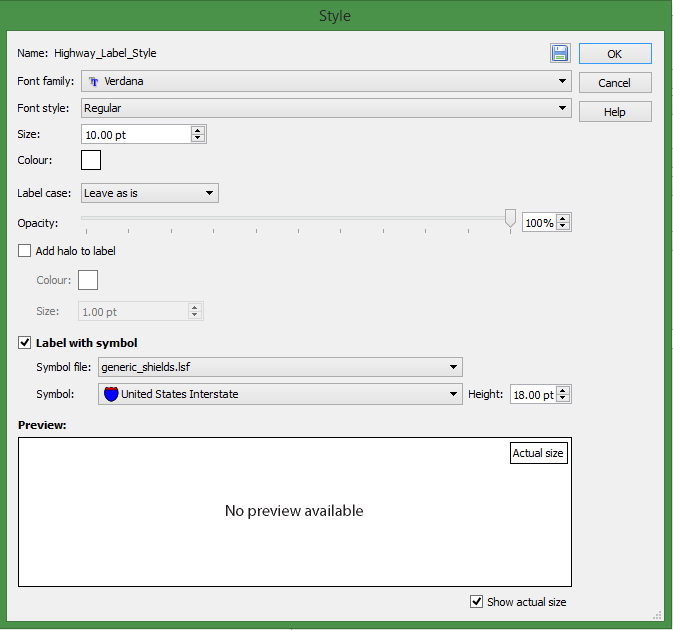
To customize the appearance of the shields, click the Edit button beside the Style drop-down. To add highway shields, click the Label with symbol check box to enable its settings. The Symbol file is the shield library, where you can pick between Canadian, US State and generic shields. The Symbol drop-down is where you can pick the shield from the shield library specified. All shields will have the same symbol, if you want multiple shield shapes on your map, you’ll have to create label filters as outlined previously in step four. The Font family, Font Style, Size, Colour and Label case affect the appearance of the text within the shield. Click OK when finished setting the style.
Step Eight
Back in the MAP LabelPro main dialog box, click the “Output suppressed labels to” check box. This moves all excess labels such as duplicate shields or shields that clash with other features on your map to a Suppressed layer. You can view features on the Suppressed layer after to see which labels were not included and you can decide to keep or delete them.
Step Nine
Click Label to begin the labeling process.
Step Ten
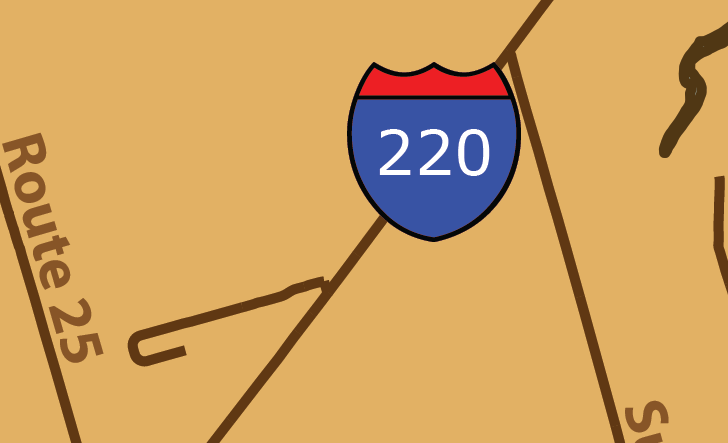
When all of your shields are generated, you can do some additional customization. In the Illustrator Layers panel, select all of your shields. From here, any changes to the colour, stroke colour and other settings you would use on objects, will be applied to your shields. With this functionality, you can create the exact shields you want for your map.
Using a Web Map Service (WMS) is a great way to easily get up-to-date imagery for your project. An issue you may run into, however, is that a server may not allow you to download images over a certain size (in pixels). The image resolution provided on most servers is usually high enough for most projects but there may be some instances where a higher resolution is needed (e.g. a poster-sized map or a web map that covers a large area).
One possible workaround for this issue is to get several small-area, high-resolution images from a WMS and then mosaic them together to make one large-area, high-resolution image. Here, we will use the City of Toronto Web Map Service to:
Get an image of downtown Toronto
Tile the image to split it into four smaller images
Use the extents of the four tiled images to get four high-resolution images
Mosaic the images to one large high-resolution image
Download an Image from the Web Map Service
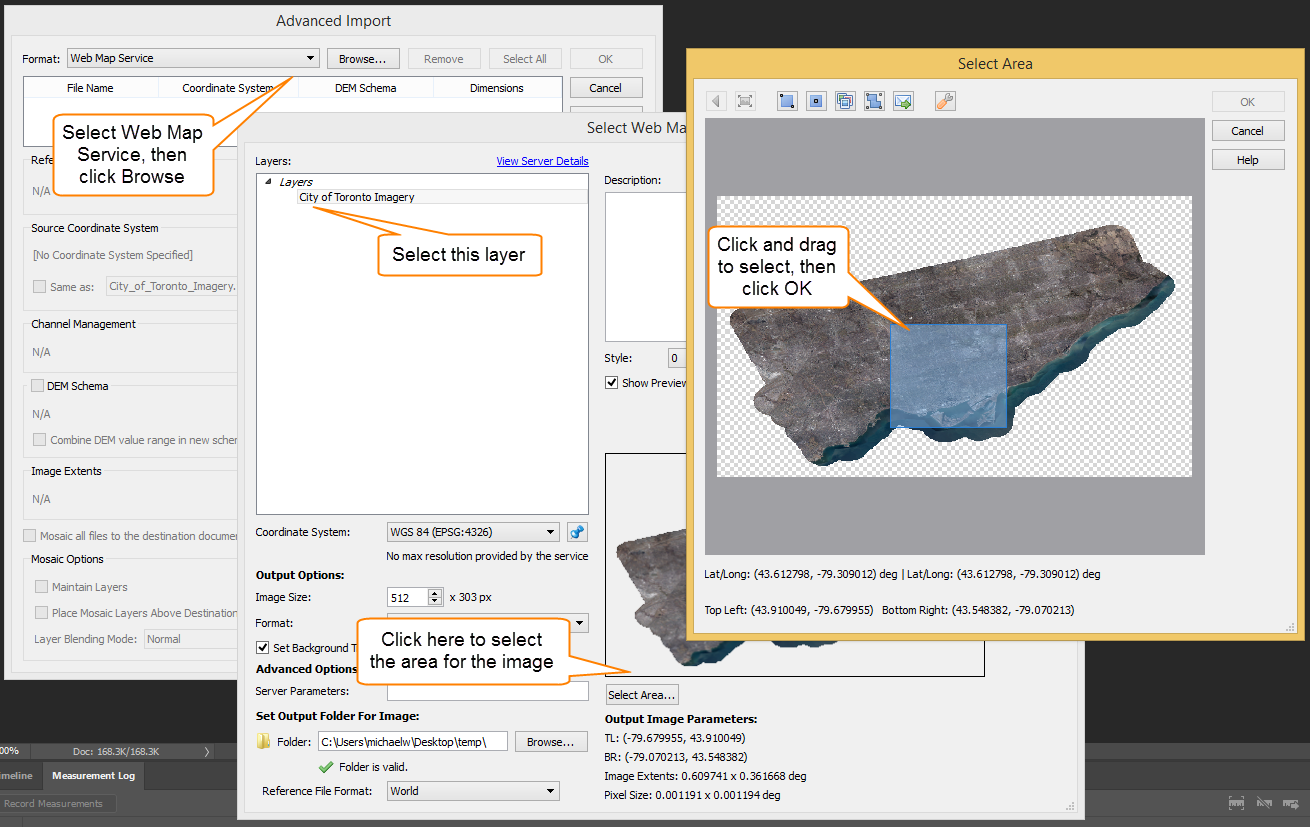
First we will get an image of downtown Toronto from the City of Toronto WMS. Click the Advanced Import button on the Geographic Imager panel. Select Web Map Service from the Format drop-down and click Browse. Click Load services from Avenza and select City of Toronto WMS from the list.
Download an Image from the Web Map Service (Click for larger version)
Select City of Toronto Imagery from the list of layers. Click Select Area then drag a box to zoom in on an area of downtown. Click OK to return to the previous window. There is no need to change the image size because we will use this image to get the extents of a higher resolution image. Leave the other options as default and click OK to load the image, and click OK again on the Advanced Import dialog box. The selected image will now open in Adobe Photoshop.
Tile the Image
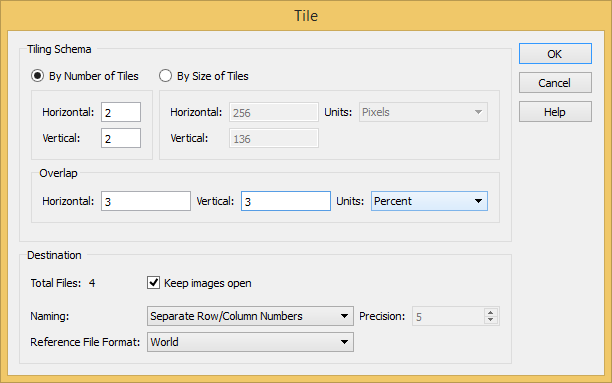
Next, let’s tile the image to split it into four separate images. Open the Tile dialog box from the Geographic Imager panel. Choose By Number of Tiles as the Tiling Schema and change Horizontal and Vertical to 2. Change the Horizontal and Vertical Overlap to 3 percent. It’s important to have overlap between the images so they will mosaic properly when the data is transformed.
Tile the Image (Click for larger version)
Click the Keep Images Open check box to enable it. Choose a name and location to save the tiles. You can save them to a temporary location because they will not be part of the final product. The four image tiles will open in separate tabs.
Estimate a Web Map Service’s Maximum Image Size
Open the City of Toronto Imagery WMS again and select an area. In this service, as with many other services, the maximum resolution is not provided. We can, however, use trial and error to find the largest image that the service will allow us to download. A WMS has a maximum allowed width and height set for an image request. The maximum width is usually the same as the maximum height.
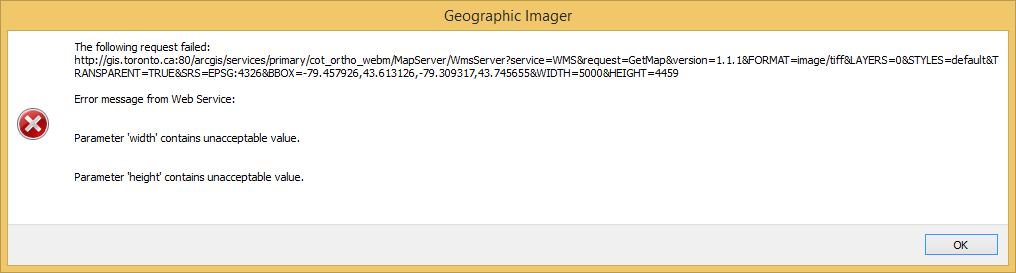
Set the resolution of the image by adjusting the width of the image in pixels under Output Options. First, try setting Image Size to a pixel width of 5000. Height will update automatically based on the image’s dimensions. Click OK and you will see an error that says “Parameter ‘width’ contains unacceptable value” (or height if the images higher than it is wide). OK the error to close it.
Estimate a Web Map Service’s Maximum Image Size (Click for larger version)
To estimate the maximum width and height allowed by a web service, you can adjust the image size to see when the server returns an error. The maximum width and height for the City of Toronto WMS is about 4000 pixels.
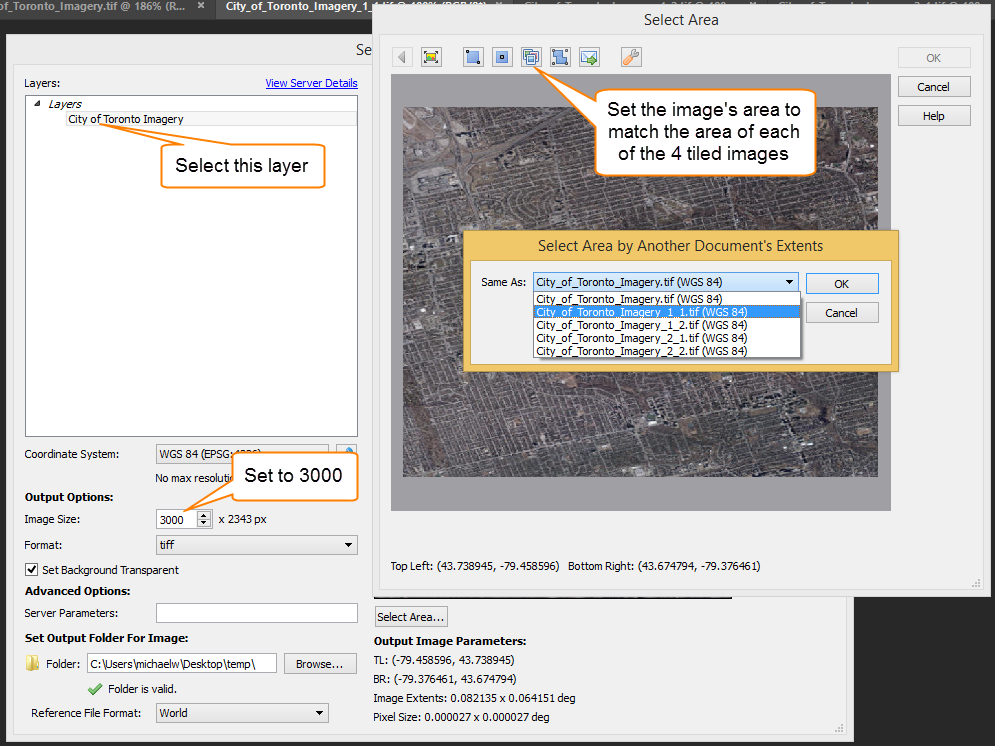
Downloading and Mosaicking Large Images
Next we will use the geographic extents of the four tiled images to download four higher resolution images with matching extents then mosaic the images together. Import an image again from the City of Toronto WMS using Advanced Import. Select an area, click Select Area by Another Document’s Extents and choose the first tiled image from the dropdown menu. The Select Area dialog will display an area matching that image’s area. Click OK to return to the previous screen.
Downloading large images (Click for larger version)
Enter 3000 as the Image Size. Click OK to add the image to the Advanced Import dialog box. Repeat the above steps for each of the remaining three tiled images.
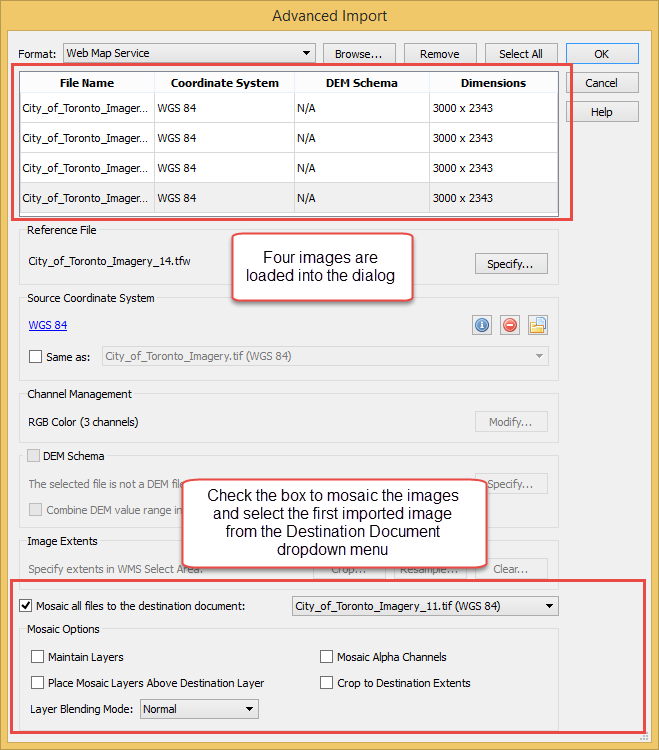
Creating a mosaic of four images (two by two) makes a single image just under 6000 pixels wide because of the overlap between the tiles (the height will vary depending on the area you selected). This is larger than the maximum size allowed by the WMS. Check the box Mosaic All Files to the Destination Document and select one of the images currently loaded in the dialog window from the drop-down menu. Leave the other options unchecked and select Normal as the Layer Blending Mode. This will merge the four images into a single document.
Mosaicking large images (Click for larger version)
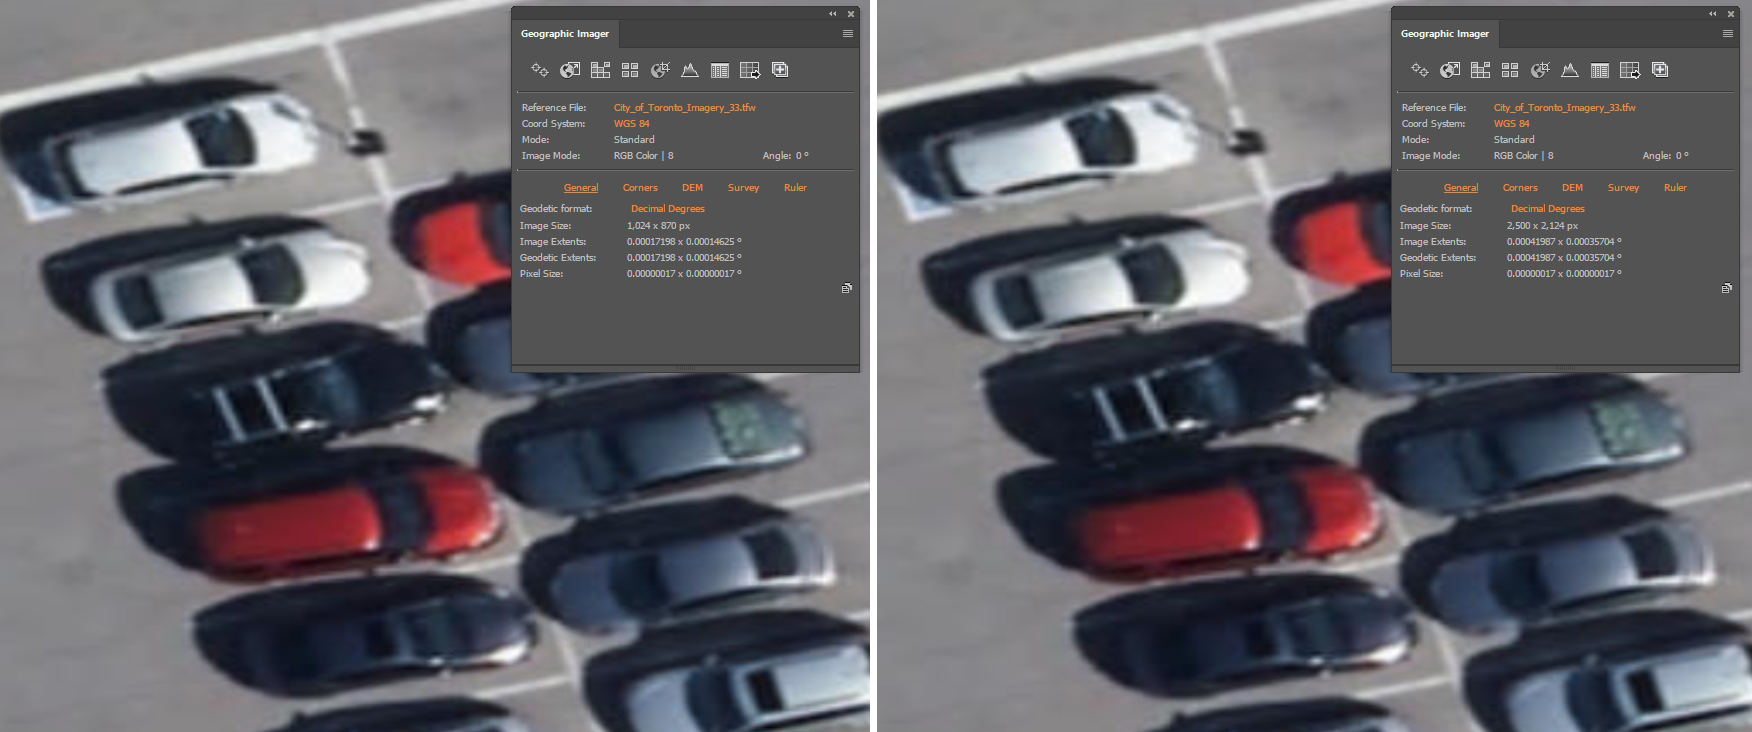
Avoid Downloading Images Greater than the Maximum Image Resolution
One further consideration when getting imagery from a service is to avoid requesting an image that is higher resolution than the full resolution of the image on the service. In this case, the number of pixels in the image and, therefore, the image size will increase without any increase in the actual resolution of the image.
To see an example of this, get an image from a WMS by zooming in on a small area and downloading images of varying resolution. The pictures below show two images of the same area side by side at different resolutions. The image on the left is 1024 by 870 pixels and the one on the right is 2500 by 2124 pixels but there is no noticeable difference between them. This is because the image exceeds the resolution of the image on the server so the WMS resamples the image to a higher resolution, creating duplicate pixels.
Avoid Downloading Images Greater than the Maximum Image Resolution (Click for larger version)