My Account     Contact Us     Cart

Easy Map Creation with WFS and WMS

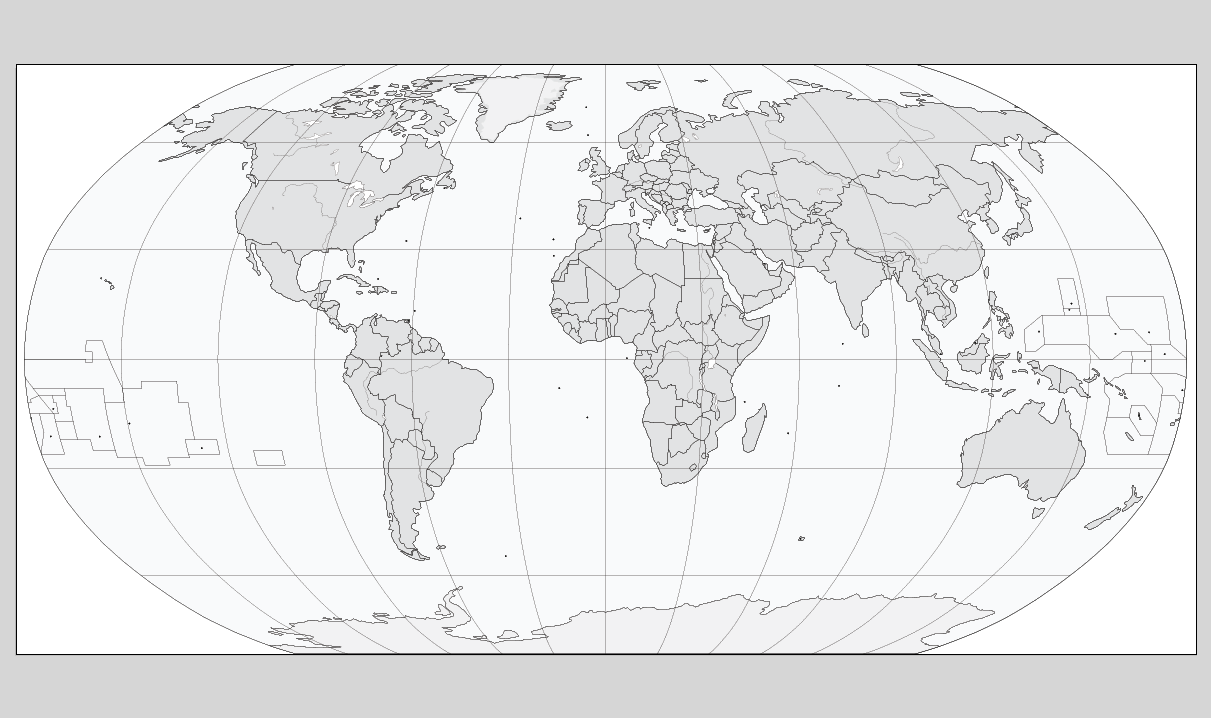
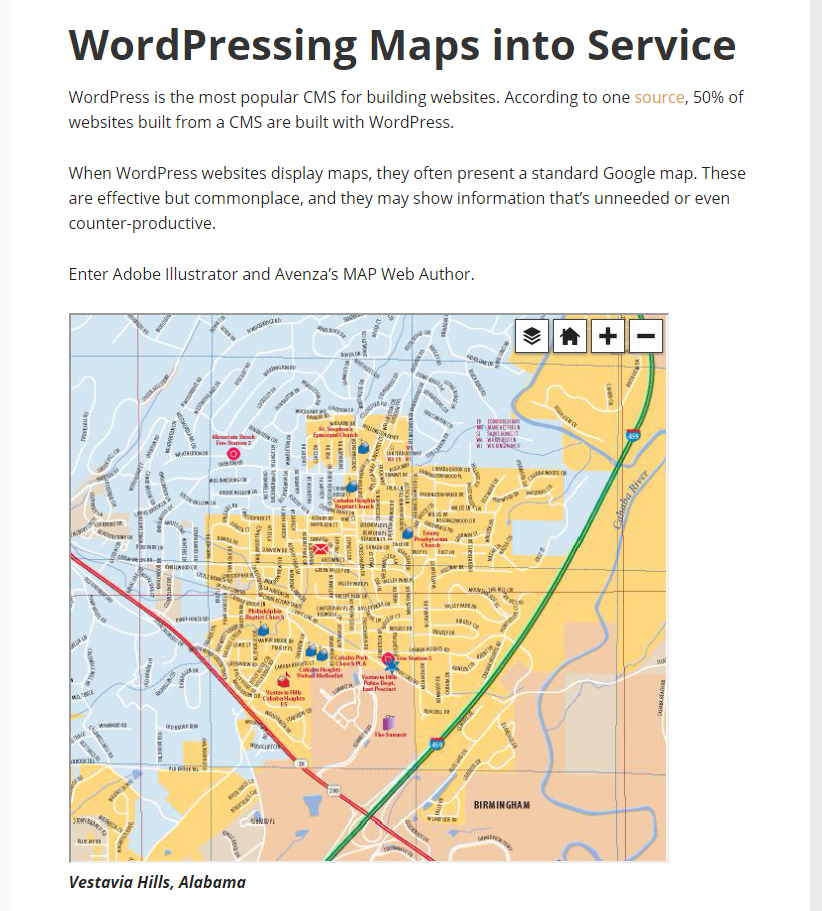
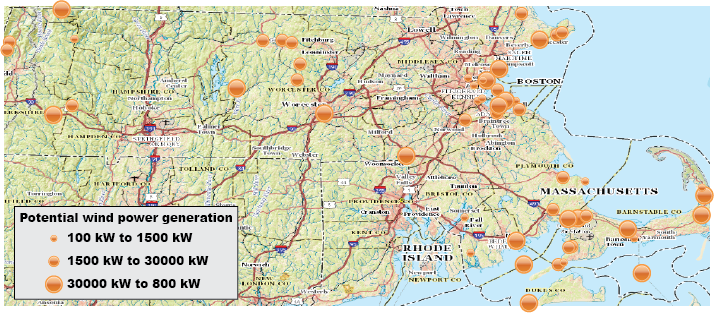
Online services can be used to create high-quality maps without the need to download and maintain large spatial datasets or spend time designing base maps. In this post, we’ll use two online sources to import data and create a map showing the potential energy generated from existing and proposed wind power projects in the state of Massachusetts.

Wind map

There are two types of online mapping services MAPublisher can use to import layers: Web Map Services (WMS) and Web Feature Services (WFS). WMS is an interface for accessing geo-registered images from an online source. This means that users aren’t able to modify individual elements of a WMS layer and are only able to select an area of the map to import. WMS also allows for transparency so map layers can be overlaid on top of one another.

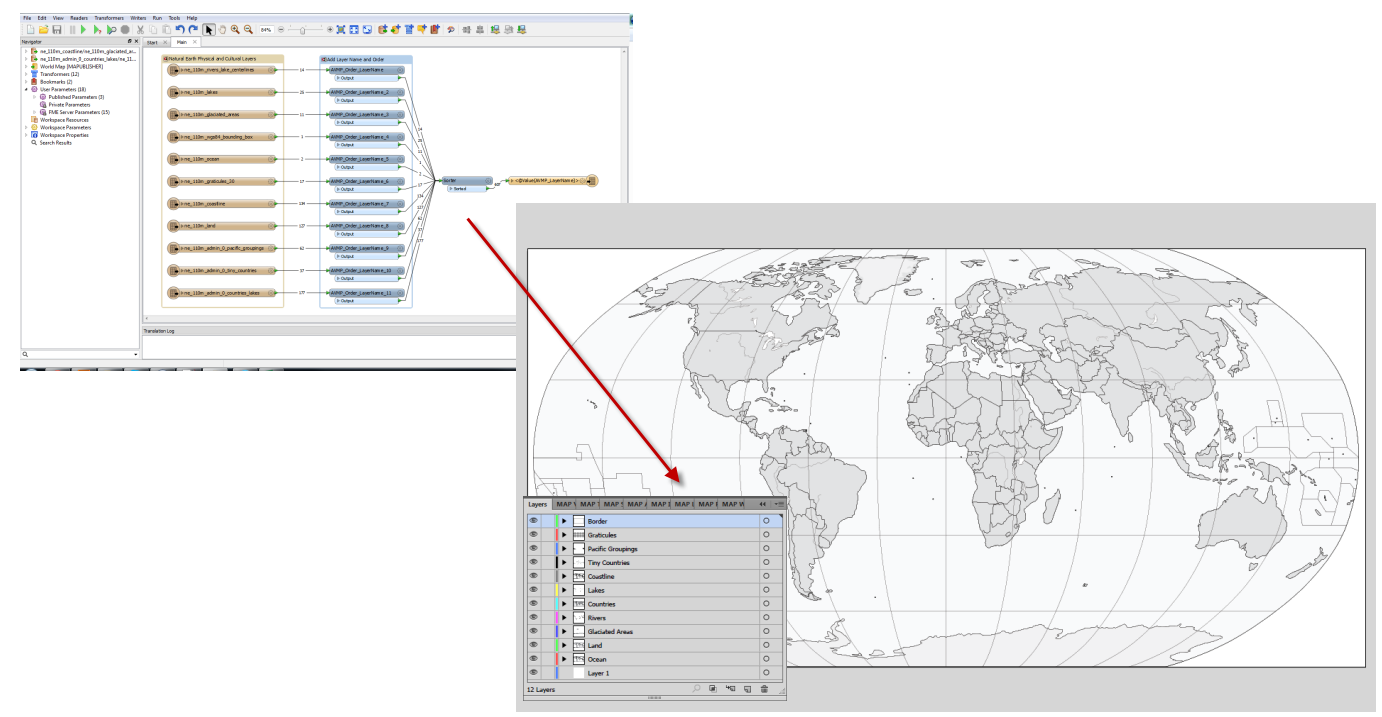
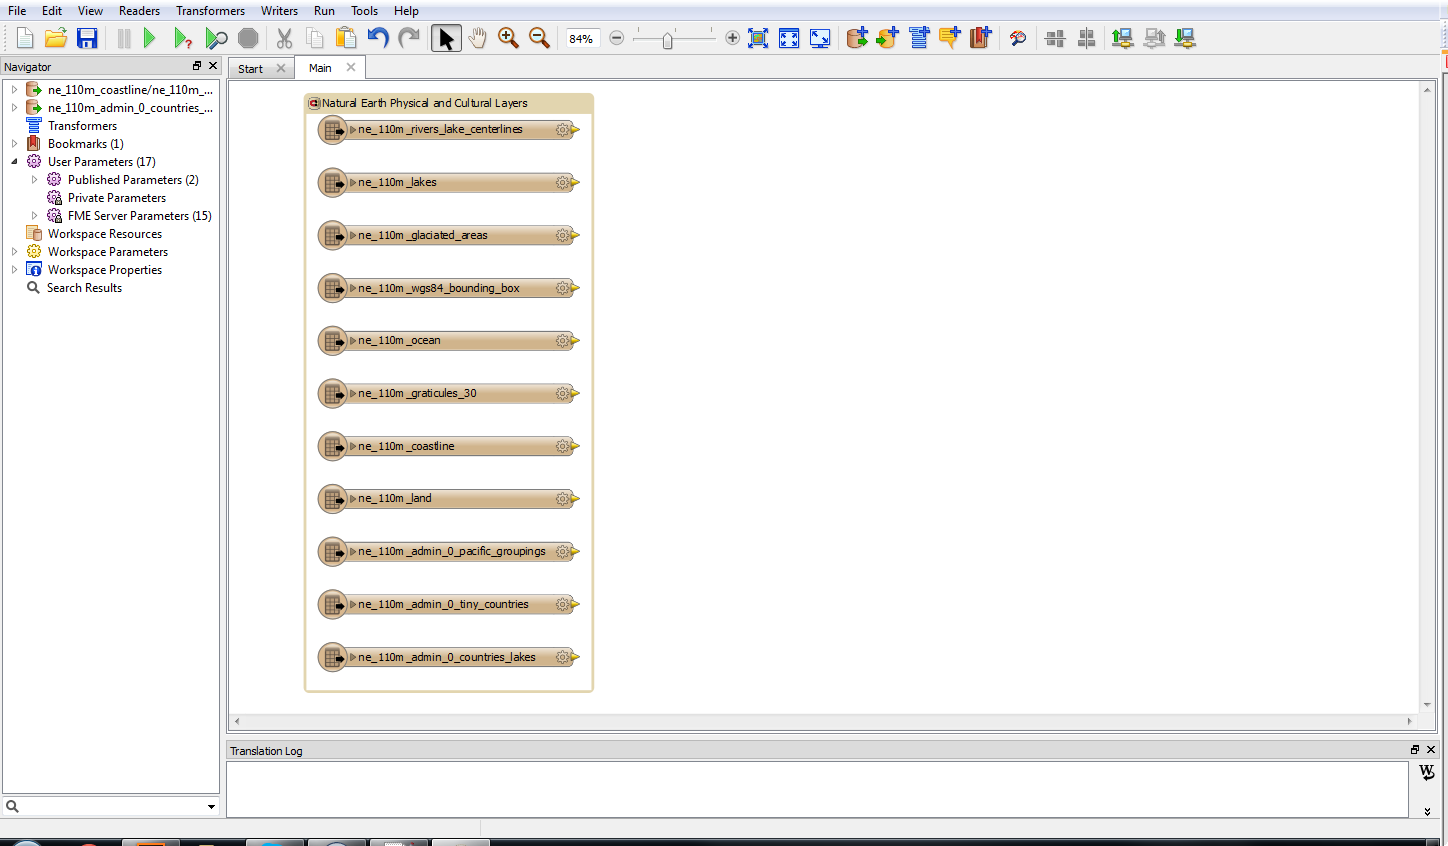
WFS, on the other hand, is an interface for accessing vector map features in GML format. Features are imported as a MAP Layer which can be further modified using MAPublisher and Illustrator tools. To create this map, we’ll import data from two sources: a topo map from the US Geological Survey (USGS) and the Massachusetts Office of Geographic Information (MassGIS).

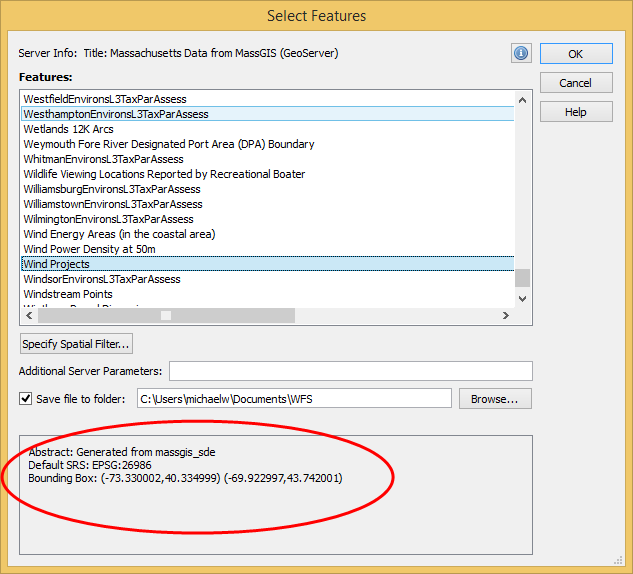
To start, open Adobe Illustrator and create a new document in portrait mode. Import a MAP Layer and select Web Feature Service from the Format drop-down. Click the “Click to select services and layer(s)”. link. The MassGIS layers are included with MAPublisher by default. If you do not see this service, click Load Services from Avenza. Select Commonwealth of Massachusetts, USA – MassGIS in the USA folder.

Selecting WFS for import

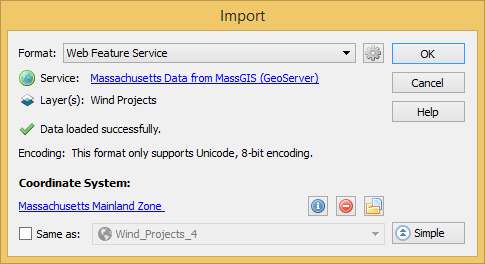
On the Select Features dialog box, select Wind Power. Note the default SRS – EPSG 26986. On the Import dialog box, click the link to select a coordinate system. Choose Massachusetts Mainland Zone (EPSG 26986). Click OK.

WFS information

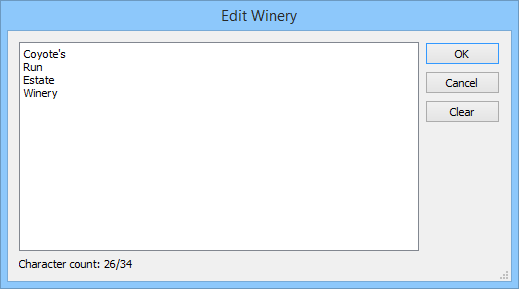
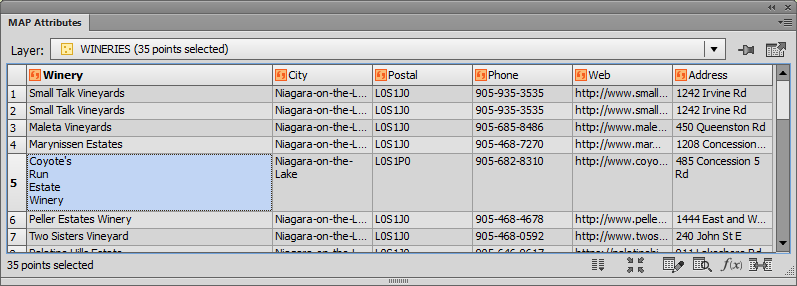
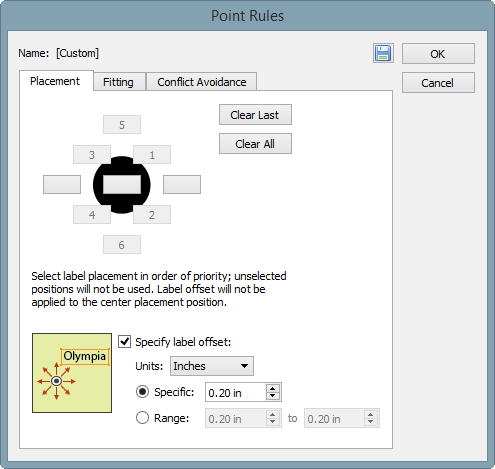
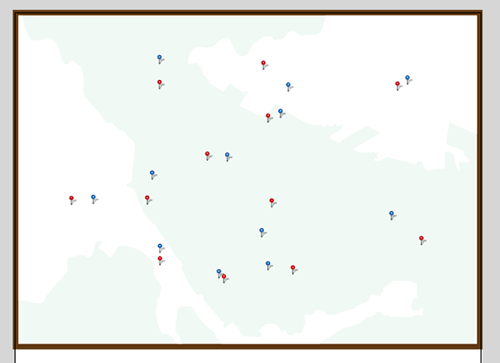
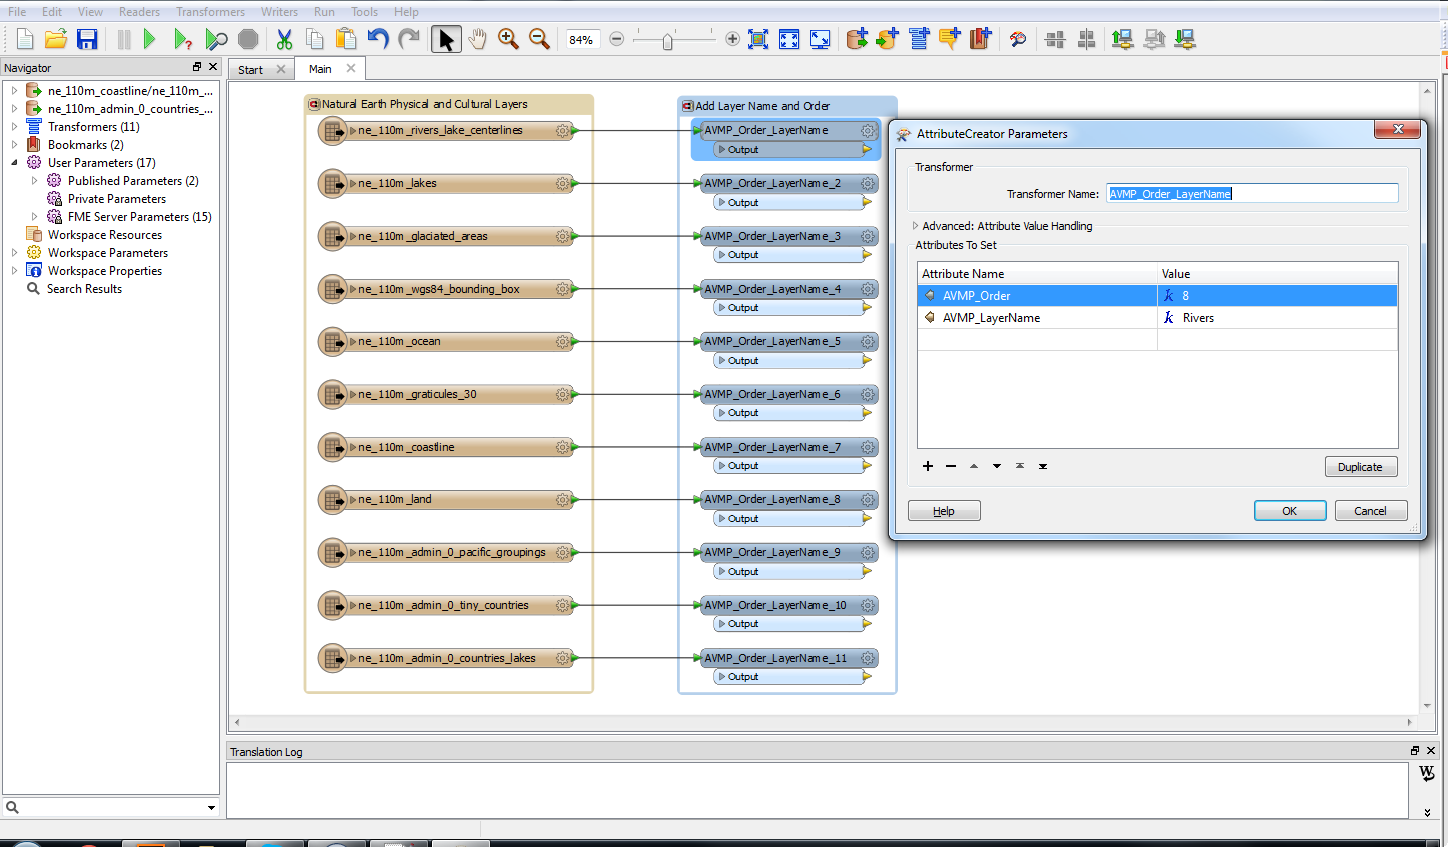
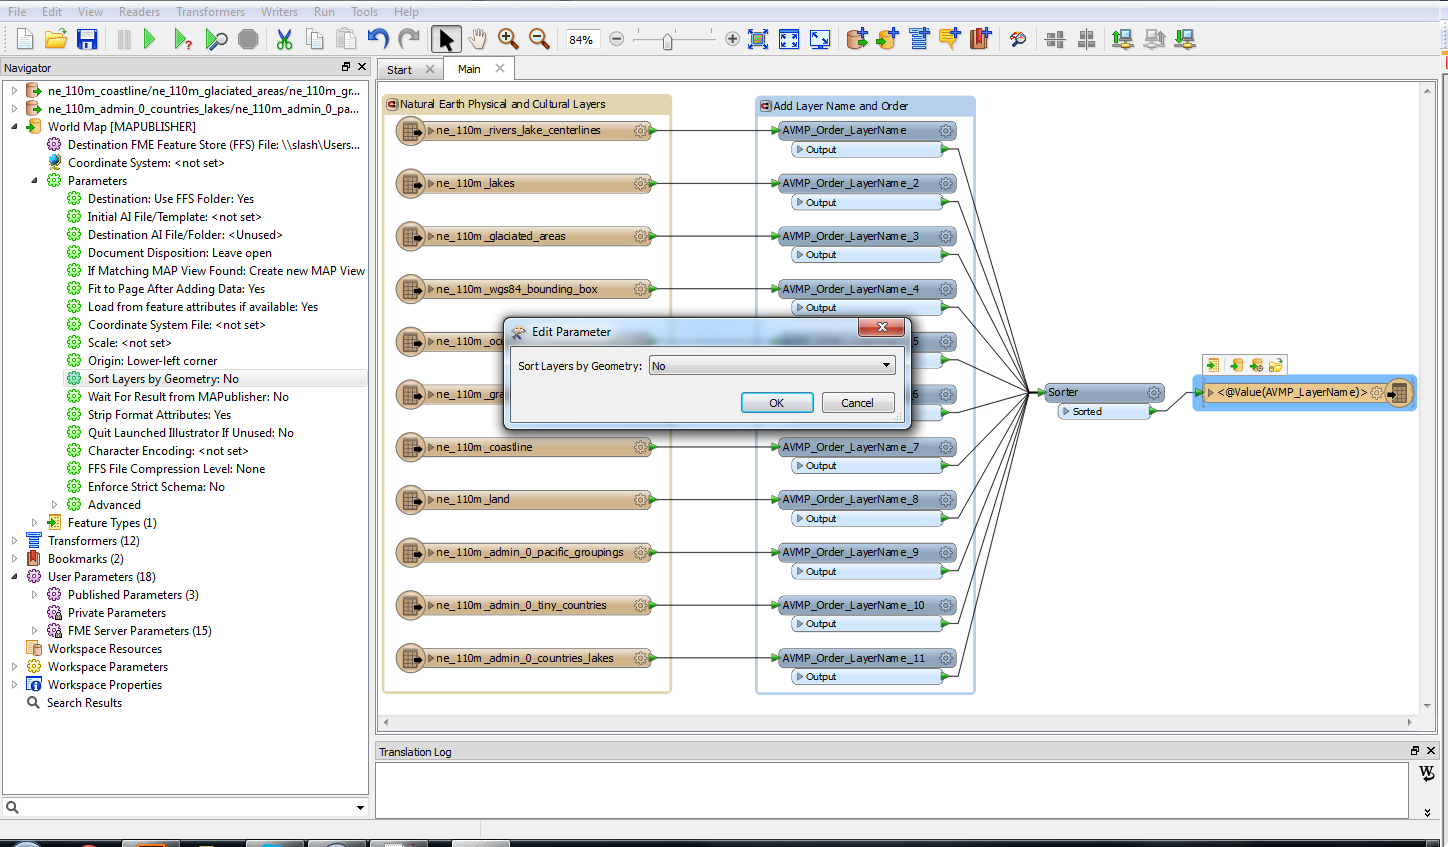
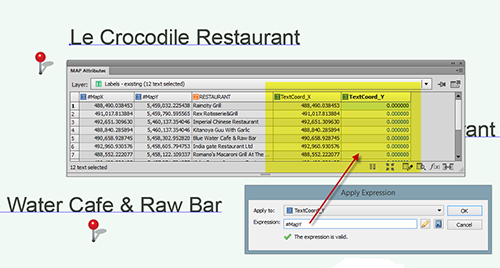
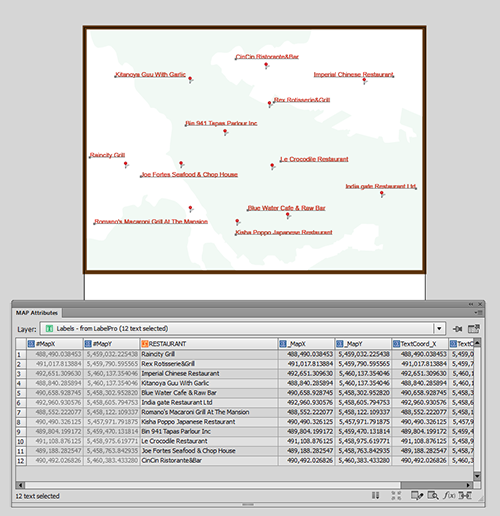
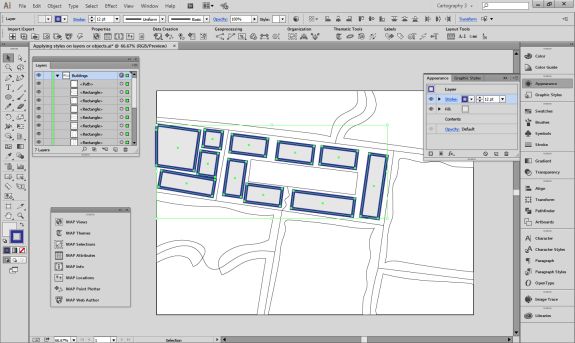
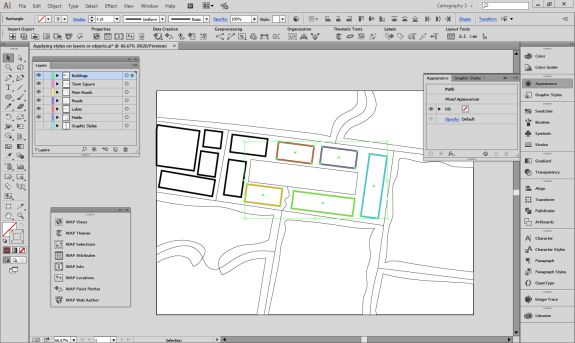
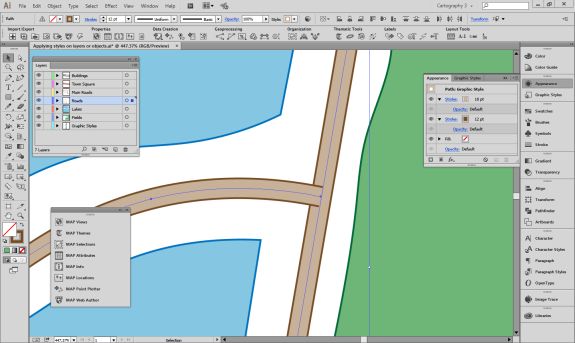
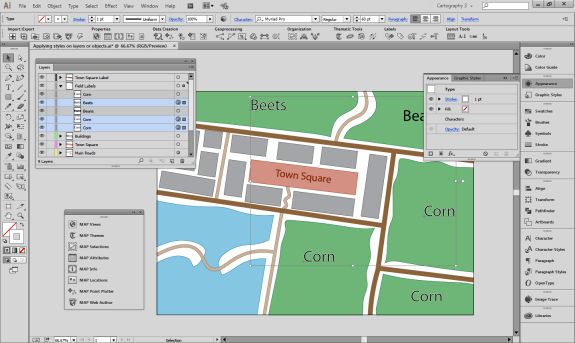
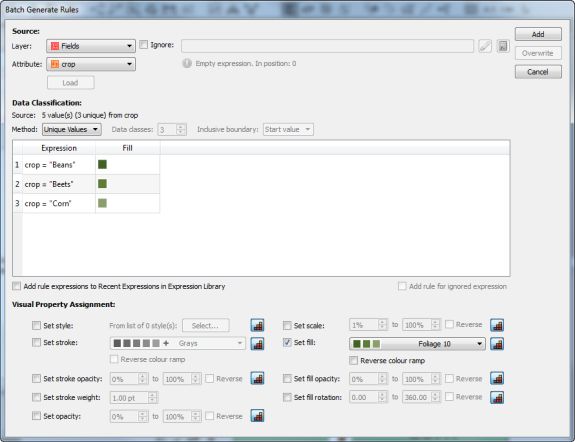
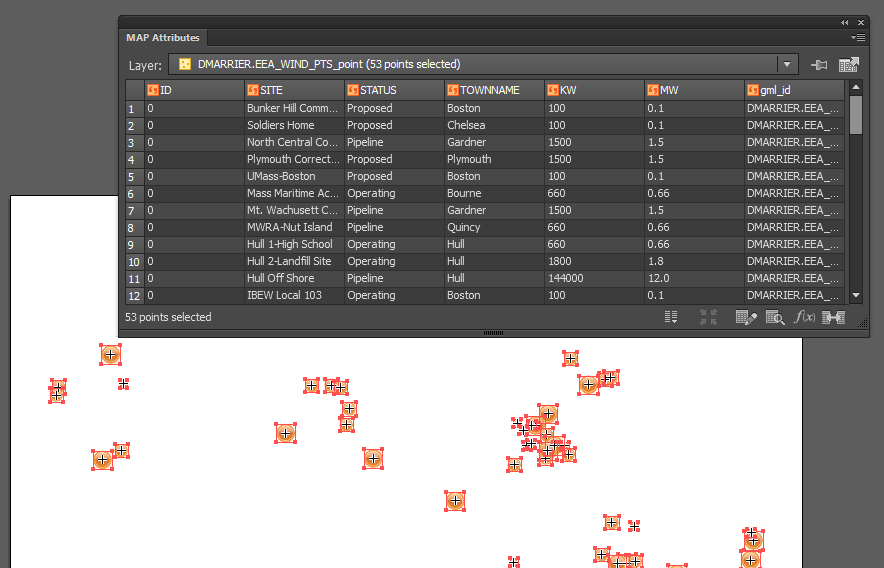
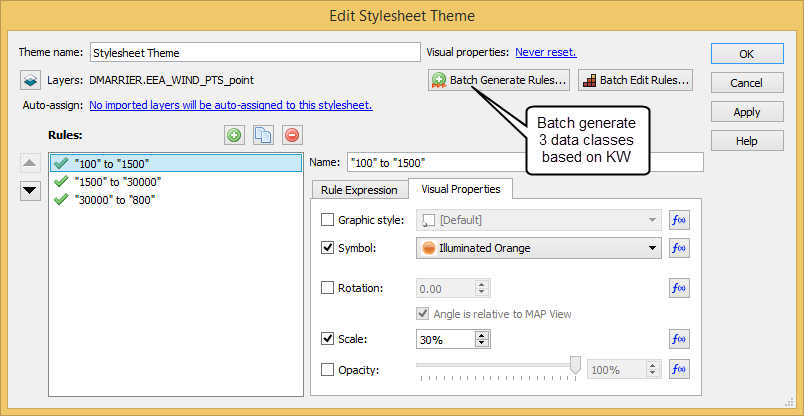
The Wind Projects layer has been imported as a MAP Layer. It can be modified using MAPublisher or Illustrator tools to symbolize, label, select, and so forth. To create the style for this layer, add a new Stylesheet MAP Theme of Point feature type, then Batch generate rules for the KW column using three quantiles, and select Set scale so the symbols scale proportionally to the value. For more on how to replicate this style, see the MAPublisher Help article MAP Themes.

Wind point attributes (click to see larger image)
Batch generate rules

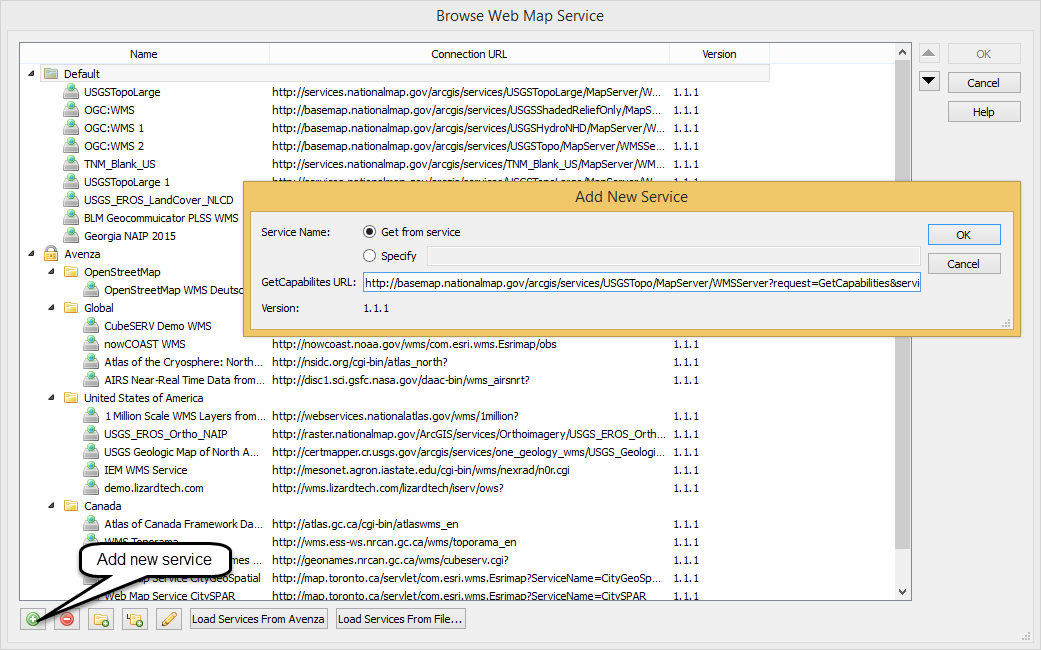
The next step is to import a WMS layer to use as a base layer. This map uses the USGS Topo Base Map which was created as part of the National Map program. A list of WMS and WFS services provided by USGS is available at http://viewer.nationalmap.gov/services/.

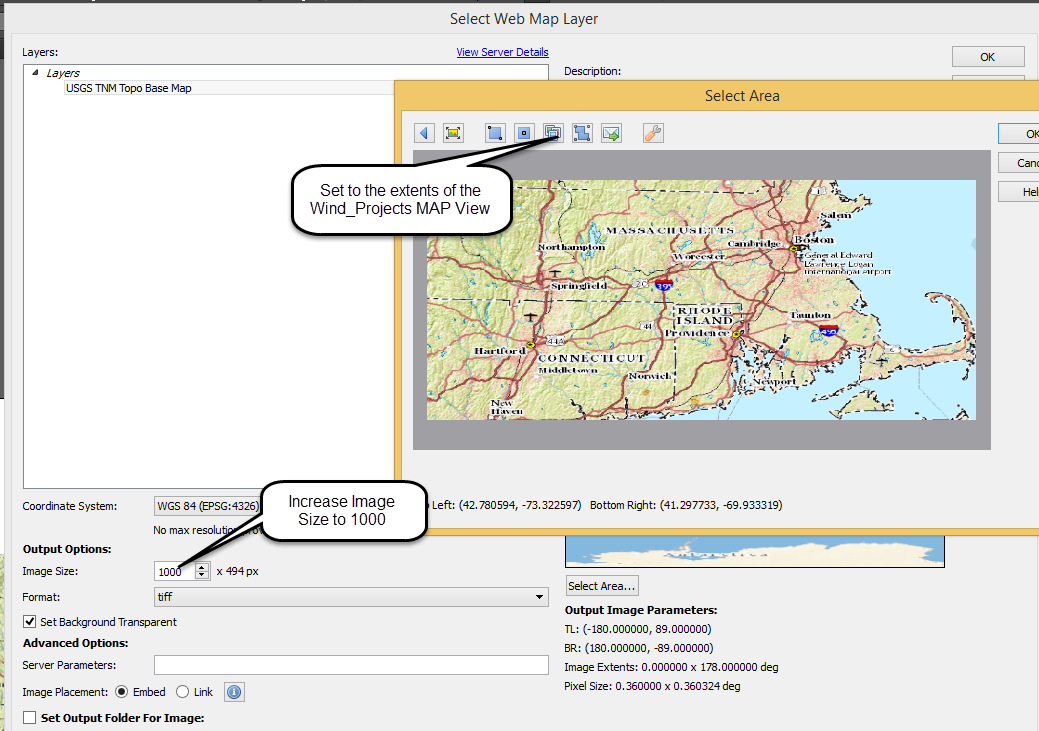
Go to the USGS web page and open the WMS link under Base Maps (Cached) > USGS Topo Base Map – Primary Tile Cache (Tiled). This is an XML document with the location and metadata of the WMS. Copy the link from the address bar and in Adobe Illustrator, click the MAPublisher Import button and choose Web Map Service from the Format drop-down menu. Click the “Click to select service and image” link. Click Add New Service and paste the URL into the GetCapabilities URL text box. Choose the service from the list and click OK.

Add new service

On the Select Web Map Layer dialog box, choose USGS Topo Base Map from the Layers list. Set the Image Size to 1000 to increase the resolution. To change the extents of the output image click Select Area. This dialog box provides several options for setting the extents of the base map image. Click-and-drag to specify an area to select – the image will automatically crop. The buttons at the top of the panel allow you to enter the coordinate extents manually, match the extents of a MAP View or match the extents of a vector layer. Since we have already added the Wind Power layer to the map, we will set the extents to match this map view by clicking “Select area by MAP View” and choosing Wind_Projects from the drop-down menu. Leave the other options as default and import the base map image.

Select area

For the final step, open the MAP View panel and drag the layer DMARRIER.EEA_WIND_Point to the MAP View USGS_TNM_Toppo_Base_Map. This will transform the points to the same coordinate system as the base map.

There are thousands of freely available WMS and WFS sources available online. For a good starting place see this blog post from the Open Geospatial Consortium for advice on finding services. You could also use a basic web search – for example – “WMS Toronto” or similar. For more help on web services in MAPublisher see the help article Web Map/Feature Service.

Avenza Systems Fixed and Floating License Solutions: What Are The Differences?

Avenza desktop applications, MAPublisher and Geographic Imager offer two options for the licensing system: Fixed license and Floating license.

The Fixed license option allows only one license per computer. For most users or small companies, this is generally sufficient, even with a few licenses. Since your license is fixed to a specific computer, it can’t be moved freely to another machine. However, Avenza does allow you to move your license occasionally. For example, if you purchased a new computer or when your computer is being fixed and you need to transfer your fixed license to another computer. If your subscription status for MMP (MAPublisher Maintenance Program) or GMP (Geographic Imager Maintenance Program) is up-to-date, then moving your fixed license to another computer (i.e. rehosting a license) can be done without a cost. Complete this form to do so. You will receive a notification email from Avenza when this is completed.

The Floating license option is for users who wants to share a number of licenses on the network. This is a great solution for any size company that has multiple users who share use of MAPublisher or Geographic Imager. You will need to set up a license server for which users will need check out a license from the server before using MAPublisher or Geographic Imager. In general, this option is used when sharing a number of license with colleagues. For example, the license server holds two seats of MAPublisher license. When users on Computer A and Computer B are using MAPublisher, other users can’t check out a license until the borrowed licenses are checked in.

An example environment of a floating license system

Another great advantage of the floating license the ability to borrow a roaming license with their laptop so that they can use MAPublisher and Geographic Imager outside their immediate office. This is a good solution for users who need to use the software on the go and doesn’t have a connection to the floating license server.

For more information about the licensing options for our MAPublisher and Geographic Imager, contact Avenza sales.

If you have any technical questions about setting up a license server or any other licensing issues, contact Avenza Technical Support.

Force Multiple Line Labels By Adjusting Text Attributes In MAPublisher

Single line label vs. multi-line label

There may be times when you want to have labels be multiple lines. Multi-line labels allow them to fit in tighter positions on the map. Currently, in MAPublisher LabelPro there’s a rule to allow stacking up to 2, 3 or even 4 lines. However, this rule only “allows” stacking and doesn’t “force” stacking. It is only meant to fit labels when there isn’t enough space for a single line.

MAP LabelPro allow stacking rule

Fortunately, there is a trick to manually force text to label as multi-line: you need to manipulate the text attribute. Always make sure to create a backup or duplicate of your layer before trying this on your own data.

1. Go to your attribute table. Double-click to edit the text and click the Edit icon.

Edit feature attribute in MAP Attribute table

2. Edit the text so it is on separate lines.

Edit the text so it is on separate lines

In the attribute table, you will only see the first word of the multi-line text. But all the text is still there and you can see it by adjusting the row height.

Adjust the row height to see all the text

3. Run MAPublisher LabelPro, Label Features, or the MAP Label Tagger tool. MAPublisher will label the feature using the multi-line text specified in your attributes.

Labeling result

If you have the Allow Stacking rule enabled in MAPublisher LabelPro, it won’t affect multi-line text since it’s already setup that way. Generally, it’s good practice to leave the allow stacking rule enabled in case other labels require tighter fitting. Remember to create a MAP Text layer to contain labels that could not be placed. This can provide hints as to what LabelPro rule adjustments you need to make.

Illustrator GPU Performance Beta invite

Are you using Adobe Creative Cloud 2015? Would you like to improve the performance of Adobe Illustrator? If so, participate in the Adobe Illustrator GPU performance beta program by registering here. Your participation will significantly help to improve the performance of Adobe Illustrator in the future.

Adobe CC 2015 introduced a new feature in Illustrator Preferences and depending on the combination of the environment components, you might have already experienced that the performance can be really slow especially when making maps. We all know that many Illustrator files with cartographic projects can be very complex in terms of file size, layer/object structure, number of features, geometry, effects and tasks to every object applied. As a result, even if a supported GPU card is installed, the performance of Adobe Illustrator can be very slow.

We would like to introduce this beta program to you and our customers so that we can assist the Adobe Illustrator team to receive the customer feedback directly to help the development of the future version of Adobe Illustrator. If you could participate in this beta program, your voice will directly reach to the Adobe Illustrator team so that they can closely investigate to enhance the feature.

Adobe Illustrator CC 2015 Preferences: GPU Performance

Working With Avenza Floating Licenses Outside of Your Work Network

If you or your organization have a floating license for MAPublisher or Geographic Imager, this blog post is for you. Having a floating license provides you with a lot of flexibility when you want to bring your laptop computer outside your work network and use MAPublisher and Georaphic Imager at home or in the field.

Let’s say you have a laptop computer and you want to work on your mapping project outside your office network. You can do it if your organization has a floating license.

Step 1: Make sure all the software is installed

On your laptop computer, make sure that you have MAPublisher for Adobe Illustrator or Geographic Imager for Adobe Photoshop installed and that there is a valid floating license (for one or each product).

Step 2: Connect your laptop to the network and to the licensing server

If you are not sure how to connect your laptop to the network and to the server, please contact your IT administrator. It is essential that your laptop computer is connected to the license server so that you can obtain a liecnse from it.

Step 3: Follow the steps in the MAPublisher/Geographic Imager license management window

Open the License Management dialog box.

If you’re using MAPublisher, access MAPublisher by going to Help > MAPublisher Licensing > License Management.

If you’re using Geographic Imager, access License Management by going to File > Automate > Geographic Imager: License Management.

Click the Floating button to open the Floating License Setup dialog box.

Make sure that the “Allow roaming licenses” option is selected. Click OK.

Allow roaming licenses

Click the “Use roaming license” option and specify the number of days in the Duration of borrow option. This indicates how long you want to use the license outside of your network.

Specify duration of borrow

Clicking the “Checkout” button will change the status of the license. In this example, we borrowed a license from the license server for two days (December 16, 2015 starting date).

Checkout the license

Now you will be able to use your MAPublisher or Geographic license when your computer is disconnected from your work network.  You might want to test it by closing Adobe Illustrator or Photoshop, disconnect your computer from the network, restart Adobe Illustrator or Photoshop, and see if you can use MAPublisher or Geographic Imager.

Placing Text with an Offset Value Using MAP LabelPro

Having introduced some background information about text insertion point coordinate values in a previous post, it would be good to explore if this method works when trying to place text objects (annotations/labels) with a specific offset value. For example, if you have a point layer and there is an attribute for the offset value so that every object has a different offset value.

An Attribute table with the offset value for every object

Placing text objects with a specific offset is possible in MAP LabelPro. You can specify the Label Offset value in the MAP LabelPro dialog box. However, this setting will be applied to all text labels. In the example below (see screenshot), all the text will be placed 0.2 inches away from the object. However, that does not help when every point has different offset value like this example. Also, MAP LabelPro uses page units, not the world/map units. In this example, the offset distance was specified in the world/map unit (metres).

The offset option in The Point Rules dialog window from MAP LabelPro.

There are two methods you can accomplish to make the text placed with offset value. The first method is the same as the step shown above. You can adjust the text placement position by calculating the “ideal” coordinate for the text insertion point. From a MAP layer (point, line, or area), generate text with a MAPublisher feature (MAP LabelPro or Feature Label).  Then adjust the text position (maybe you will have to calculate a new position by adding/subtracting the offset values from the current point), then apply it to #MapX and #MapY. The second method is to adjust the position of the points first before labeling.

In the example below, a point layer with offset values in the attribute: x_Offset and y_Offset.

An example map with offset attributes (x_offset and y_offset)

Step 1: Calculate coordinates with offset.

  1. Create a copy of the layer just because the point value will be adjusted.
  2. Make the #MapX and #MapY visible (so that it’s easy to see when calculating).
  3. Create new columns (here we created “x+coord_withOffsetX” and “y+coord_withOffsetY”).
  4. Calculate the new coordinate of the points for X and Y (here we used Apply Expression) as shown below.

Step 1: Calculating the coordinates with offset

Step 2: Move the points to the calculated coordinates with the offset values.

Use the same method as the one introduced in the previous post. This method works for the Point layer as well. Open the Edit Schema window and apply “x_coord_withOffset” and “y_coord_withOffset” to #MapX and #MapY, respectively.

Step2: moving the points to the calculated coordinates with the offset values

Now, the points are moved to new position. The red point is the original and the blue points are the ones moved to the offset. Now you can label each points. After placing labels for the point layer (blue), you can make the point layer invisible.

The point position is adjusted by #MapX and #MapY

Now you can run the label engine (MAP LabelPro / Label Feature) for the new point layer with offset.

Sorting MAPublisher Layers with FME Auto

In this blog post we’ll look at how you can control the order of layers in MAPublisher when using FME Auto.

FME Auto to MAPublisher

FME currently doesn’t provide a way to explicitly define the output order of Feature Types in a workspace. In the Navigator you can reorder Readers and Writers to control the order in which they are run, but unfortunately you cannot do the same with the Feature Types they read and write respectively.

By default when you write layers to MAPublisher from FME using FME Auto, the layers are arranged first by geometry (text first, then Points, Lines, Polygons and lastly Images), then alphabetically by layer name. This behaviour can be changed by unchecking the FME Auto Parameter “Sort Layers by Geometry”. Once this has been turned off, MAPublisher will display layers in the order they are received from FME. Using this behaviour, some FME transformers and a Feature Type fanout (or new to 2015.1, specifying the Feature Type name) we can control the order of the layers in MAPublisher for optimal cartographic output.

The first thing we want to do is to add some input Feature Types.

Natural Earth Shapefiles
(Click for larger version)

We will then create a template AttributeCreator Transformer to give each layer two attributes: MP_LayerName and MP_Order. MP_LayerName will define the name of the layer in MAPublisher and MP_Order will determine the order the layer is passed to MAPublisher; hence the order in which it is displayed.

AttributeCreator Transformer to add MAPublisher Specific attributes

Each Feature Type will be connected to a copy of the AttributeCreator Transformer and the values will be populated for that layer. The layer with an order of 1 will be on top with larger numbers descending below.

Layer Name Order
Border 1
Graticules 2
Pacific Groupings 3
Tiny Countries 4
Coastline 5
Lakes 6
Countries 7
Rivers 8
Glaciated Areas 9
Land 10
Ocean 11
AttributeCreator Transformers connected to input Feature types
(Click for larger version)

Once this is done, all the inputs can be connected to a Sorter Transformer. The Sorter will be set to numeric and ascending.

Sorter Transformer
(Click for larger version)

Finally, the MAPublisher writer is added. The Sort by Geometry parameter needs to be set to No and the Feature Type name should be set by the MP_LayerName attribute we created earlier. This replaces Feature Type fanouts and has slightly new behaviour at FME 2015.1. It is explained more fully (here).

MAPublisher writer added with Sort by Geometry Set to No
(Click for larger version)
Output Feature Types are defined by the LayerName attribute

Once we run the workspace, we’ll see the layers in the Adobe Illustrator Layers panel in the exact order we specified.

Layers in Adobe Illustrator are in the correct order
The final map after some cartographic styling
(Click for larger version)

Placing Updated Labels at the Same Position as Existing Labels

After a text placement engine places labels (e.g. annotations or labels) some manual adjustment is usually required. The major reason for this task is to avoid text colliding with other objects and to improve map aesthetics and composition. Here is an example map with the position of labels manually placed and adjusted. What do you usually do when updating your map and you have to update those labels?

An example with labels. The goal is to place the updated labels at the exact same position.


When running a text placement engine, it is common that the placed labels (in red) do not match with the position of the existing labels (in black). Have you ever thought that it would be useful if the updated labels can be positioned in the same place as existing labels? This is definitely possible using a combination of MAPublisher features.

A result after labels were placed with MAP LabelPro or Label Features.


Workflow involved to perform this task:

  • Obtain the position coordinate of existing text objects
    • Create new attributes to record #MapX and #MapY of each text object insertion point
    • Export the attribute table as a text file
  • Transfer the deteremined coordinte values of the text objects to the MAP layer (point layer in this example)
    • Join Tables using a common attribute between two tables
  • Place labels for the MAP layer
    • MAP LabelPro or Label Features
  • Adjust the position by those determined coordinate values for the text objects
    • Applying the recorded value to #MapX and #MapY


Step 1: Find the coordinates of the text insertion point from a text layer.

Every map object (point, line, area, image, and text) has a coordinate. MAPublisher calculates an insertion point when map objects are added to the artboard. For labels, a text insertion point can be seen as an anchor point or the square dot that is at the beginning of a text object. In this example, the text insertion point is placed at the lower-left corner of the word “Le Crocodile Restaurant” (highlighted in the red color in the screencapture below). The coordinate of this text insertion point is represented by the #MapX and #MapY attributes in the MAP Attribute panel. These two attributes are considered MAPublisher properties and are usually hidden. To display them, change their setting to “Visible” in the Edit Schema window as shown below.

Step 1: Finding the coordinate of the text insertion point from a "good existing text" layer
Step 1: Finding the coordinate of the text insertion point from a “good existing text” layer


Step 2: Record the coordinates of the text insertion point from a text layer.

Make the #MapX and #MapY coordinate values as useable attributes. Create new attributes called “TextCoord_X” and “TextCoord_Y”, then copy the values from #MapX and #MapY using Apply Expression.

Step 2: Recording the coordinate of the text insertion point from a "good existing text" layer
Step 2: Recording the coordinate of the text insertion point from a “good existing text” layer


Step 3: Prepare to copy coordinates of existing labels to the point layer.

The coordinate values of the text insertion coordinate of a text layer are now copied. The next step is to copy these coordinates from the text layer to the point layer. A simple method to do this is to use Join Tables based on a common attribute. In this example, the string field “RESTAURANT” is the common field in both text and point layers to make a connection. If you already have some other attributes (i.e. object ID or feature ID in both the text layer and the point layer, you should use that). Export the attributes as a text layer from the MAPublisher Attributes panel options menu.

Step 3: Preparing for bringing the coordinates of good, existing labels to the point layer


Step 3: Preparing for bringing the coordinates of good, existing labels to the point layer (2)


Step 4: Join the Point layer to the exported attributes table.

Now, create a table join between the point layer table and the exported attribute table using the Join Table feature.

Step 4: Joining Tables with the exported Text layer and Point layer


Below is the result from joining the tables together. There are also _MapX and _MapY columns because all visible attributes were exported. While the the step of copying attribute to TextCoord_X and TextCoord_Y was not totally be necessary, having columns named _MapX and _MapY could avoid some confusion because the point layer also has #MapX and #MapY columns. In this case, having attributes clearly indicating the values from the text insertion point is what is most important.

Step 4: Result from Join Tables


Step 5: Place labels with MAPublisher (inherit the attribute values from the point layer to text layer)

Now, place labels with MAPublisher using either Feature Label or MAP LabelPro. The important step here is to inherit the attributes from the point layer to the text layer (the target layer for generating new, updated labels).

When creating a new Text MAP layer, make sure that the “Base attribute schema on:” option is checked. This will allow the text layer to inherit the attributes from the point layer.

Step 5: creating a new MAP Text layer with the same attribute structure as the MAP Point Layer


Below is the result of placing labels with MAP LabelPro (red labels). The result (in terms of the attribute structure) should be the same if labels are placed using Feature Labels. The position of new labels are not the same as the existing one. The label position can now be adjusted using the TextCoord_X and TextCoord_Y values.

Step 5: Labels placed with MAPublisher LabelPro or Label Features


Step 6:  Move the text objects by adjusting the #MapX and #MapY.

As illustrated above, the text position is obtained from the text insertion point. The next step is to apply the text insertion point coordinates to the #MapX and #MapY attributes of the point layer using an expression with the Apply Expression feature or use the “Derive value from expression” option in the Edit Schema dialog box.

Apply the TextCoord_X and TextCoord_Y values to #MapX and #MapY, respectively.

Step 6: Now moving the text objects using the #MapX and #MapY


The labels are now positioned in the exact same location as the existing text layer.

Result: the new, updated labels are placed at the same position as the existing labels.
Result: the new, updated labels are placed in the same position as the existing labels.

Styling Your Map in Adobe Illustrator: Objects vs Layers

One of Adobe Illustrator’s powerful yet occasionally confusing features is the ability to apply fills, strokes and Graphic Styles to art at either the Object level or the Layer level. This is extremely useful because you can effectively use Layers to set up symbology templates so that any art that is drawn on a Layer inherits its appearance from that Layer. Confusion often arises when users combine art styles at both the Layer and Object levels, and cannot figure out why their map does not look how they expect it to look. Most of the examples here are going to be based around using the Appearance panel to apply strokes and fills.


Selecting Objects or Selecting Layers

The first decision you have to make is how you select your art. You can either select the layer that the art is on or directly select the art itself. This determines where the changes you make get applied. In order to select the layer, click the circle to the right of a layer name in the Layers panel. You will see that the layer is selected (also known as targeted) by the addition of another circle around the first circle.

Selected Layer.

To select all the art on a layer you can either click in the space to the right of the circle, or Alt-click the layer name.

Selected Art.

If you expand the layer you can see that the art is targeted rather than the layer.

Targeted Art.

Whichever method you use, you will see the art on the canvas appear as selected.

Selected Buildings.

Of course you can select individual art using the Selection tool or clicking to the right of the circle next to the object name in the Layer panel.


Changing Strokes and Fills

One advantage of selecting art at the layer level over selecting art directly is the access to the strokes and fills in the Appearance panel.

Selected Layer’s Stroke and Fill are unavailable.

If you select the layer, you do not get direct access to the art’s strokes or fills, however if you select the art you do.

Selected Art’s Stroke and Fill are available.

You can add more strokes or fills in the Appearance panel, but if you want to add strokes or fills at the layer level, they are additional to the strokes or fills that are defined at the object level. We can see this if we style the fields individually with different fills, perhaps representing different crop types. We could also add a stroke to each object, or we can add the stroke to the layer. Adding strokes or fills like this is useful when you want to ensure that all art on that layer shares the same symbology.

Object level Fill and Layer level Stroke.

Directly changing the appearance of objects is reflected both in the Appearance panel and the object thumbnails in the Layers panel.

Object appearance is shown in thumbnails.

However, if you add extra strokes or fills at the layer level, these are not shown in the objects thumbnails.

Layer appearance is not shown in thumbnails.

One important consideration is that it is not possible to use the Appearance panel to adjust several pieces of art with different fills or strokes that are applied at the object level. For example, suppose we have changed the colours of several building outlines, and now want to change them back to black. If we select them all, we will see that the stroke option is not available in the Appearance panel, rather it says Mixed Appearances. The fill is still available to be changed as it is the same for all objects.

Objects with mixed appearances.

Altering appearances can have different results if applied to objects or layers. A good example is a street style that is created with two strokes. If this is applied at the object level, each object is considered separate and you end up with overlapping paths.

Overlapping stroke styles.

However, if this style is applied at the layer level, the paths are styled at the same time and appear to be merged.

Merged stroke styles.


Applying Graphic Styles

Graphic Styles are great to easily add combinations of strokes, fills and effects to art, and these can also act differently when applied to objects or layers. In the Graphic Styles panel we have a Graphic Style with null fill and stroke, but a drop shadow added. If we try to add this directly to the building art, the null fill and stroke will cause the buildings to disappear.

Object disappears when this style is applied.

However we can add it to the Buildings layer and the effect is successfully combined with the object level appearance.

Graphic style applied to the layer.


Resolving Appearance Confusion

As mentioned earlier, it is possible to combine object level and layer level appearances. This can get complicated if you have different objects on the same layer with different appearances as well as appearance modifications at the layer level. Trying to work out why you cannot adjust the style of your paths because you are getting Mixed Appearance in the Appearance panel can be frustrating.

The easiest method to fix this is to use the Clear appearance button in the Appearance panel. Keep in mind that this will totally remove any appearance formatting that you have applied to your layers or objects, so it is worth creating Graphic Styles of the appearances you want to retain. Just like changing appearances, this button works at both the object and layer levels.

The Clear appearance button is a useful way to remove appearance properties.

An example of how layer and object appearances can get confused is multiple white strokes applied to different text objects in different ways. The user has created several text objects labelling fields and added strokes to them in various different ways. However, he’d like to remove the strokes from all the text now. You can see that the different labels all have black fills and white strokes, but are subtly different.

The first thing to do is check the Layers panel. We can see that the target indicator for the Field Labels layer is raised. This indicates that an appearance has been applied to this layer.

The embossed circle (or meatball) shows an appearance has been added.

Once we click on this we can use the Appearance panel to remove it with the “Clear Appearance” button.

The Clear appearance button is a useful way to remove appearance properties.

That has removed the stroke from the layer and one of the text objects now has no stroke, but some of them still do.

The layer strokes have been removed.

If you expand the Field Labels layer in the layers panel you will see that some of the objects on the layer also have appearances applied directly to them.

Some of the text objects have modified appearances.

You can select these objects and use the Appearance panel to remove its strokes as well by clicking the Clear Appearance button.

Clicking on the clear appearance button will remove the stroke.

This leaves us with one final label down in the bottom right corner that still has a stroke, but has not had its appearance modified via the Appearance panel.

Some of the text objects have modified appearances.

The easiest way to remove the stroke from this object is just to make sure the stroke is in front of the fill at the bottom of the main toolbar and click on the “None” option. Now all our field labels have a simple style.

All of the text objects have a simple appearance.

How MAPublisher works

MAPublisher styling tools all work on an object level. This is because MAPublisher has the ability to independently style objects by attributes they possess. For example you can create a new MAP Theme for the Fields layer based on an attribute called “crop”. This will style each field differently using depending upon its crop type.

Area Stylesheet theme.

Objects will be styled using standard fills and strokes, rather than using the Appearance panel.

Applied theme.