With the latest release of Geographic Imager 5.2, it’s now possible to easily import images directly from an ArcGIS Online account or an ArcGIS web service. This will allow you to use shared data within your ArcGIS Online organizational account and connect to publicly available map servers from various online sources.
ArcGIS Online is a collaborative web GIS that allows you to store and share GIS data using Esri’s secure cloud. Before, you may have had to download raster layers to your local machine and then import them into Adobe Photoshop using Geographic Imager. Now, Geographic Imager has a much-improved workflow to get ArcGIS Online image layers into Adobe Photoshop with full georeferencing.
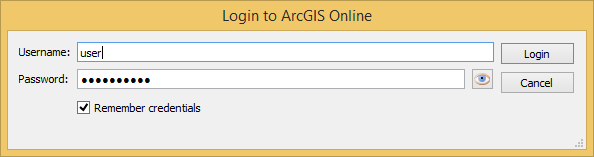
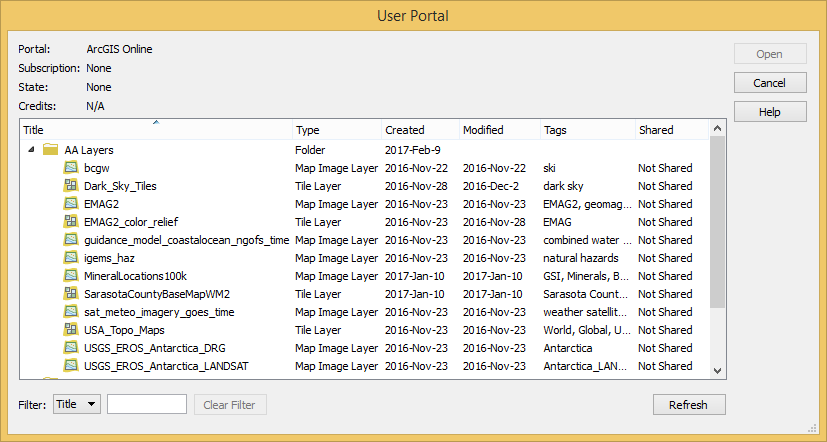
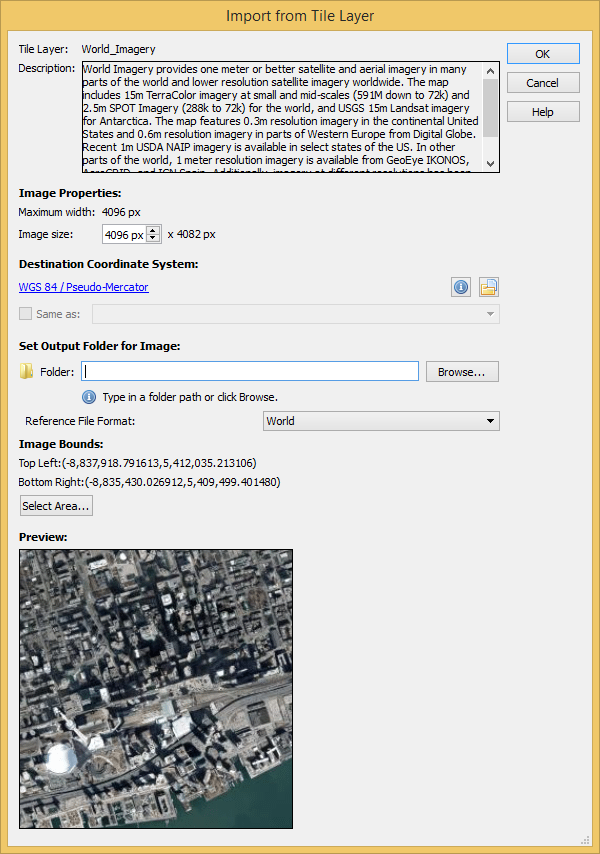
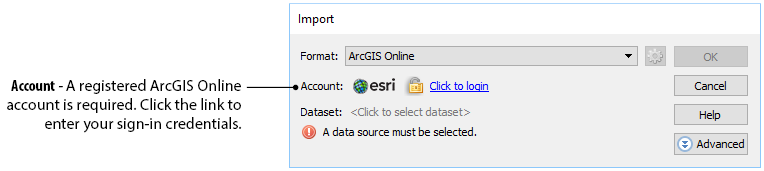
Currently, the types of datasets allowed are Map Image Layers and Tile Layers. To load a layer, open Advanced Import and select ArcGIS Online from the Format drop-down list. Enter the credentials for your ArcGIS Online account and select an image layer from your user portal.
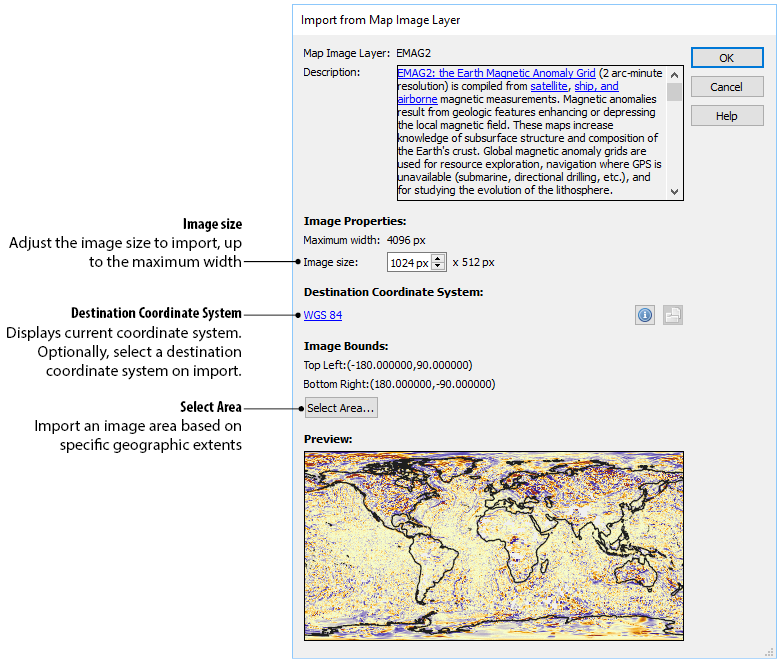
Images can be resized and transformed on import. To extract a specific area from the image, click Select Area. The interface is the same as the one used for WMS Import.
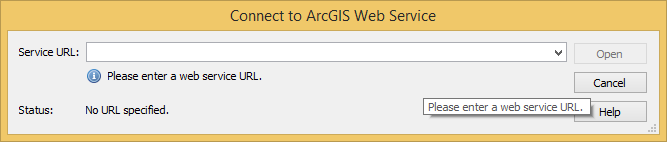
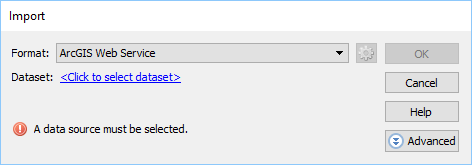
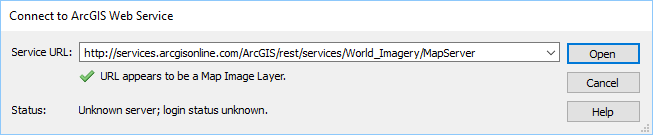
In addition to using your own organization’s data, you can connect to publicly available data from a wide variety of organizations by connecting to an ArcGIS Web Service. To connect to a web service, use Advanced Import and select ArcGIS Web Service from the Format drop-down menu. Click Browse and enter the URL for the service. This is a great option when searching for data from open data portals created by government agencies.
Avenza will be showcasing at the 7th Chinese Surveying, Mapping and Geoinformation Technology and Equipment Exhibition from November 8 to 10, 2017.
Avenza product specialists will be present in Booth H16 to demonstrate and discuss MAPublisher, Geographic Imager, and the Avenza Maps app during each day of the exhibition.
More about the 7th Chinese Surveying, Mapping and Geoinformation Technology and Equipment Exhibition
The exhibition is guided by the Ministry of Land and Resources of the People’s Republic of China. It is hosted by China Society for Surveying, Mapping and Geoinformation and China Instrument Manufacturer Association.
The exhibition held annually from 1996, and has changed its name to Chinese Surveying, Mapping and Geoinformation Equipment and Technology Exhibition, which also called Chinese Surveying, Mapping and Geoinformation Expo. Now it has become the most influential platform of this industry, and it is recognized in China’s first brand and Asia’s largest brand exhibition.
Avenza Maps is capable of importing and displaying georeferenced maps in several different formats. The app processes a map by rasterizing and tiling it on import. The speed and result of processing will vary depending on the type of file used and the size and dimensions. We’ll discuss the types of files allowed and the advantages of each.
Usually larger files take longer to process than smaller ones with some exceptions. An image may have a very high resolution but a small disk size due to image compression. It is recommended that images be less than 100 megapixels for upload to the app. A geospatial PDF file with many vector features may also take a long time to process. In this case, you should convert the file to an image to avoid having to rasterize vector data in the app.
Maps can be loaded into the app faster by processing them before import. Maps can also be preprocessed by uploading them to the Avenza Maps Store or using the Export to Avenza Maps tool in Geographic Imager or MAPublisher.
Comparison of Allowed File Types
GeoTIFF
A GeoTIFF is a TIFF file (Tagged Image File Format) with spatial information embedded in the file. This format is typically the preferred format for uploading directly to Avenza Maps without preprocessing. Since this is an image format, the app doesn’t need to rasterize the file on import meaning processing times will generally be faster compared to PDF’s, and it will maintain the native resolution.
It is also possible to import a normal TIFF file by zipping it with a TIFF World File (TFW) and either a WKT or PRJ file which contains projection information. It is best not to do this for the sake of simplicity. Usually, any GIS software that can produce a world file will also be able to save to GeoTIFF.
Geospatial PDF
A Geospatial PDF stores spatial data in either raster or vector format as well as associated attributes and layer information. Files should comply with the Adobe Acrobat PDF 1.7 specification which has been standard since 2006.
Avenza Maps rasterizes geospatial PDF files on import which discards layer and attribute information. PDF files typically take longer to process than image files. There is also a chance that the file may process incorrectly (e.g. discarding labels).
Despite this, there are some instances when it may be preferable to use a geospatial PDF file. For example, the map may already be in this format and isn’t worthwhile to convert to another format. Geospatial PDF files tend to be smaller than image files so they would be a good solution if device storage space or download speed is an issue. Also, occasionally converting from PDF to TIFF degrades the image quality and may make maps illegible.
To ensure a geospatial PDF file has a good balance between size and quality, open the file in Adobe Acrobat and go to Advanced > PDF Optimizer. This is especially helpful if the map contains large raster images.
JPEG
JPEG is an image format like TIFF but it does not have the ability to store spatial information. To load a JPEG into Avenza Maps, it must be zipped with a JPEG World File (JGW) and either WKT or PRJ file. JPEG files are compressed so this may be an option to consider if file size is a consideration, however, a better alternative would be to compress a GeoTIFF file.
Processing Maps with MAPublisher, Geographic Imager, and the Map Store
It is best to process maps before loading them into the app because desktop computers are more powerful than mobile devices. It also avoids having to process the file each time the map is loaded onto a device. Geographic Imager and MAPublisher each have a utility to export to an Avenza Maps package with the capability to upload directly to the Avenza Map Store if you have a vendor account.
Running these utilities produces a folder that contains a ZIP file with a thumbnail to show a preview of the map, a reference file, and a folder called tiles that contains a tiled version of the map in PNG format. This ZIP file can be imported into the app in the same way as other files.
In the latest GeoJSON specification (2016), the coordinate reference system for all coordinates is a geographic coordinate reference system—using the World Geodetic System 1984 (WGS 84) datum—with longitude and latitude units of decimal degrees. The previous specification (2008) allowed for the use of alternative coordinates systems, but this was removed because of interoperability issues.
MAPublisher still recognizes GeoJSON files with a specified coordinate system even though it is no longer officially supported. However, if no coordinate system is specified, MAPublisher will assume the coordinates are in WGS 84. Occasionally, this may cause a problem of improperly formatted files that contain projected coordinates but have no specified coordinate system. In this case, users will need to either choose a coordinate system during import or modify the GeoJSON file by adding a coordinate reference system (CRS) object manually.
Selecting a Coordinate System on Import
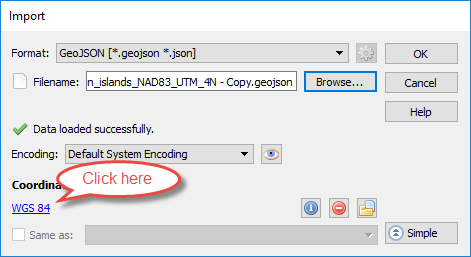
To change the coordinate system using the Import dialog box, click Advanced and select the WGS 84 link under Coordinate System. Ignore the warning about changing the coordinate system by clicking “Replace coordinate system”. Select the correct projected coordinate system from the list.
Modifying the GeoJSON File Manually
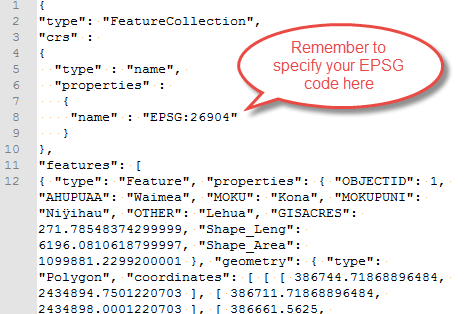
Coordinate reference systems can be specified in a GeoJSON file using a CRS object. You can view the contents of any GeoJSON file by opening it in a text editor such as Notepad. Copy and paste the text below after the line: “type”: “FeatureCollection”, (usually on line 2). Change the EPSG number to the correct CRS for your dataset. See Spatialreference.org to lookup an EPSG code.
Connect to Esri® ArcGIS Online within Adobe Photoshop to import image layers
Toronto, ON, February 7, 2017 – Avenza Systems Inc., producers of the Avenza Maps app for mobile devices and geospatial plug-ins for Adobe Creative Cloud, including MAPublisher® for Adobe Illustrator®, is pleased to announce the release of Geographic Imager 5.2 for Adobe Photoshop®. This latest update includes many new features including full compatibility with the latest Adobe Photoshop Creative Cloud 2017 release.
This Geographic Imager release also introduces the ability to import spatial image layers directly from Esri’s ArcGIS Online accounts and web services into Adobe Photoshop enabling users to harness Geographic Imager’s and Adobe Photoshop’s tools to edit georeferenced high-resolution imagery.
“This release means that both Geographic Imager and MAPublisher are fully compatible with Adobe CC 2017 and have ArcGIS Online integrated,” said Ted Florence, President of Avenza. “We’re continuously providing more ways for our users to import their data into an excellent map design environment,” he added. “Avenza software covers your needs from any point in your mapping workflow, including output to mobile devices.”
Enhancements and new features of Geographic Imager 5.2
Fully compatible with the latest Adobe Photoshop CC 2017
Sign-in and import Map Image Layers, Tile Layers, and web services from ArcGIS Online with complete spatial referencing
ENVI HDR Raster and DEM support
Tiling improvements and optimizations
Various user interface and usability enhancements
More about Geographic Imager for Adobe Photoshop
Geographic Imager for Adobe Photoshop leverages the superior image editing capabilities of the world’s premier raster-based image editing software and transforms it into a powerful geospatial production tool. Work with satellite imagery, aerial photographs, orthophotos, and DEMs in GeoTIFF and other major GIS image formats using Adobe Photoshop features such as transparencies, filters, and image adjustments while maintaining georeferencing and support for hundreds of coordinate systems and projections.
Geographic Imager 5.2 is immediately available and free of charge to all current Geographic Imager Maintenance Program members and at US$319 for non-maintenance upgrades. New fixed licenses start at US$699. Geographic Imager Basic licenses start at US$99. Academic, floating and volume license pricing is also available. Visit www.avenza.com/geographic-imager for more details.
More about Avenza Systems Inc.
Avenza Systems Inc. is an award-winning, privately held corporation that provides cartographers and GIS professionals with powerful software tools to make better maps. In addition to software offerings for Mac and Windows users, Avenza offers value-added data sets, product training and consulting services, as well as the Avenza Maps app for purchasing and using maps on iOS, Android, and Windows devices. Visit www.avenza.com for more details.
For further information contact:
416-487-5116
info@avenza.com
www.avenza.com
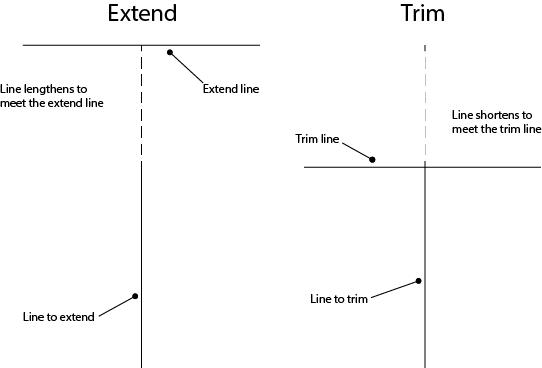
The latest release of MAPublisher includes the ability to trim and extend objects to a crossing or intersecting path. Extending a path lengthens it to meet the edge of a crossing object and trimming a path cuts the portion that extends past the edge of an intersecting path. Trim and extend tools are commonly used in CAD software and will greatly improve the ability to produce accurate and precise data in MAPublisher and clean-up imported data.
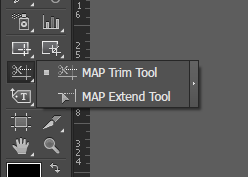
Location of the Trim and Extend tools on the Adobe Illustrator Tools panel. Click and hold the tool button to switch between MAP Trim Tool and MAP Extend Tool.
The MAP Trim Tool and MAP Extend Tools are located on the Adobe Illustrator Tools panel. Click and hold the MAP Trim or Map Extend tool button icon to switch between them. To use the tools, select the crossing or intersecting path and click the object to extend or trim. The diagram below illustrates the basic process.
Visualization of the trim and extend processes
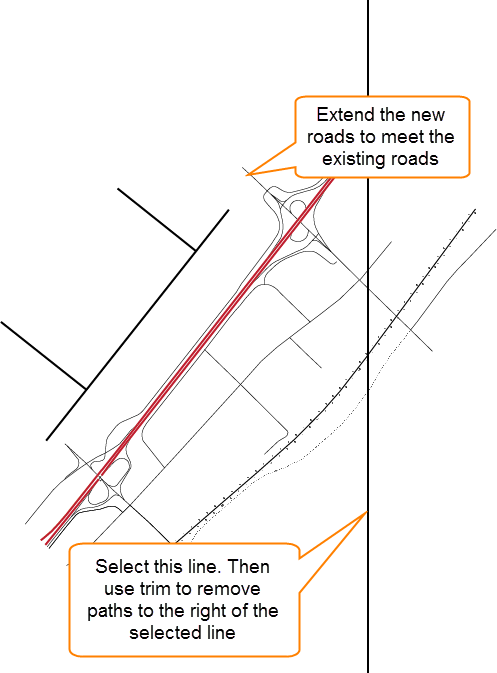
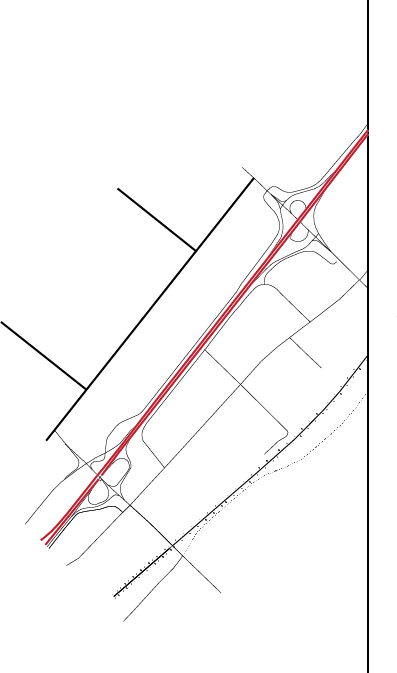
There are many possible applications for these tools in digitizing and cleaning map data. In a hypothetical example illustrated below, we trim all the roads that extend past the edge of a border, and extend the imported roads (in bold) to meet the existing roads.
Examples of uses for the trim and extend tools. Extending imported roads to match existing roads and trimming lines that fall outside of a map borderLines trimmed and extended!
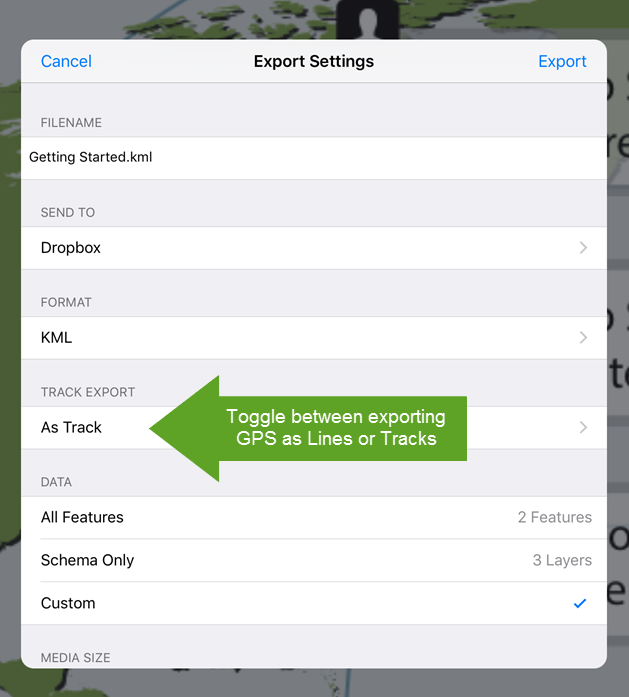
There are two methods of exporting GPS tracks from Avenza Maps in KML format: as a line and as a track. Which option to select depends on the intended purpose. Lines are much simpler than tracks and store only the position of each vertex in the line as latitude longitude and elevation. Tracks contain a complete description of how the path moves through space including the position at one-second intervals, the time at which each position was recorded, the compass angle of the heading, and the velocity. Lines take up much less storage space than tracks. To switch between exporting to Lines or Tracks, select Track Export in the Export Settings screen.
Export Settings screen
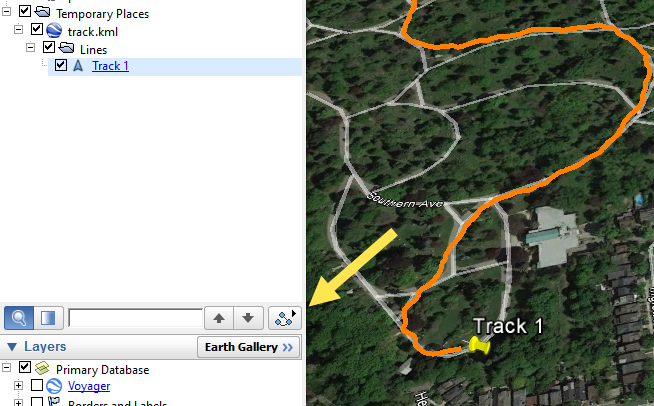
Tracks are useful in applications where the GPS position at a given time and space is important. For example, in Google Earth there is an option to record a tour that moves to predetermined places on the globe. This would be useful if you wanted to follow along on a hiking path or do a virtual walkthrough of a proposed building development. To make a tour from a track, open the KML file in Google Earth, select the track in the places panel, and click the Play Tour icon. The animation below shows a walk through Mount Pleasant Cemetery in Toronto, Canada. Lines contain only the location information: latitude longitude and elevation. Export to line when the time data is not important such as if you are making a map of a hiking trail.
Play tour in Google EarthA tour of Mount Pleasant Cemetery in Toronto, Canada using Google Earth
KML Code for Lines and Tracks
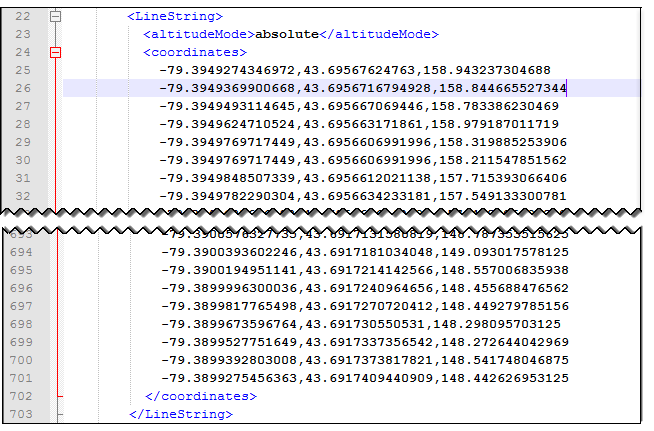
KML (short for Keyhole Markup Language) is an XML notation for displaying spatial data in web applications. It was developed for use with Google Earth and can be read by many programs. Avenza Maps uses KML to import and export placemarks, lines, and tracks. You can view and modify KML files in any text editor. The KML element used for lines is called a Linestring which is defined as “a connected set of line segments”. A Linestring element contains a coordinates tag which is a list of longitude and latitude positions in decimal degrees and elevations in meters.
KML Linestring code sample
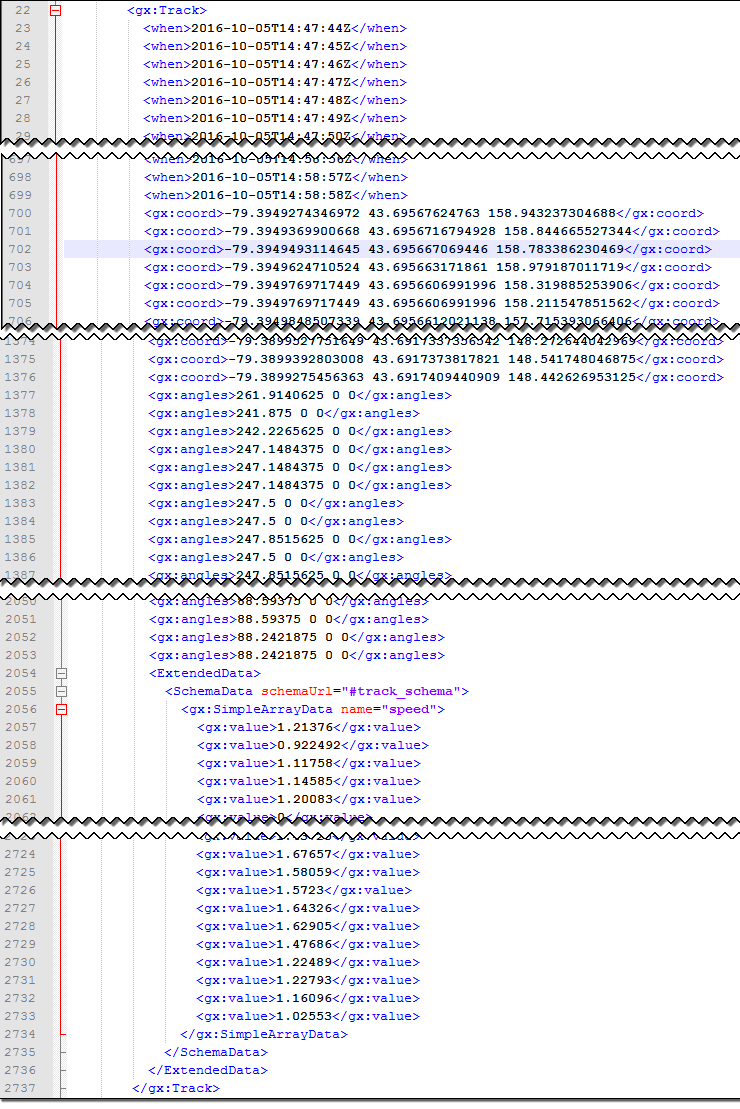
Tracks use the KML element “gx:Track” which contains several tags.
when – the date and time a point was recorded in UTC
gx:coord – the location of the point in decimal degrees and the elevation in meters
gx:angle – the current heading in compass degrees (i.e. 0 degrees is north, 90 is degrees east and so on)
gx:value tag defined as “speed” – the current speed in meters per second
There are equal numbers of each of these tags. A full description of the vertex includes all the tags in the same sequence. For instance, the first when tag, coord tag, angle tag, and speed tag, describe the first vertex in the track.
With the latest release of MAPublisher 9.9, it’s now possible to easily import layers directly from an ArcGIS Online account or an ArcGIS web service. This will allow you to use shared data layers within your ArcGIS Online organizational account and connect to publicly available map servers from various online sources.
ArcGIS Online is a collaborative web GIS that allows you to store and share GIS data using Esri’s secure cloud. Before, you may have had to download layers as shapefiles to your local machine and then import them into Adobe Illustrator using MAPublisher. Now, MAPublisher has a much improved workflow to get ArcGIS Online layers into Adobe Illustrator will full georeferencing, all map features, and attributes.
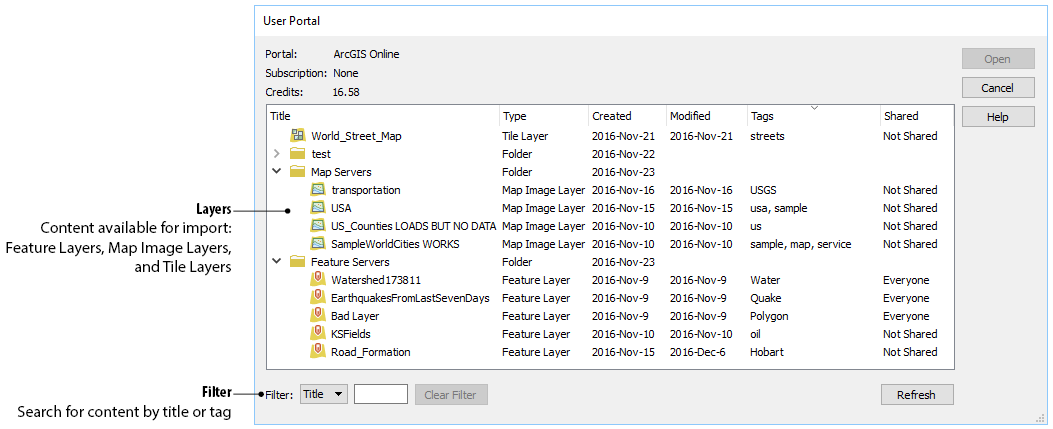
Currently, the types of datasets allowed are Feature Layers, Map Image Layers and Tile Layers. To load a layer, use MAPublisher Import as you would with any data type and select ArcGIS Online from the Format drop-down menu. Click the login link to enter your ArcGIS Online credentials to access your organization’s web portal.
Import ArcGIS Online dialog boxArcGIS Online user portal
Feature Layers contain vector data that will import as artwork into Adobe Illustrator. Optionally, you can extract specific features using standard SQL queries. Map Image Layers and Tile Layers are raster data layers that can be added by selecting the geographic extents.
Import Image Map Layer
In addition to using your own organization’s data, you can connect to publicly available data from a wide variety of organizations by connecting to an ArcGIS Web Service. To connect to a web service, use MAPublisher Import and select ArcGIS Web Service from the Format drop-down menu. Click to select the dataset and enter the URL for the service. This is a great option when searching for data from open data portals created by government agencies.
Import ArcGIS Web ServiceValid ArcGIS Web Service
Accessing Esri’s online services through MAPublisher provides a great opportunity to use shared data within your organization and access a wide variety of publicly available data. We’re sure you’ll find it very useful for finding data to make great maps.
MAPublisher Grids and Graticules is a powerful tool. There are dozens of settings to create an indexed grid, measured grid, or graticule exactly the way you want. We often receive questions about how to create certain grid and graticule styles and this was interesting. We were asked how to create a graticule to display a very specific latitude and longitude, perhaps even by itself (only a single line of latitude or longitude).
Creating a single graticule line
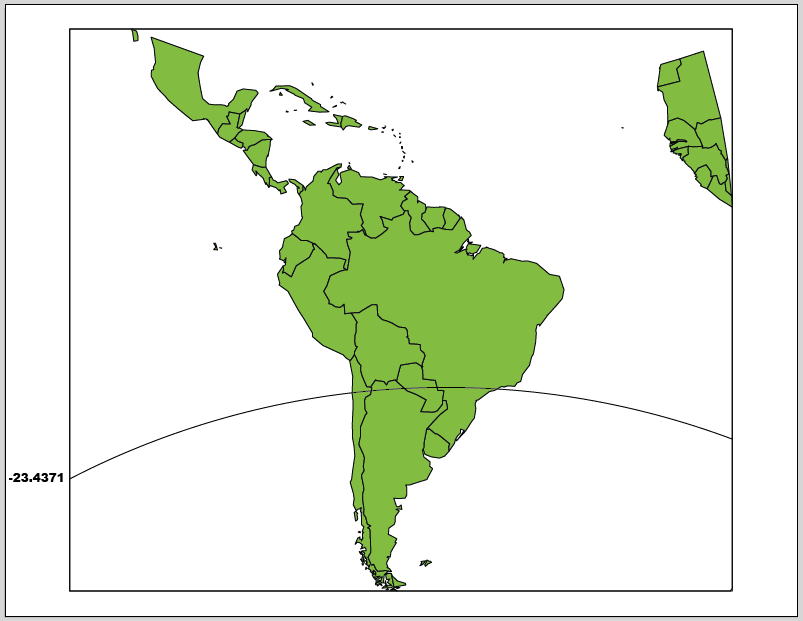
In this example, we’re going to create a graticule that will only display the Tropic of Capricorn at -23.4371 degrees (or 23.4371 degrees south of the equator).
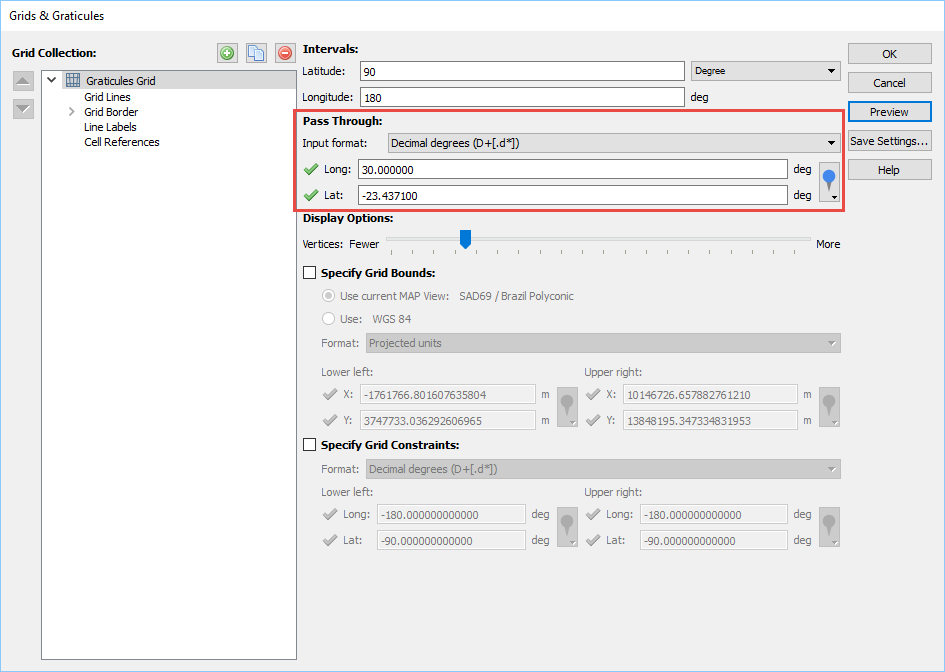
On the MAPublisher toolbar, click the Grids and Graticules button to open the dialog box. Click the Graticules button to create one. On the Graticules Grid main settings, the important setting to note here is the Pass through section — it specifies lines of latitude and longitude that must be included in the graticule. Enter 30 deg Long and -23.4371 deg Lat. This means that a graticule line must pass through -23.4371 degrees latitude (the Tropic of Capricorn). The reason why a line at 30 deg longitude is specified is to hide it from the map view (it is placed at 30 deg longitude outside of the map extent).
Pass through setting
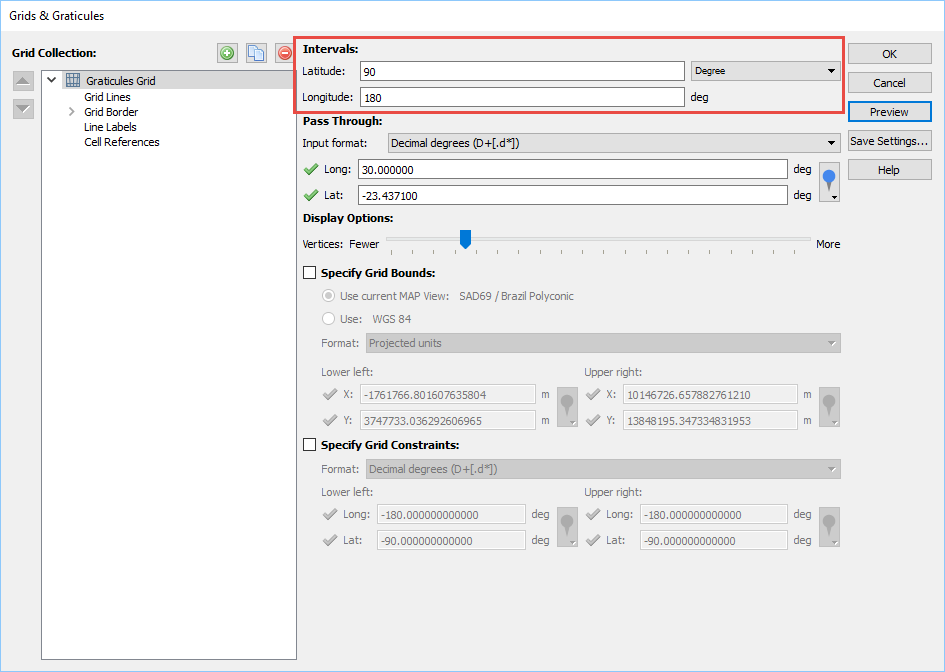
In the Intervals section, set 90 deg Latitude interval and 180 deg Longitude interval. Because the intervals are at the extreme, this means that the the only lines left to display are the ones specified in the Pass through section (30 deg long and -23.4371 deg lat). In this case, it will only display a single line of latitude (the Tropic of Capricorn) for the graticule.
Intervals setting
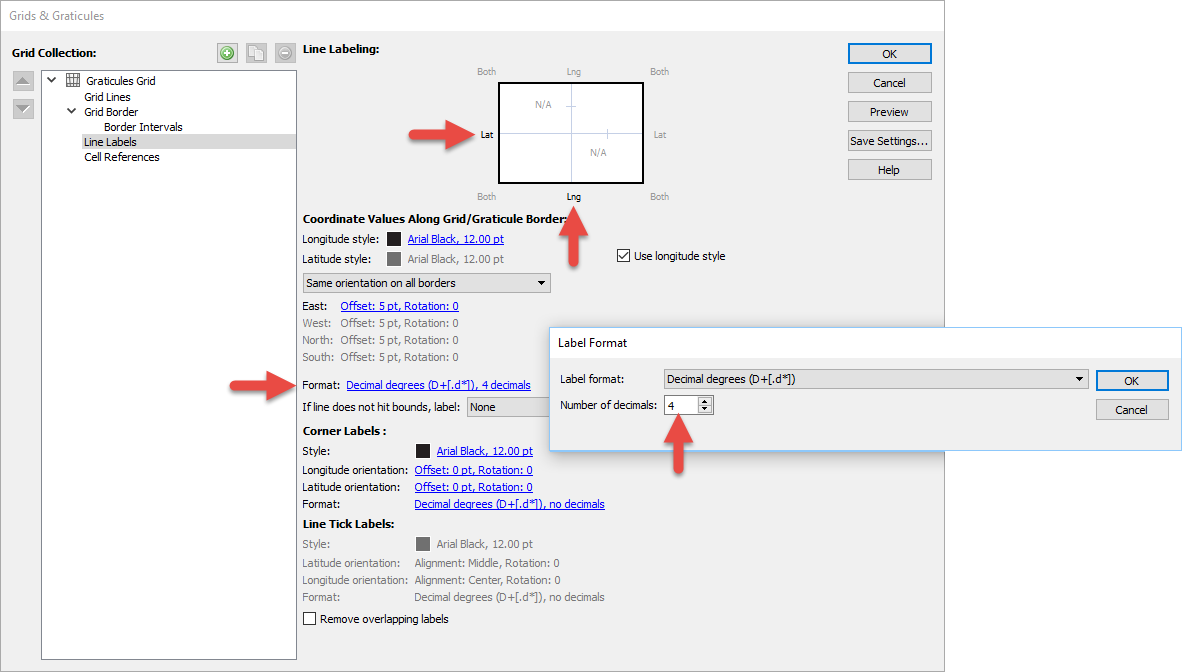
If you want to label the graticule, go to the Line Labels setting. Click the Lat and Lng on the grid label control to enable them. To control how many decimals are displayed, click the Format setting, then change the number of decimals to something greater than 0.
Label settings
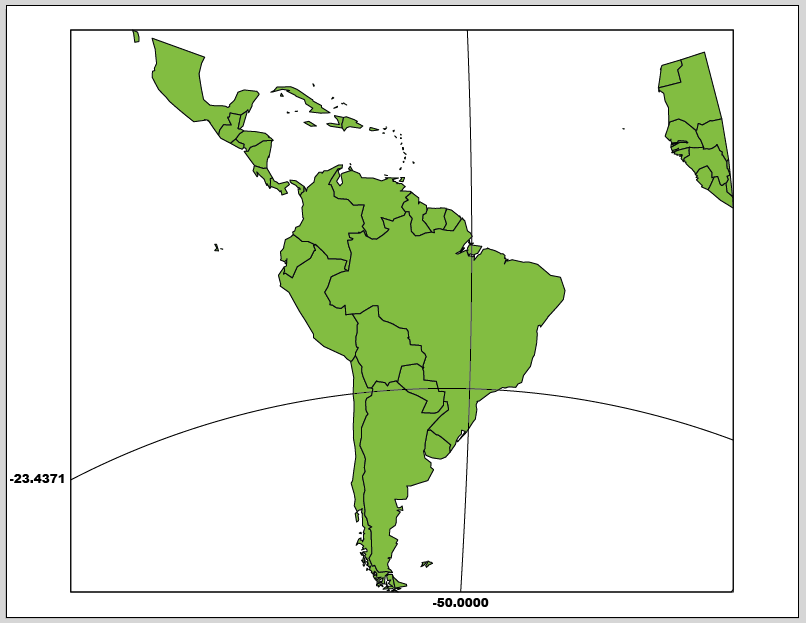
To intersect single lines of longitude and latitude, adjust the Pass through setting so that the line is within the map’s extent. In this case, it was set to -50 deg (50 deg west).
Intersect single lines of longitude and latitude
Remember that you can share Grids and Graticules settings with anybody by clicking the Save Settings button, selecting a destination folder and sharing the configuration files.
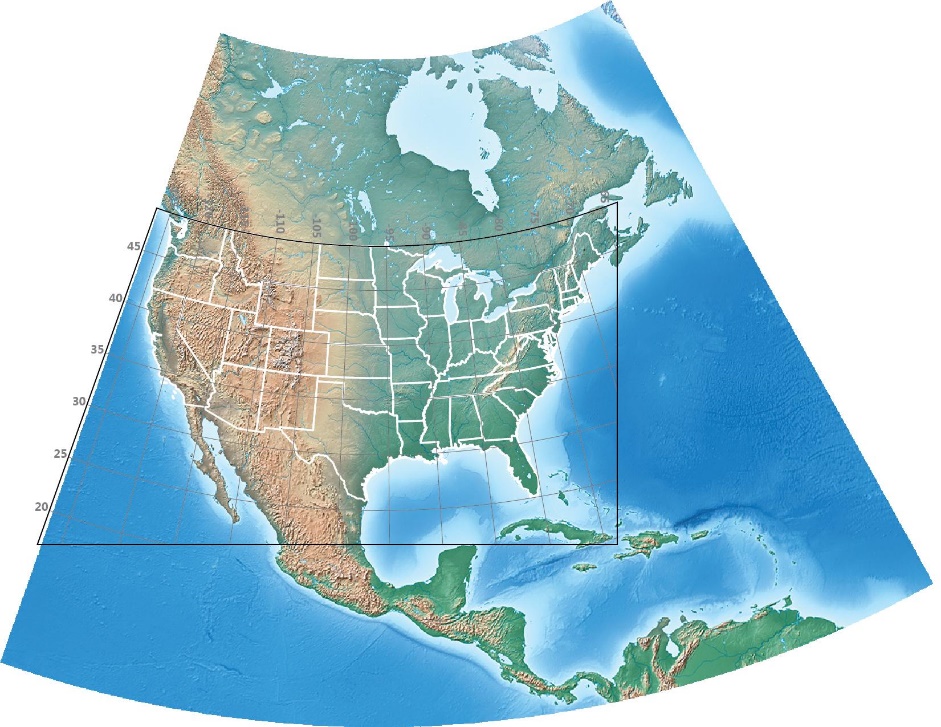
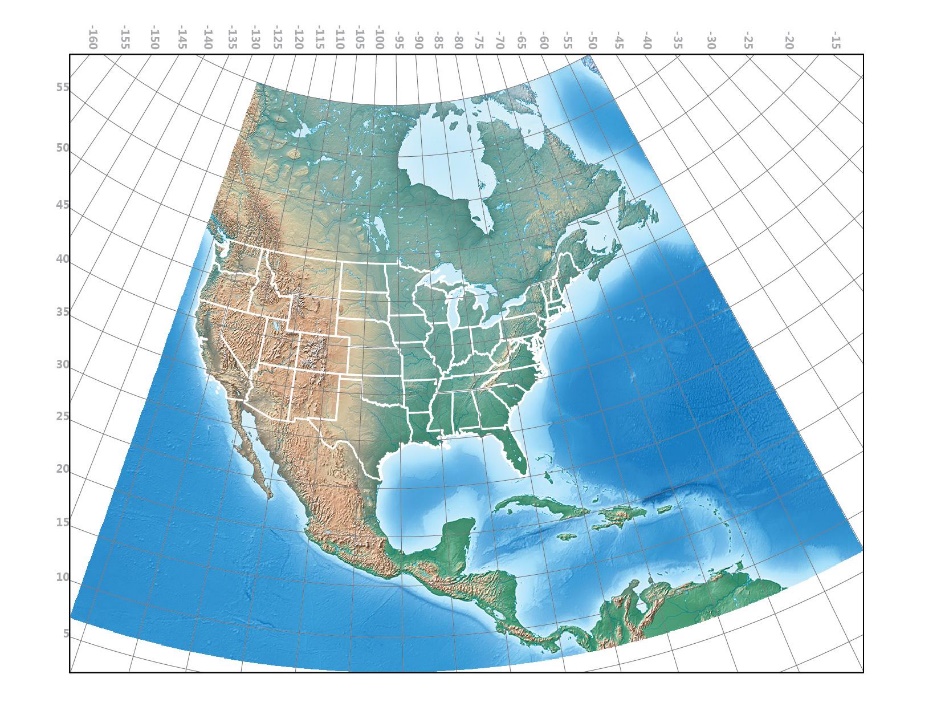
A graticule is the network of lines of latitude and longitude drawn at regular intervals on a map. Graticules are created in MAPublisher using the Grids and Graticules tool. In some maps, you may want to limit the area on the map that a graticule covers. For example, you may want it to cover only the map’s area of interest. The image below is a map of North America with a graticule drawn at 5-degree intervals. US State boundaries are drawn in white. In this post, we’ll modify the graticule three times so it conforms to the edges of the image, so it covers only the Continental United States, and lastly a combination of the previous two modifications.
North America with a graticule of 5 degree intervals.
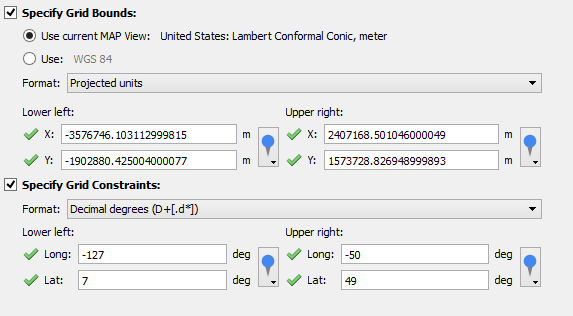
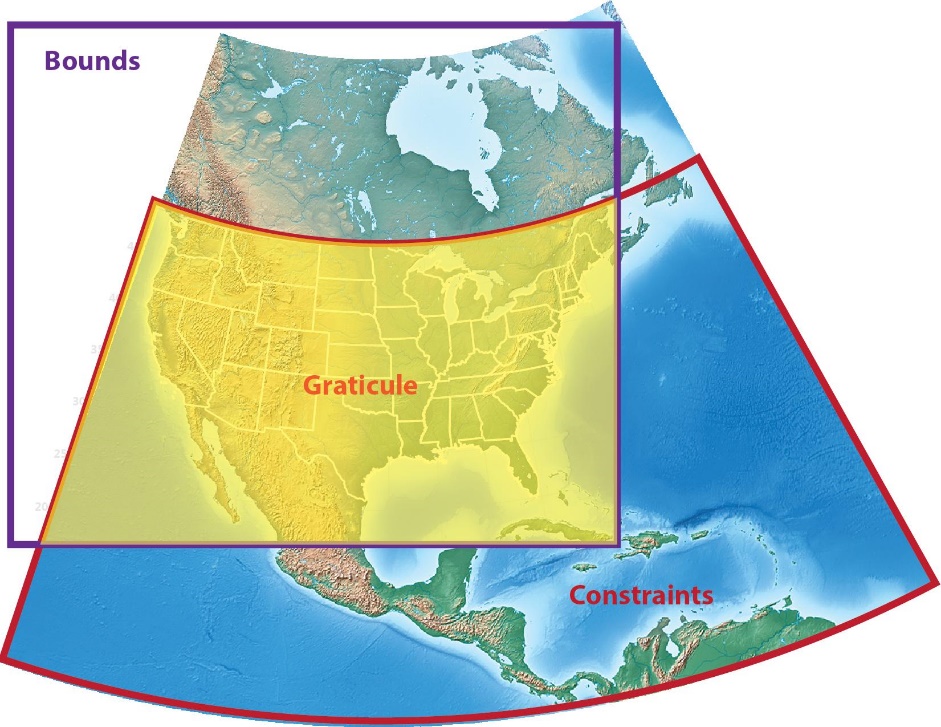
MAPublisher can limit the geographic extents of a graticule in two ways: using Grid Bounds and using Grid Constraints. In both cases, you’ll specify the lower left and upper right corners of the graticule. Specifying Grid Bounds will limit the extent of the graticule to a rectangular area while specifying Grid Constraints will limit the graticule along lines of latitude and longitude. If both Grid Bounds and Grid Constraints are specified, the graticule will cover an intersection of the two areas. The image below shows bounds and the constraints and the intersecting area which forms the graticule.
Bounds and the constraints and the intersecting area which forms the graticule.
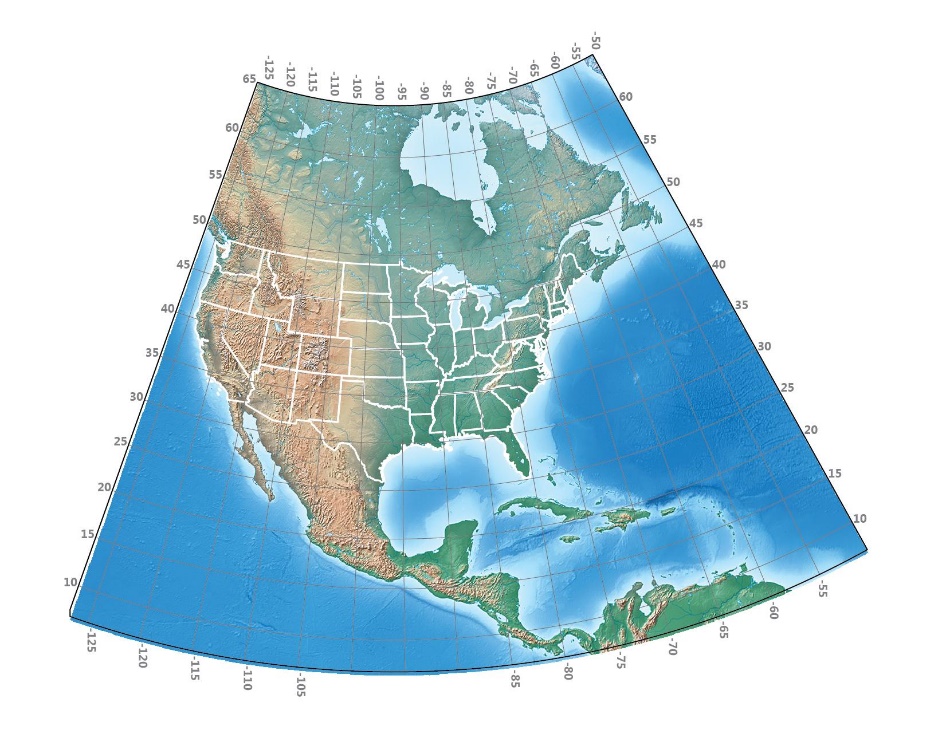
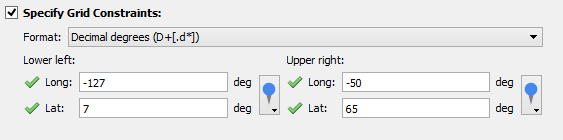
To modify a graticule so that it conforms to the edges of the image, you’ll need to specify grid constraints. In the Grids and Graticules dialog box, click the Specify Grid Constraints check box and set the Lower Left and Upper Right corners to the corners of the image which are -127°, 7° and -50°, 65° respectively.
Specifying Grid Constraints.
To create a rectangular graticule covering only the lower 48 states, click the Specify Grid Bounds check box and set the Lower Left and Upper Right corners to the corners of that area. Tip: click the MAP World Locations drop-down arrow to choose the values for the lower left and upper right corners.
Specifying Grid Bounds.
When both Specify Grid Bounds and Specify Grid Constraints check boxes are both checked, the graticule will cover an intersection of each of the extents. For instance, in the map below, the northern extent follows the 49th parallel at the Canadian border, the western extent is at the edge of the image (127° west) and the south and east extents are the same as in the previous map.
Both Specify Grid Bounds and Specify Grid Constraints selected.


 To create a rectangular graticule covering only the lower 48 states, click the Specify Grid Bounds check box and set the Lower Left and Upper Right corners to the corners of that area. Tip: click the
 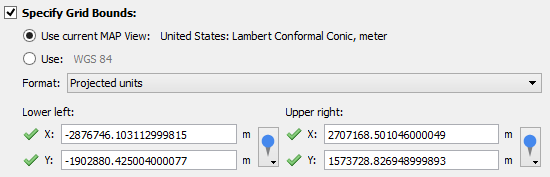 When both Specify Grid Bounds and Specify Grid Constraints check boxes are both checked, the graticule will cover an intersection of each of the extents. For instance, in the map below, the northern extent follows the 49th parallel at the Canadian border, the western extent is at the edge of the image (127° west) and the south and east extents are the same as in the previous map.