Toronto, ON, April 25, 2005 – Avenza Systems Inc., producers of MAPublisher cartographic software, announces that the Department of Earth Sciences at the University of Hong Kong, Hong Kong S.A.R., has chosen MAPublisher software for use in their remote sensing laboratory.
“MAPublisher will play an important role in the creation of high-quality maps within our department” said Prof. Jonathan Aitchison, Head of the Department of Earth Sciences at the University of Hong Kong. “We feel that good map creation and cartography are important to any geographic or geologic exercise and we are excited about using MAPublisher to enhance those skills at our school”, he added.
MAPublisher will be primarily used in the Remote Sensing Laboratory. Staff and students, particularly those working on the geodynamics of Eastern Asia, will be able to take advantage of the graphics capabilities of MAPublisher to produce high-quality maps.
More about MAPublisher
MAPublisher is powerful map production software for creating cartographic-quality maps from GIS data. Developed as a suite of plug-ins for Adobe Illustrator and Xtras for Macromedia Freehand, MAPublisher leverages the superior graphics editing capabilities of these applications with the strength and power of GIS data. Full details and downloadable demo versions are available at www.avenza.com.
More about Avenza Systems Inc.
Avenza Systems Inc. is a privately held, award-winning supplier of powerful map-making software and affordable geodata products. The Company also offers product training and consulting services. Visit www.avenza.com for more details.
More about the Department of Earth Sciences at the University of Hong Kong
The Department of Earth Sciences was recently established at the University of Hong Kong and is ideally situated on the margin of east Asia. Opportunities exist to undertake genuinely new research into the tectonic evolution of both ancient and modern orogenic systems in this fascinating area. The subtropical location and local geology of Hong Kong present significant challenges and employment opportunities for engineering and environmental geologists and are another major focus of the department.
For further information:
Tel: 416-487-5116
Email: info@avenza.com
Web: www.avenza.com
Powerful mapmaking software for Adobe Illustrator is now accessible via the Internet
Toronto, ON, April 19, 2005 – Avenza Systems Inc. is pleased to announce the immediate availability of Internet-accessible floating or networked licenses of MAPublisher 6 for Adobe Illustrator. MAPublisher 6 is feature-rich mapmaking software used to produce high quality maps from GIS data and the addition of Internet-accessible floating licenses make this powerful cartographic production environment even more efficient and workgroup-friendly. This new license format allows access to MAPublisher and all its functionality via remote access to a Windows, Mac or Linux server host using a normal Internet connection. It provides the perfect solution for users who travel, work offsite and/or for workgroups composed of decentralized personnel.
“The introduction of MAPublisher 6 floating licenses last year marked an exciting new era in MAPublisher licensing and we are now equally as excited to provide this new approach to software sharing.” said Ted Florence, president of Avenza Systems, “The MAPublisher Internet Floating license makes MAPublisher much more productive in small or large multi-user or multi-computer environments where all users are not in the same physical location and helps lower the overall deployment cost in such organizations.” he added.
Floating licenses are a wonderful cost-effective way of sharing software amongst multiple users in a networked environment and should be considered for any MAPublisher user environment in which more than one person uses MAPublisher or in which it is desired that more than one person has access to MAPublisher. Floating licenses are particularly useful for companies or academic labs with multiple users wherein not everyone uses the product at the same time. The MAPublisher Internet Floating License has all the features and benefits of a normal networked or floating license along with the added ability to remotely access it via the Internet.
MAPublisher is powerful map production software for creating cartographic-quality maps from GIS data. Developed as a suite of plug-ins for Adobe Illustrator and Macromedia Freehand, MAPublisher leverages the superior graphics editing capabilities of these applications with the strength and power of GIS data. Full details and downloadable demo versions are available at www.avenza.com.
Features/Benefits of MAPublisher Internet Floating Licenses
All the features and functionality of MAPublisher 6 for Adobe Illustrator are included.
Access to the software via a remote Internet connection
Empower multiple users and/or multiple computers without the cost of purchasing an individual specific license for each user or computer.
Allows MAPublisher to be shared among an unlimited group of potential users. The actual MAPublisher client software can be installed on an unlimited number of computers and can be used on any combination of computers concurrently, up to a maximum set by the number of floating licenses purchased.
Supports Windows, Mac and Linux servers.
Supports mixed platform (Windows and Mac) client environments.
Special laptop option enables users to borrow a license and take it on the road even when disconnected from the network.
Additional client computers and/or users can be added at no extra cost.
More about MAPublisher 6 for Illustrator Floating Licenses
MAPublisher 6 for Illustrator is powerful map production software for creating cartographic-quality maps from GIS data. Developed as a suite of plug-ins for Adobe Illustrator 10 and CS, MAPublisher 6 leverages the superior graphics capabilities of this design software package. Avenza also offers MAPublisher 5 for FreeHand – a suite of Xtras that adds mapmaking functionality to Macromedia Freehand 10 and MX.
MAPublisher floating licenses are available now directly from Avenza Systems or through the Avenza reseller network at prices ranging from US$1799. Internet-enable floating licenses start at US$1999. Users may also upgrade from fixed to floating licenses. Prices include 1 year of maintenance. Customers who purchase a MAPublisher floating license on or before May 31, 2005 will receive a free upgrade to the Internet-enabled version. Full details are available at www.avenza.com.
More about Avenza Systems Inc.
Avenza Systems Inc. is an award-winning, privately held corporation that provides cartographers and GIS professionals with powerful software tools for making better maps. In addition to software offerings for Mac and Windows users, Avenza offers value-added data sets, product training and consulting services. Visit www.avenza.com for more details.
For further information:
Tel: 416-487-5116
Email: info@avenza.com
Web: www.avenza.com
In a previous blog about Grids and Graticules, we quickly introduced one of the major features of the new Grid and Graticule tool. We’d like to share another major feature when creating grids: creating grids with an alternative coordinate system.
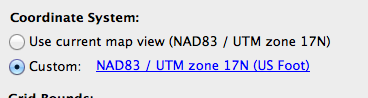
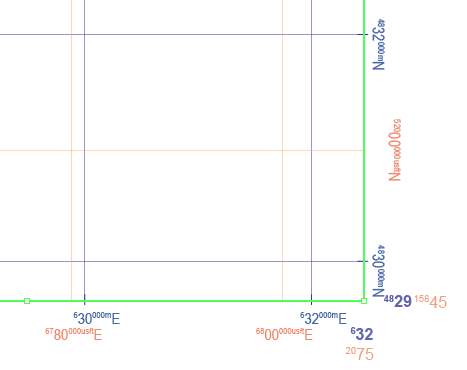
For example, the MAP View has a coordinate system “NAD 83 / UTM zone 17N” (in metres). You might want to make grid lines with the same coordinate system but in different units. You can do so by creating a custom coordinate system and then specifying the desired unit (US Foot, for this example), then creating a grid based on custom coordinate system. In this example, a grid with NAD83/UTM zone 17N (metres) coordinate system is created in the blue colour. Another grid with a NAD83/UTM zone 17N (USFoot) custom coordinate system is created with the orange colour.
Likewise, you can create multiple sets of measured grids with different coordinate systems in one MAP View (e.g. one set with NAD83 UTM, another with NAD27 UTM, another with some other local coordinate system) without the need to transform the MAP View.
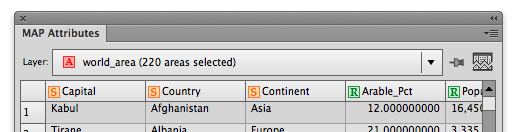
A little known (but very useful) feature is the Attribute Tear-Off Panel which is located in the upper-right corner of the MAP Attribute panel (available in MAPublisher that’s compatible with Adobe Illustrator CS6 or higher). Use it to help you edit and view attributes even when they are deselected. It is very handy when used to compare attributes of different datasets.
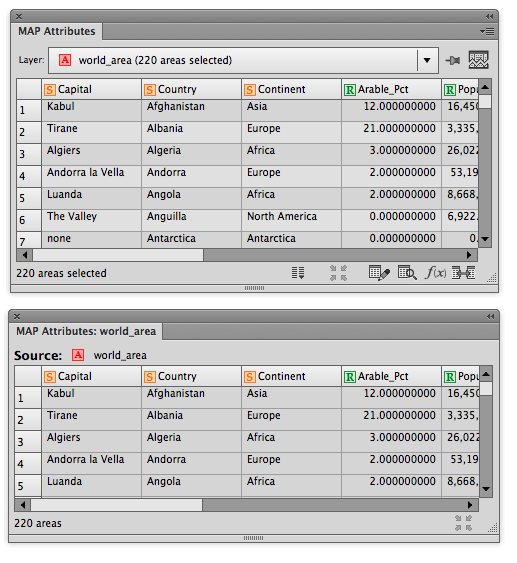
Simply click the Attribute Tear-Off Panel icon to open another MAP Attribute panel. There are a few key difference between MAP Attribute panel and Tear-off panel:
1) The tear-off panel does not have any MAP Attribute functions (e.g. Join Tables, Find and Replace, Edit Schema, etc).
2) The tear-off panel view remains active and shows attributes even after features are deselected.
If your data values are updated within MAP Attribute panel, click the Attribute Tear-Off Panel again to update the values in the tear-off panel.
This blog post was written by Avenza reseller in The Netherlands, Hans van der Maarel of Red Geographics.
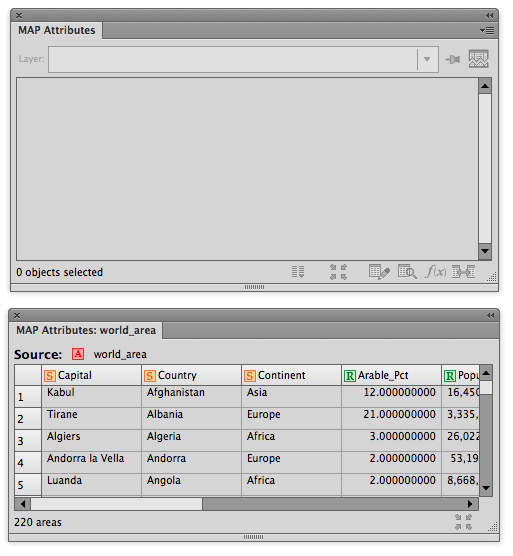
When you’re labeling point features (let’s say cities) in MAPublisher, using either Label Pro or Label Features, and you’re not placing a label for every single point, you’re left with the task of removing the points you haven’t labeled. This trick will have the text inherit the attribute structure of the points including a lat/long and guarantee that there are no orphan points.
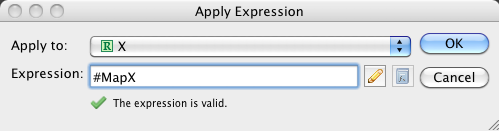
Take for example the above map. I want to label the cities, but not all of them. I’ll decide as I go along which city will get labeled, and which will get dropped. In order to more easily remove the unlabeled cities I need to do some preparation. I’ll create two columns in the cities layer, X and Y, and assign the expression #MapX and #MapY to them, respectively. It’s important that you do this through the Apply Expression option in the Map Attribute panel.
This gives two attributes with the original coordinates of the city points.
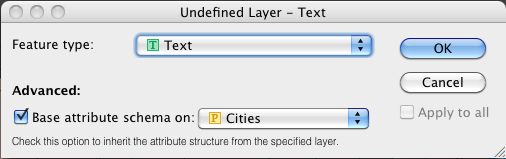
Next, I’ll create a layer for the labels and put it into the MAP View as a text layer, indicating that I want to copy the attribute structure of the cities layer.
Now that all the preparatory work is done, I’ll start the labeling. I’m going to be using the Label Features option, but this will work with MAP LabelPro as well.
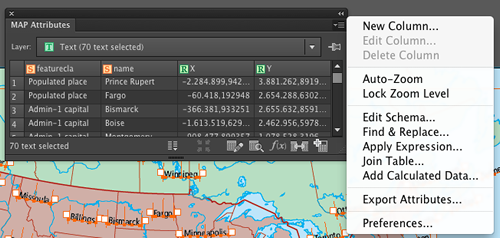
If I select one of the texts and look at its attributes, I’ll see that the attributes from the city point have been transferred to the text, including the X and Y attributes which hold the position of the original city point.
Next, I’ll remove the city points layer, select all city labels and use the Export Attributes option in the MAP Attributes panel:
This will export a comma-delimited text file (CSV). Make sure to check the “Field names on first line” option. It’s not exactly necessary, but it will make things a lot easier.
Import the CSV file back into MAPublisher. Make sure to specify that the projection of the data is the same as the existing MAP View. Once the data is imported, you can apply any existing Stylesheets that you had in place to style the cities, or create a new one. This way, you end up with just the symbols for the cities you’ve actually labeled.
Our friends in the map library at Brock University in St. Catherines, Ontario have put together a very nice how-to on creating super overlays for Google Earth using Geographic Imager and Adobe Photoshop.
These instructions describe the process of georeferencing a high-resolution image, creating a geotiff file, using Google Earth Pro to make a super overlay and how to provide access to others. The full process is outlined here https://www.brocku.ca/maplibrary/Instruction/Creating_a_super_overlay.pdf
The Brock University Map Library can be contacted at maplib@brocku.ca
HTML5 is the current major revision of HTML (Hypertext Markup Language), the core markup language of the Internet. One of its major development goals was to reduce the need for proprietary, plug-ins such as Adobe Flash and to provide new graphics drawing abilities to the canvas element of HTML5. Scripting (e.g. JavaScript) is used to draw graphics, animations, and display other types of content. The potential of applications in online mapping with HTML5 technology varies widely including uses in fields such as cartography, GIS, demographics, and statistics.
Introduction to HTML5 Map Web Author
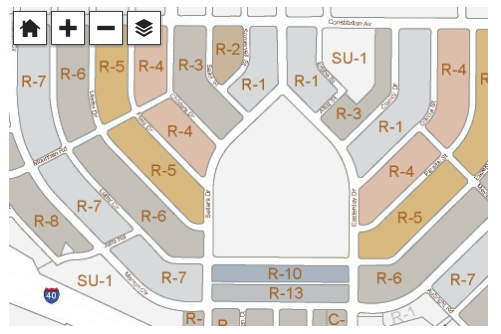
As maps become more detailed and data sources becoming richer, the way we present multiple data layers and map projections in dynamic map zoom levels and extents, traditional web mapping techniques start to become too limited. While many current web maps are rendered and served through a server, this could limit the amount of data provided and be slow to transfer as more and more tiles are served. MAP Web Author uses a technique to make maps from Adobe Illustrator compatible with browsers that support HTML5, specifically the canvas element. The maps exported using MAP Web Author are not server-side rendered, instead, they are rendered on-the-fly and content dynamically changes when the map is panned or the map zoom level is changed. This ultimately produces a more flexible, interactive and dynamic map. An HTML5 map also has more efficient storage and requires less space than other web map technologies. Stored vector map data (points, lines, and areas) is more efficient than raster tiles and can be displayed at any scale and even styled using CSS. Since HTML5 technology replaces browser plug-ins like Flash or Java, web maps generated by MAPublisher are accessible on Android, iOS, and Windows mobile devices (smartphones and tablets).
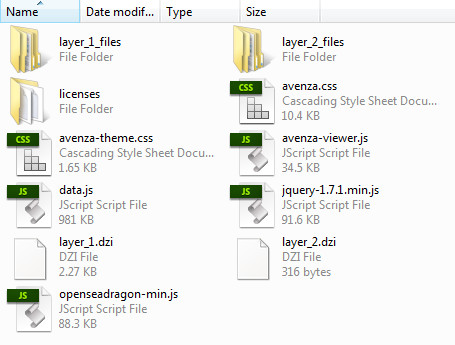
Files created from export
After exporting your map using MAP Web Author to HTML5 format, several files will be created. A ready to use index.html file and an index_data folder. The index.html file contains pre-formatted code necessary to view your map. In most instances, you can simply open the file in a browser to view the web map.
The index_data folder contains all of the necessary map layer data, JavaScript files, and CSS files to display your map.
How to embed an HTML5 web map into your site
The viewer will be embedded inside of a div element in your page (the “container div”). The map view will fill the container div.
For mobile specific sites we recommend setting the width and height of the container div to 100%, then using max-width and max-height to limit the width to the size of the map. The style should fit in the head, like this:
The following script tags must be included in the head tag as well. These scripts contain JavaScript functions that allow the map to function, like so:
Keep note that the prefixUrl points to the directory where your map data is stored. It should be a relative path to avoid cross-site access errors. The id is used below in the body of your page.
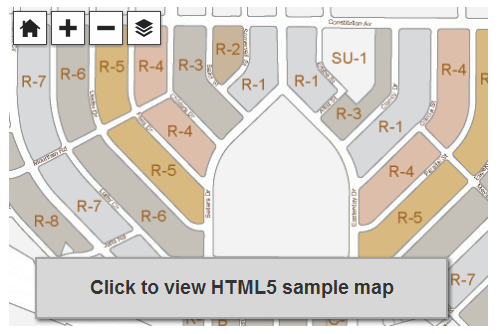
Within the body tag, place the div element where appropriate. Specifying the div element id initiates the JavaScript to display the HTML5 web map. If a browser that is not compatible is used, then the message is displayed.
<div id="map_container">
	<div style="display:none">
		<!--
		The message below will appear instead of the map if
		a user connects with a browser that does not support
		enough HTML5 for the map viewer to function. You may
		wish to customize the message for your site.
		-->
		A web browser that supports HTML5 is required in order
		to view this content. If you are seeing this message
		then your current web browser does not.

		Please upgrade.
</div>
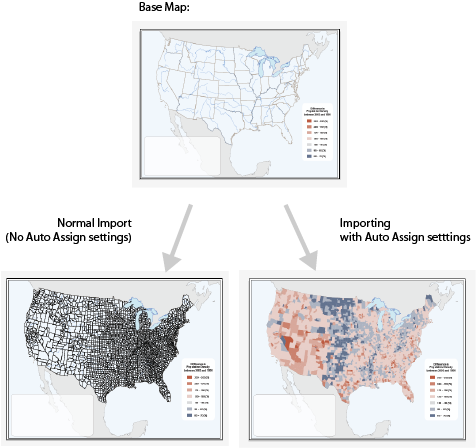
With MAPublisher 8.6 or higher, you can apply styles to GIS data upon import using the MAP Stylesheet Auto Assign feature.
You will need to prepare MAP Stylesheet theme(s) and set the Auto Assign settings within every stylesheet. In this example, there is only one stylesheet.
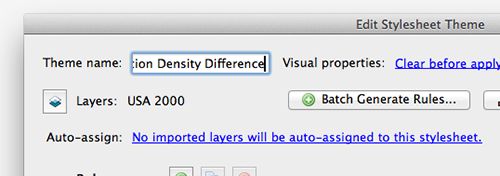
In the “Edit Stylesheet Theme” window, there is a link to click next to the “Auto-assign” right below the layer option. Once you create all the rules for stylization using attribute values, click the link to open the Auto Assign Layers dialog window.
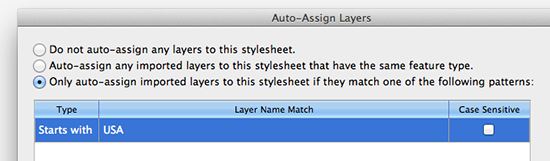
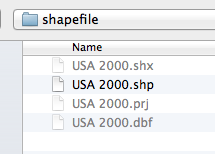
MAPublisher will check the layer name of all the layers being imported if the Auto-Assign Layers settings are made. In this example below, one layer named “USA 2000.shp” will be imported. There may be other layers called “USA 2001.shp”, “USA 2002″…. and so on. There is a pattern in the layer name among the layers to be imported. We will specify here “Start with” for the Type, and “USA” for the Layer Name Match option.
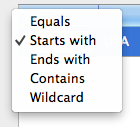
For the Type option, there are five: Equals, Start with, Ends with, Contains, and Wildcard. All my layers start with “USA” in the example above.
Let’s import one layer called “USA 2000.shp” (you can import mutiple layers at once, of course).
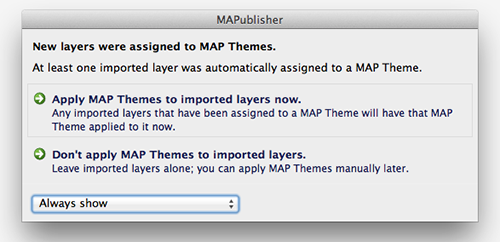
If the Adobe Illustrator document has this Auto-assign setting ready, MAPublisher will detect it and it will give you an option whether or not you would like to apply the styles to the layer(s) being imported. We’ll click the first option “Apply MAP Themes to imported layers now”.
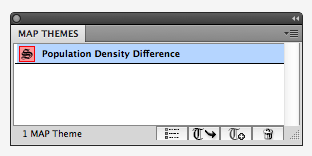
As a result as shown on the very top screencapture image, every polygon in the layer “USA 2000.shp” is stylized with the rules available in the MAP Stylesheet theme upon import.
Summary:
In September 2010, Avenza Systems, Inc. released the first version of PDF Maps for the Apple App Store where both free and for-pay versions of maps in the Geospatial PDF format could be downloaded for use with the iOS operating system. Currently, over 100,000 maps are now available for download. Are users likely to download maps normally found in a print version to their iPhone or iPad? Editor in Chief Joe Francica sat down with Avenza president, Ted Florence for more details on the “the iTunes of maps” business model – selling maps the way iTunes sells music.
Directions Magazine (DM): The transition from publishing printed paper maps to the digital world is a difficult one for many publishers who have been in the map business for many years. Why has the transition been so slow when we’ve had online mapping and the platform, the Internet, for many years?
Ted Florence (TF): Most publishers who have heretofore catered to the printed map audience have neither the means, the know-how nor financial capability to jump into the digital world, and hence a real catalyst was required. That is the essence of where Avenza’s PDF Maps app and digital map store solution come in. While the migration from analog product to digital product has unfolded over the last few years and the better part of the last decade for book and music publishers, map publishers (save for those with means of their own) have only been able to enviously sit back and watch as their printed map businesses have started to struggle. And recognizing that catalysts like Apple, with iTunes and iBooks, and Amazon, with Kindle, have made themselves available to music and book publishers, one could argue that were it not for those catalysts, music and books may not have made the migration either. Furthermore, the cost of transitioning can be very expensive and even prohibitive for many publishers, not to mention that undertaking such major initiatives as creating their own app or mapping device could likely distract most publishers from their main business of producing and delivering maps. So again, despite the fact that the paper or analog to digital transition has proven to be a viable model in the book and music industries and the demand for digital maps has increased with the advent of powerful smartphones and tablets, the map industry has lacked a similar manner of both transitioning and ultimately transacting in maps and has thus been faced with the simple dilemma of how to make that transition, at least until now.
DM: You’ve come up with a new model to support the transition by taking the archive of printed maps and exposing a new delivery method for the publishers. Can you explain the business model in some detail?
TF: The business model for the Avenza PDF Maps app and map store solution is very simple. Think of it basically as iTunes or Kindle but for maps.
The PDF Maps app and solution is an all-encompassing solution for the use, distribution and sale of digital versions of paper maps to mobile devices. Similar to iTunes for music, the Avenza PDF Maps solution includes both an app for users to discover, purchase and use maps directly from and to their devices, as well as a back-end store to facilitate the transaction and delivery of the maps. The app on the smartphone or tablet device contains all the functionality for using maps both on- and offline, including locating oneself, measuring, plotting points, importing and exporting points, and much more, all of which goes well beyond traditional paper map usage. Users can carry around dozens of maps on their device just like they are now accustomed to carrying around a library of music or books. On the other side of the equation, and again like iTunes and Kindle, the app has a built-in map store which connects users to a vast and growing library (currently over 100,000 titles) of maps from around the world and representing multiple genres and publishers. Users may browse and search through this catalog and quickly and easily find, purchase and download the map or maps of their choice, may of which are offered free of charge. Maps are then immediately and automatically delivered wirelessly to the device.
Any geo-referenced map may be uploaded to the system and made available for purchase in a fully electronic manner similar to the way in which music, videos, books and apps are currently sold and delivered.
Additionally, users may add their own maps directly into the Avenza PDF Maps app via a variety of methods. This is particularly useful for private and public-sector organizations that have a need to use their own private maps out in the field while doing work on tablets or smartphones such as iPads and iPhones. So the insertion of maps into the app is not exclusively dependent upon a purchase and download from the in-app map store.
DM: If your new model is essentially “the iTunes of maps” why wouldn’t one of the larger publishers like National Geographic or Rand McNally try to use their brand to do this themselves?
TF: This is certainly an option for all publishers, and some will do that, however, as many publishers are finding, the development and ongoing maintenance of such a dedicated app is very time-consuming and costly. That is why one of the business models in the Avenza PDF Maps solution is a customized or OEM offering of the Avenza PDF Maps app whereby publishers can avail themselves of the functionality and transaction model of the Avenza PDF Maps solution without the time and overhead required to do it all themselves. Moreover, though, as we look at the trail blazed in the music and book industries by iTunes and Kindle, we find that all the various publishers have gravitated to a one-size-fits-all solution in which all music publishers provide their offerings through a single place, iTunes, and all book publishers do so though a single place like Kindle or iBooks. What we do not see are dedicated apps for each publisher. We do not see individual music players and digital stores for Sony, Arista, Def Jam or Geffen nor do we see individual readers and digital stores for Penguin, Random House or Harlequin. Furthermore, on the user side, the fragmentation of the offerings is really not ideal or desirable as users do not want to have dozens of music and book apps on their devices in order to find, maintain and use their content. Simply put, why reinvent the wheel? We have seen how successful the digital music and book transition has become under this model, so why should we try to be any different in transitioning the map industry?
DM: Give us a better understanding of the app delivery method. How do you envision the store to function and what “departments” will you have in the store to make it easy to find content?
TF: Just like with iTunes, iBooks and Kindle, users can access a digital map store directly from within the Avenza PDF Maps app on their device. From within the map store they can browse various map categories or genres such as tourist, transit, recreation, nautical, aeronautical and special purpose, or enter any search term that might apply to a map they are looking for such as a geographic place or term or a particular map use case such as cycling or camping. Additionally, the map store interface allows for finding maps near to one’s current location, browsing recent additions to the map store and browsing the most popular maps at the time. Searches by publisher or brand may also be performed should users have a particular brand or publisher loyalty.
Once they have located a particular map of interest they can simply touch the listing to reveal more information about a map such as publisher, date of publication, file size and full description and even see a full preview of the map in order to feel comfortable that they have found a map they want to purchase. Then, as is done with music in iTunes, they simply touch the “buy” button and complete the transaction.
On iOS devices (iPads, iPhones and iPod Touches) the payment comes seamlessly via the user’s iTunes account and then the map is delivered to the device. Essentially the system functions with the same elegance and simplicity that users are accustomed to when purchasing music and books.
DM: What does the store look like in three years? How do you envision the model developing over time?
TF: Currently there are over 100,000 maps in the map store from over 200 government and commercial publishers and more are being added all the time, every day. We expect this to continue to grow and eventually become the de facto place to purchase maps, much like iTunes has become the place to get music. It would not surprise me at all if we had over one million maps and many millions of users within two to three years. Just ask yourself this: If you need a map of a particular place for a particular use on your device, do you know where to get it? Well, we intend to answer that question for everybody, with the answer being the Avenza PDF Maps store.
There is no other model like this catering to the map industry and as more and more users discover it and more and more publishers realize it to be a viable and costless solution for them to enter the digital map business we see it indeed becoming the iTunes of maps.
We are currently working on an Android version of the solution followed by Windows Mobile and possibly Blackberry, as well as a Web-based interface and store for users who might prefer to do their map shopping on a computer screen rather than on the mobile devices themselves. This is something that music and book purchasers are already able to do, so why not maps as well? As these platforms are unveiled, continued growth is anticipated as new audiences get added. There is no doubt that there is a demand for this type of user and publisher solution so essentially the sky is the limit.
If you haven’t noticed yet, we released an enhanced version of the Grid and Graticules tool (MAPublisher 8.7 and higher). With the new Grid and Graticules tool, you will find that you can export grid settings and save them. Most importantly, these grid settings files can be shared and imported to another document.
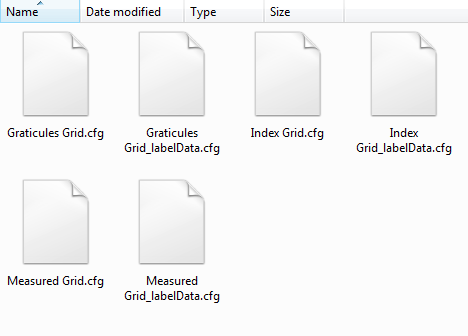
Once a grid is created, save the settings to a *.cfg file. Two configuration files are created per grid: grid settings and label settings.
Grid settings configuration files store information for all related grid options (e.g. ticks, intervals, offsets, borders). Label settings configuration files store information for all related label options (e.g. axis labels, fonts, styles), even for multiple grids. Label settings are saved with _labelData suffixed to the file name.
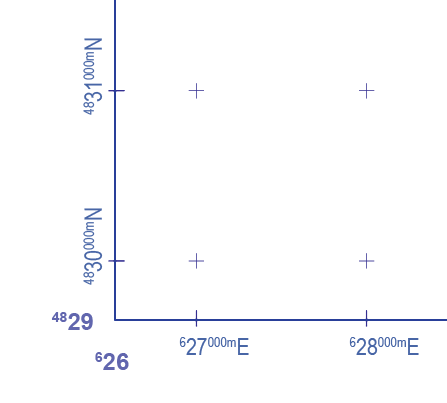
Share the files and load the *.cfg file in the Grid and Graticules dialog box.
Some of the major functions of the new Grid and Graticules tool are adding tick marks along border lines, placing cross hair symbol instead of lines for grid/graticule lines, styling lines and text more flexibly, and having more label options available. You can share the settings by exporting one and importing to another document as well. You can make a set of grid lines looking like this below.