My Account     Contact Us     Cart

Split Layer using Unique Values in Attribute in MAPublisher

MAPView with One MAP Layer

Do you have some data you would like to divide into multiple layers using unique values in an attribute? If so, you might want to try using the Split Layer feature in MAPublisher.

MP931: Split Layer

For example, we have a MAP Layer of the world (world_area layer). The world_area layer has many attributes and one of the attributes is about “Continent” information. With the “Continent” attribute, there are eight unique values: 1) Africa, 2) Antarctica, 3) Asia, 4) Australia, 5) Europe, 6) North America, 7) Oceania, and 8) South America.

To split this world_area layer into eight different layers based on unique values in the “Continent” attribute, we simply specify the Continent layer in the Split Layer dialog box.

Attribute data for the world data

Open the Split Layer dialog box. Choose the world_area source layer, then select the option “Split art to new layer(s) by unique attribute value:”. If you have a specific word you would like to include with the eight layers, enter the value for the “New layer prefix” option. Here, we entered the word “continent” as the prefix.

MP931: Split Layer

Now you have eight new MAP layers created based on the unique values of the “Continent” attribute. The attribute scheme, structure, and attribute values are inherited from the source layer to the split layers.

MAPView panel with the Split Layers

Creating Grids in MAPublisher with an Alternative Coordinate System

In a previous blog about Grids and Graticules, we quickly introduced one of the major features of the new Grid and Graticule tool. We’d like to share another major feature when creating grids: creating grids with an alternative coordinate system.

For example, the MAP View has a coordinate system “NAD 83 / UTM zone 17N” (in metres). You might want to make grid lines with the same coordinate system but in different units. You can do so by creating a custom coordinate system and then specifying the desired unit (US Foot, for this example), then creating a grid based on custom coordinate system. In this example, a grid with NAD83/UTM zone 17N (metres) coordinate system is created in the blue colour. Another grid with a NAD83/UTM zone 17N (USFoot) custom coordinate system is created with the orange colour.

Specifying alternative coordinate system for grids

Example of grid lines with UTM in metres and US foot

Likewise, you can create multiple sets of measured grids with different coordinate systems in one MAP View (e.g. one set with NAD83 UTM, another with NAD27 UTM, another with some other local coordinate system) without the need to transform the MAP View.

MAP Attribute Panel: Attribute Tear-Off Panel (CS6 or higher versions only)

MAPublisher Attribute Panel

A little known (but very useful) feature is the Attribute Tear-Off Panel which is located in the upper-right corner of the MAP Attribute panel (available in MAPublisher that’s compatible with Adobe Illustrator CS6 or higher). Use it to help you edit and view attributes even when they are deselected. It is very handy when used to compare attributes of different datasets.

Simply click the MAPublisher Attribute Panel: Tear-off icon Attribute Tear-Off Panel icon to open another MAP Attribute panel. There are a few key difference between MAP Attribute panel and Tear-off panel:

1) The tear-off panel does not have any MAP Attribute functions (e.g. Join Tables, Find and Replace, Edit Schema, etc).

MAPublisher Attribute Panel and Tear-off Panel:


2) The tear-off panel view remains active and shows attributes even after features are deselected.

MAPublisher Attribute Panel and Tear-off panel when objects are deselected.

If your data values are updated within MAP Attribute panel, click the Attribute Tear-Off Panel again MAPublisher Attribute Panel: Tear-off icon to update the values in the tear-off panel.

Labeling Trick for MAPublisher

This blog post was written by Avenza reseller in The Netherlands, Hans van der Maarel of Red Geographics.

When you’re labeling point features (let’s say cities) in MAPublisher, using either Label Pro or Label Features, and you’re not placing a label for every single point, you’re left with the task of removing the points you haven’t labeled. This trick will have the text inherit the attribute structure of the points including a lat/long and guarantee that there are no orphan points.

Take for example the above map. I want to label the cities, but not all of them. I’ll decide as I go along which city will get labeled, and which will get dropped. In order to more easily remove the unlabeled cities I need to do some preparation. I’ll create two columns in the cities layer, X and Y, and assign the expression #MapX and #MapY to them, respectively. It’s important that you do this through the Apply Expression option in the Map Attribute panel.

This gives two attributes with the original coordinates of the city points.

Next, I’ll create a layer for the labels and put it into the MAP View as a text layer, indicating that I want to copy the attribute structure of the cities layer.

Now that all the preparatory work is done, I’ll start the labeling. I’m going to be using the Label Features option, but this will work with MAP LabelPro as well.

If I select one of the texts and look at its attributes, I’ll see that the attributes from the city point have been transferred to the text, including the X and Y attributes which hold the position of the original city point.

Next, I’ll remove the city points layer, select all city labels and use the Export Attributes option in the MAP Attributes panel:

This will export a comma-delimited text file (CSV). Make sure to check the “Field names on first line” option. It’s not exactly necessary, but it will make things a lot easier.

Import the CSV file back into MAPublisher. Make sure to specify that the projection of the data is the same as the existing MAP View. Once the data is imported, you can apply any existing Stylesheets that you had in place to style the cities, or create a new one. This way, you end up with just the symbols for the cities you’ve actually labeled.

Create HTML5 Maps with MAP Web Author in Adobe Illustrator and How to Embed Them on your Website


What is HTML5?

HTML5 is the current major revision of HTML (Hypertext Markup Language), the core markup language of the Internet. One of its major development goals was to reduce the need for proprietary, plug-ins such as Adobe Flash and to provide new graphics drawing abilities to the canvas element of HTML5. Scripting (e.g. JavaScript) is used to draw graphics, animations, and display other types of content. The potential of applications in online mapping with HTML5 technology varies widely including uses in fields such as cartography, GIS, demographics, and statistics.

Introduction to HTML5 Map Web Author

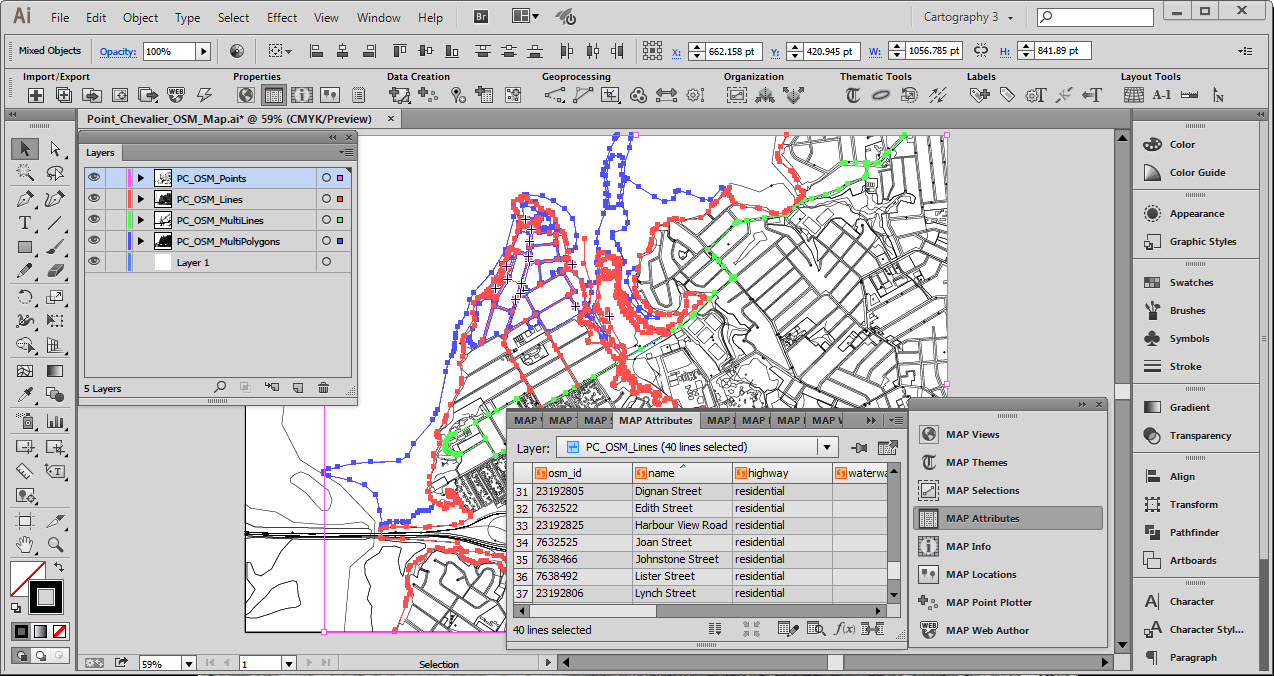
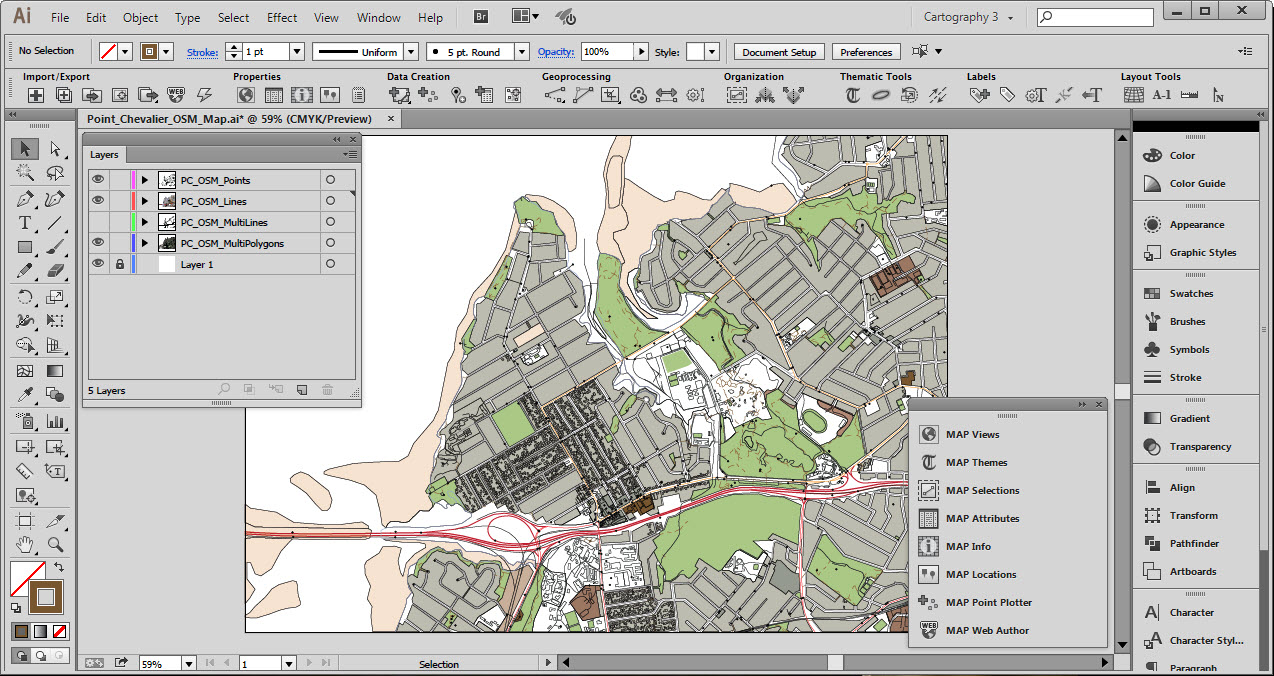
As maps become more detailed and data sources becoming richer, the way we present multiple data layers and map projections in dynamic map zoom levels and extents, traditional web mapping techniques start to become too limited. While many current web maps are rendered and served through a server, this could limit the amount of data provided and be slow to transfer as more and more tiles are served. MAP Web Author uses a technique to make maps from Adobe Illustrator compatible with browsers that support HTML5, specifically the canvas element. The maps exported using MAP Web Author are not server-side rendered, instead, they are rendered on-the-fly and content dynamically changes when the map is panned or the map zoom level is changed. This ultimately produces a more flexible, interactive and dynamic map. An HTML5 map also has more efficient storage and requires less space than other web map technologies. Stored vector map data (points, lines, and areas) is more efficient than raster tiles and can be displayed at any scale and even styled using CSS. Since HTML5 technology replaces browser plug-ins like Flash or Java, web maps generated by MAPublisher are accessible on Android, iOS, and Windows mobile devices (smartphones and tablets).

Files created from export

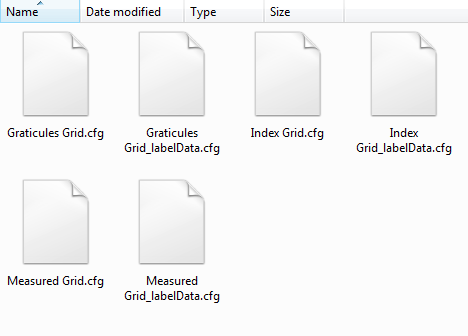
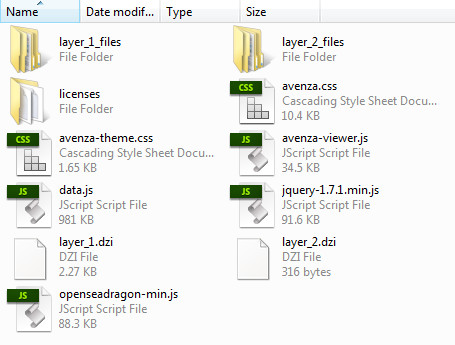
After exporting your map using MAP Web Author to HTML5 format, several files will be created. A ready to use index.html file and an index_data folder. The index.html file contains pre-formatted code necessary to view your map. In most instances, you can simply open the file in a browser to view the web map.

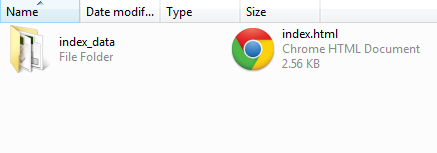
The index_data folder contains all of the necessary map layer data, JavaScript files, and CSS files to display your map.


How to embed an HTML5 web map into your site

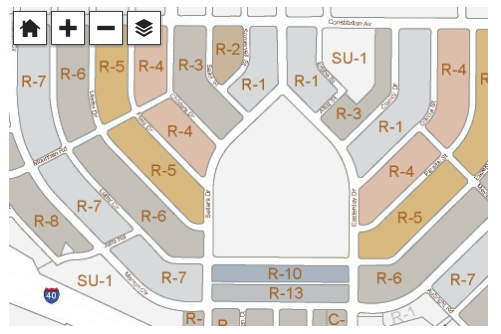
The viewer will be embedded inside of a div element in your page (the “container div”). The map view will fill the container div.

For mobile specific sites we recommend setting the width and height of the container div to 100%, then using max-width and max-height to limit the width to the size of the map. The style should fit in the head, like this:

<style>
	#map_container {
		max-width: 479px; 
		width: 100%;
		max-height: 320px;
		height: 100%;
	}
</style>

For standard websites we recommend explicitly setting a width and height of the container div. The style should fit in the head, like this:

<style>
	#map_container {
		width: 479px; 
		height: 320px;
	}		
</style>

The following script tags must be included in the head tag as well. These scripts contain JavaScript functions that allow the map to function, like so:

<script src="index_data/jquery-1.7.1.min.js"></script>
<script src="index_data/openseadragon-min.js"></script>
<script src="index_data/avenza-viewer.js">lt;/script>

Keep note that the prefixUrl points to the directory where your map data is stored. It should be a relative path to avoid cross-site access errors. The id is used below in the body of your page.

<script>
	var avenzaViewer;
	$(function () {
		
		AVENZA.initialize();
		avenzaViewer = AVENZA.embedViewer({
			id: 'map_container',
			prefixUrl: 'index_data/'
		});
	});
</script>

Within the body tag, place the div element where appropriate. Specifying the div element id initiates the JavaScript to display the HTML5 web map. If a browser that is not compatible is used, then the message is displayed.

<div id="map_container">
	<div style="display:none">
		<!-- 
		The message below will appear instead of the map if 
		a user connects with a browser that does not support 
		enough HTML5 for the map viewer to function. You may 
		wish to customize the message for your site.
		-->
		A web browser that supports HTML5 is required in order 
		to view this content. If you are seeing this message 
		then your current web browser does not. 
 
		Please upgrade.
</div>


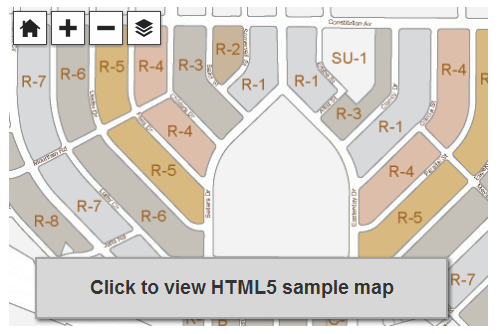
More information and sample HTML5 maps can be found in the MAP Web Author section.

MAPublisher MAP Themes: Assign Symbology and Styles upon GIS Data Import

With MAPublisher 8.6 or higher, you can apply styles to GIS data upon import using the MAP Stylesheet Auto Assign feature.

MAP Theme Auto Assign  upon import

You will need to prepare MAP Stylesheet theme(s) and set the Auto Assign settings within every stylesheet. In this example, there is only one stylesheet.

MAP Theme Panel

In the “Edit Stylesheet Theme” window, there is a link to click next to the “Auto-assign” right below the layer option. Once you create all the rules for stylization using attribute values, click the link to open the Auto Assign Layers dialog window.

MAPublisher MAP Theme Auto Assign: link

MAPublisher will check the layer name of all the layers being imported if the Auto-Assign Layers settings are made. In this example below, one layer named “USA 2000.shp” will be imported. There may be other layers called “USA 2001.shp”, “USA 2002″…. and so on. There is a pattern in the layer name among the layers to be imported. We will specify here “Start with” for the Type, and “USA” for the Layer Name Match option.

MAPublisher MAP Theme Auto Assign

For the Type option, there are five: Equals, Start with, Ends with, Contains, and Wildcard. All my layers start with “USA” in the example above.

MAP Theme Auto Assign: Layer name pattern option

Let’s import one layer called “USA 2000.shp” (you can import mutiple layers at once, of course).

Importing a shapefile for an example

If the Adobe Illustrator document has this Auto-assign setting ready, MAPublisher will detect it and it will give you an option whether or not you would like to apply the styles to the layer(s) being imported. We’ll click the first option “Apply MAP Themes to imported layers now”.

MAP Theme Auto Assign window upon import

As a result as shown on the very top screencapture image, every polygon in the layer “USA 2000.shp” is stylized with the rules available in the MAP Stylesheet theme upon import.

MAPublisher: Enhanced Grids and Graticules Allows You to Share Grid Settings

If you haven’t noticed yet, we released an enhanced version of the Grid and Graticules tool (MAPublisher 8.7 and higher). With the new Grid and Graticules tool, you will find that you can export grid settings and save them. Most importantly, these grid settings files can be shared and imported to another document.

Once a grid is created, save the settings to a *.cfg file. Two configuration files are created per grid: grid settings and label settings.

settings files for grid and graticules

Grid settings configuration files store information for all related grid options (e.g. ticks, intervals, offsets, borders). Label settings configuration files store information for all related label options (e.g. axis labels, fonts, styles), even for multiple grids. Label settings are saved with _labelData suffixed to the file name.

Share the files and load the *.cfg file in the Grid and Graticules dialog box.

exchanging the settings for grid and graticules

Some of the major functions of the new Grid and Graticules tool are adding tick marks along border lines, placing cross hair symbol instead of lines for grid/graticule lines, styling lines and text more flexibly, and having more label options available. You can share the settings by exporting one and importing to another document as well. You can make a set of grid lines looking like this below.


A basic example of grid lines

Geospatial PDF in Adobe Acrobat: Examining latitude and longitude values

After creating a map with MAPublisher or Geographic Imager, you might want to export it as a geospatial PDF file. You want to ensure that the georeference information of your Geospatial PDF files are correct before bringing them into the field for use. A great way to use geospatial PDF maps (and GeoTIFFs) is to load them onto an iPhone, iPad, or iPod touch with PDF Maps installed.

One way to check for georeference accuracy of geospatial PDF files is to use Adobe Acrobat. Open the “Analysis” tool from View > Tools > Analyze.

Adobe Acrobat: Opening Anlysis Tool

Click the “Geospatial Location Tool” from the Analyze panel.

With the Geospatial Location Tool enabled, you can see the latitude and longitude values of the map while you move the mouse over the opened Geospatial PDF file.

Geospatial PDF viewed in Adobe Acrobat

An important tip you should keep in mind: you need to set the preference option for this tool correctly depending on the coordinate system of the map in the geospatial PDF file.

Open the Preference dialog window:

Acrobat X on Windows: Edit > Preferences > General …
Acrobat X on Mac: Acrobat > Preferences …

In the Preference dialog window, find the preference category “Measuring (Geo)” from the list of categories.

Adobe Acrobat Preference dialog window

In the “Measuring (Geo)” category, take a look at the right side. There are many options for the georeferencing tool. One of the options is “Latitude and Longitude Format”. In this section, you have a checkbox option “Always display latitude and longitude as WGS 1984”.

Adobe Acrobat Preference option for Latitude Longitude Display

This option is very important. If the coordinate system of the map is “NAD 27 / UTM Zone 16 N”, which geodetic system would you like to have to show the latitude and longitude values in Adobe Acrobat? For example, if you are checking the latitude and longitude values in the WGS 1984 geodetic system, you should keep this option selected. However, if you are checking the latitude and longitude values in NAD 1927 geodetic system, then you should de-select this option. The difference in the distance at the same spot between two different geodetic systems may be small or large. If you would like to see the correct latitude and longitude values, you should be aware of this option.

3D Terrain Model using Geographic Imager

PLEASE NOTE: As of Photoshop 22.5, Adobe has discontinued support for the program’s 3D features. This may affect some or all elements of this blog. For more information, see Adobe’s FAQ page about this change and the Geographic Imager compatibility information page.

We created a video to show that it is possible to use geospatial data and the 3D capabilities of Adobe Photoshop. It performs very well with a decent computer and video card.

In this video, a combination of Geographic Imager and Adobe Photoshop functions are used to open a DEM file using a script. The script also transforms a DEM into a 3D model and allows for an overlay of a colour model based on the data or a custom image (e.g. ortho image). Video after the jump.

How to get Open Street Map data into Adobe Illustrator with MAPublisher

Edit: Updated with a new QGIS workflow (November 21, 2014)

The following tip is courtesy of Hans van der Maarel of Red Geographics.

————-

For many areas on Earth, OpenStreetMap is a viable alternative to commercially offered data sources. However, it is not always easy to process. This blog tutorial explains the steps needed to load OpenStreetMap data into MAPublisher.

1. Download and install QGIS, this is a free GIS application, available for Windows, Mac and Linux computers. QGIS now comes with built in tools for downloading Open Street Map Data.

2. Open QGIS and zoom in to an area of interest. Use the OpenLayers plugin for a basemap if you do not have any imagery or mapping of your own. Keep in mind that downloads from the OpenStreetMap website are limited in the number of exported objects, so for larger areas you will have to combine multiple downloads yourself, or look for other options (for example Geofabrik).

Bing Basemap

3a. Go to the Vector Menu and Choose OpenStreetMap and then Download data.

OSM Download Menu

3b. Choose how you want the extent of the downloaded data to be defined. The easiest way is to use the Map Canvas.

OSM Download Dialogue

4. Open your downloaded .osm file in QGis using the Add Vector Layer tool. Select all the Layers and choose OK.

Select vector layers to add

This results are shown in several layers depending upon what is present in the extent you have downloaded. In this case there are points, lines, multilinestrings and multipolygons. Note that QGIS only imports features that fall completely within the extent specified. So make sure you choose an area larger than your actual area of interest to ensure it is completely covered.

OSM layers loaded in QGIS

5. Export these layers one by one. Right-click and choose “Save As, then ESRI shapefile”.

Save Points to Shapefile

6. The shapefiles can be imported into Adobe Illustrator using MAPublisher. After reprojecting, scaling and cropping we’ve ended up with the raw OpenStreetMap vectors in Adobe Illustrator, with all attributes still maintained.

OSM Layers loaded in MAPublisher

7. Once within the data is imported successfully, you may now use any of the MAPublisher and Adobe Illustrator tools to style and customize the map in any way you want.

OSM Layers loaded and themed in MAPublisher