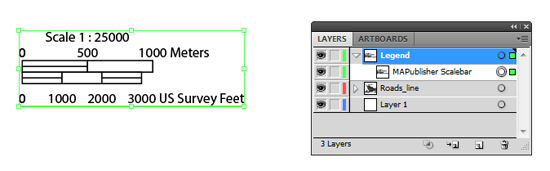
After generating a scale bar, it is placed in a MAP Legend layer. You can accept the default look of it, but majority of users will want to customize and style it to match their map.
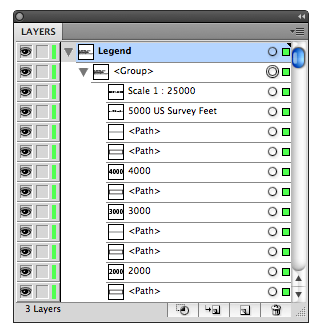
Now I’ve just generated a simple scale bar. If you expand the Legend layer, you can see the object “MAPublisher Scalebar” is placed within it. This is a special object generated by MAPublisher and there is currently a dynamic link between the MAP View information (i.e. spatial information) and the scale bar object.
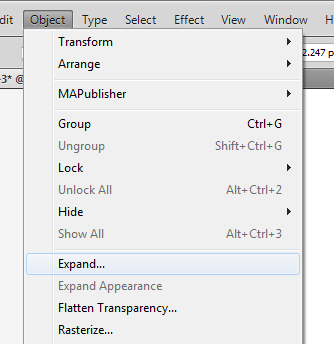
In order to make a custom scale bar, you will have to break the dynamic link between MAPublisher and the scale bar object. In your own workflow, it’s important that you setup the scale before breaking the link because it will not rescale dynamically after the link is broken. Break the link by expanding the generated object.
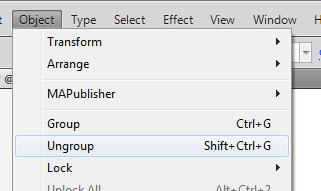
From the main menu, choose Object > Expand.
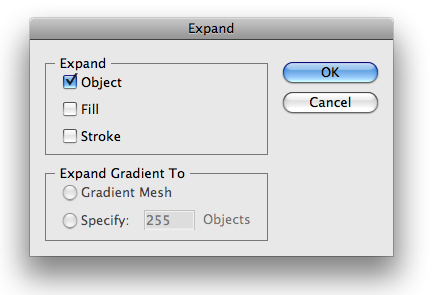
In the Expand dialog box, click the “Object” check box, then click OK.
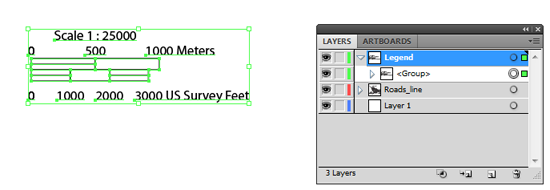
The result: the object <MAPublisher Scalebar> is replaced by an object called <Group> in the Layers panel. The connection between the scale bar object and MAPublisher is removed. The art in the scale bar object simply became grouped objects.
At this point, select objects in the group and change its colors and lines by using the direct selection tool . The direct selection tool allows you to select individual object even if select objects is a part of a <Group> object.
If you are more comfortable with the selection tool , you will want to read the suggestion below. It works, too.
Take a look at the Layers panel again more closely. The screen capture of the Legend layer above shows that there is a <Group> object under the “Legend” layer. When the object tree under the “Legend” layer is expanded, you can see another <Group> object nested within a <Group> object. (a <Group> object containing a <Group> object). Since all the objects are still grouped, you can simply “ungroup” the art.
Select the <Group> object (i.e. the scale bar object for this example), then from the main menu, choose Object > Ungroup.
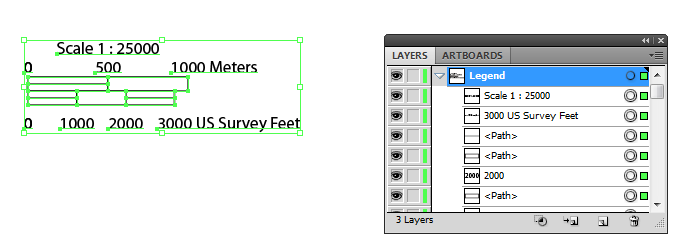
When you ungroup the object once, you now see only one <Group>. This <Group> object contains all the text, lines, and area objects composing a scale bar object.
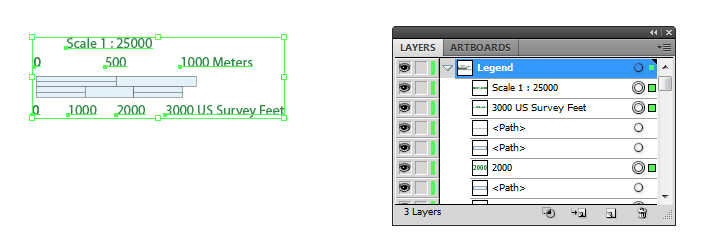
Now, ungroup the object once more. Finally you do not see the object <Group> anymore under the “Legend” layer. It indicates that every object in the layer can now be selected individually using the direct selection tool.
Select the objects to edit and style them using Adobe Illustrator tools!
With Geographic Imager 3.x, you can import DEM files to Adobe Photoshop and can create shaded relief images.
There are two methods to achieve this:
Method 1: Run the pre-made JavaScript and apply it to all images
After opening your DEM image, choose File > Scripts > Browse… and select Shaded Relief.jsx from the SampleScripts folder inside the Geographic Imager Tutorial folder. It will generate the shaded relief image for the opened DEM image based on the settings in the JavaScript file.
Method 2: Create shaded relief images manually
We’ll use the DEM file Rocky Mountains.dem available in the Geographic Imager Tutorial folder for this demonstration.
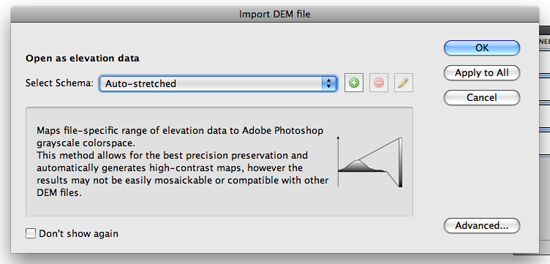
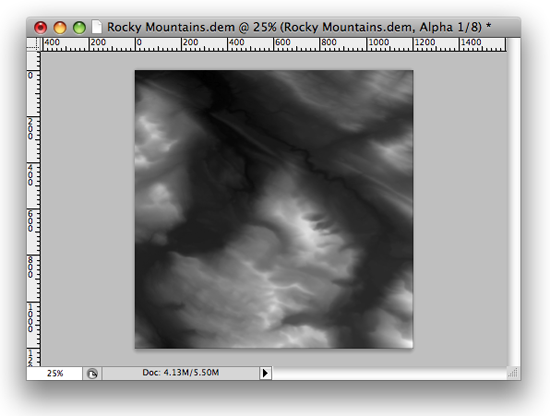
1) Open the Rocky Mountains.dem image from the Geographic Imager tutorial folder. Geographic Imager automatically detects it as a DEM file and provides the option to select the DEM image import method. For this demonstration, choose Auto-Stretched from the Select Schema drop-down list.
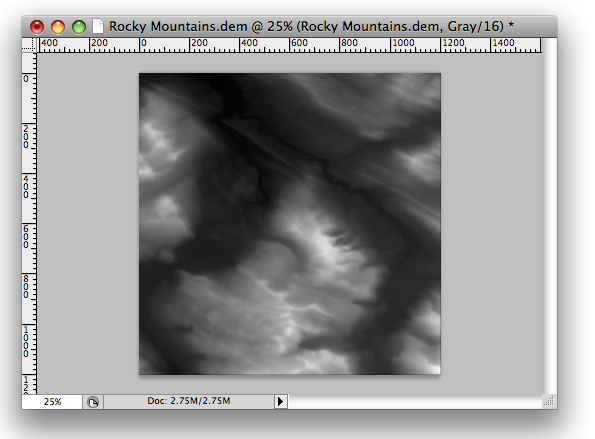
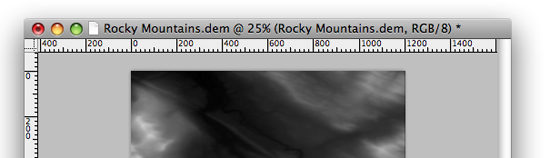
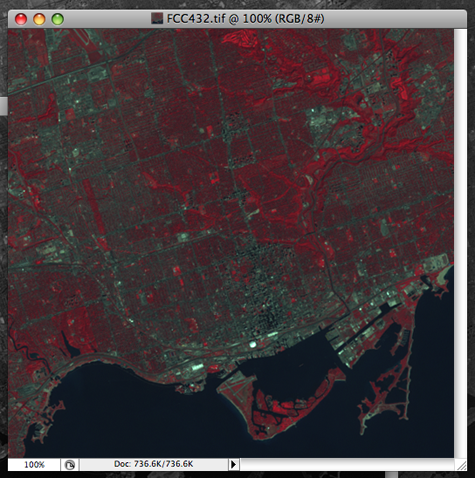
The imported DEM is opened in black and white. Take a look at the header of the image (or tab of the image file). Notice that it displays “Gray/16”. This indicates that the image is in the 16 Bits/Channel Grayscale mode.
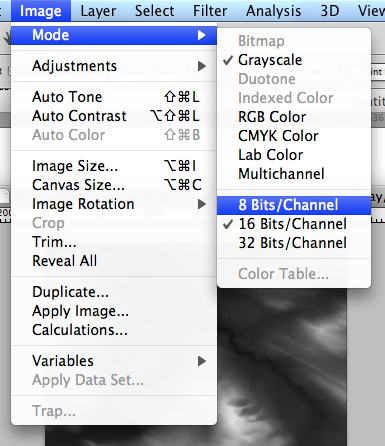
2) Now, change the image mode from 16 Bits/Channel Grayscale to 8 Bits/Channel RGB. From the top menu bar, choose Image > Mode and then 8 Bits/Channel. Once again, go to Image > Mode, this time choose RGB Color.
Once completed, take a look at the image header again (or file tab). Now “RGB/8” is indicated in the header, meaning that the image is now in the 8 Bits/Channel RGB color mode.
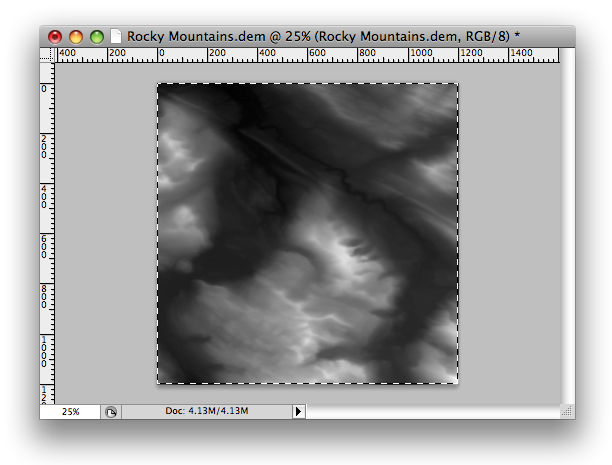
3) Select the entire canvas (use the Rectangular Marquee Tool) and copy the selected area to the clipboard (Edit > Copy).
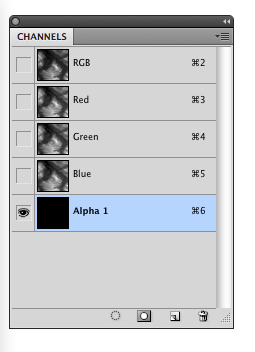
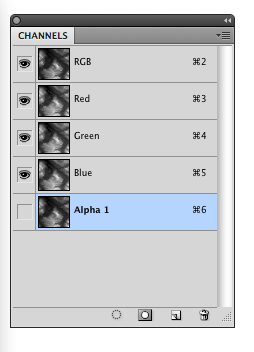
4) Open the Channels panel (Window > Channels) and add one Alpha channel by clicking the Create new channel button at the bottom of the panel or go to the panel option menu and choose New Channel. Leave the channel name as “Alpha 1”.
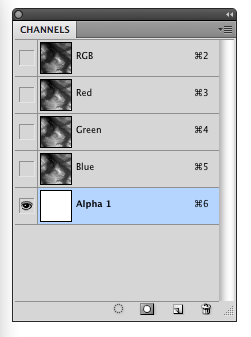
5) Select the “Alpha 1” in the Channels panel and fill it in white using the Paint Bucket Tool.
6) In step 3 we copied the selected area (the entire canvas) to the clipboard, now we’re going to paste it to the new channel. Select “Alpha 1” in the Channels panel, and paste it (Edit > Paste). You can see that the same image is displayed for all the channels when the copied area is successfully pasted. Make the Alpha 1 channel invisible and make sure the RGB channels are visible.
7) Deselect the area (Select > Deselect from the top menu bar).
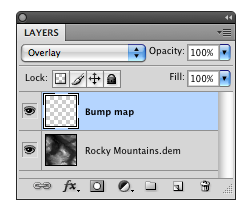
8) In the Layers panel (Window > Layers), create a new layer named Bump map. Change the Blending mode to Overlay.
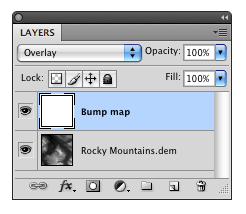
9) Using the Paint Bucket Tool again, fill the new “Bump map” layer with white.
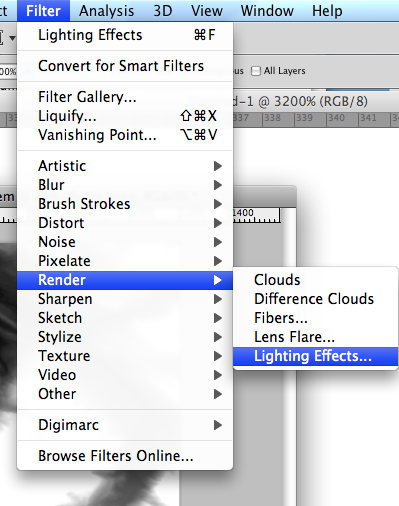
10) From the menu bar, choose Filter > Render > Lighting Effects…
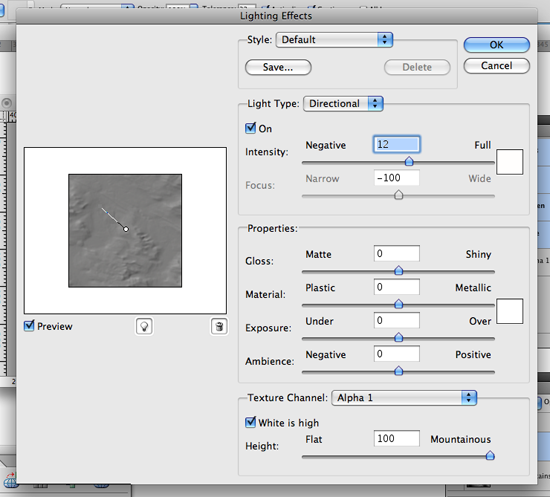
11) Adjust the settings in the Lighting Effects dialog window.
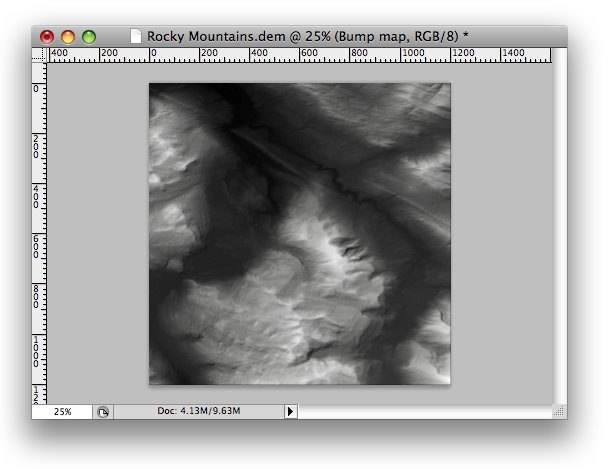
12) The shaded relief image is completed! You can use this image to overlay with other georeferenced images with Geographic Imager or with vector datasets with MAPublisher.
Up to MAPublisher 8.2, the MAPublisher Buffer Lines function was limited to only Line features. For MAPubisher 8.3, a revised buffer function called Buffer Art can be performed on both Line and Point layers. Buffer Art allows you to enter one fixed value to either all or the selected art in one layer or the values from an attribute column in one map layer.
Example 1: Applying a static value for the buffer width
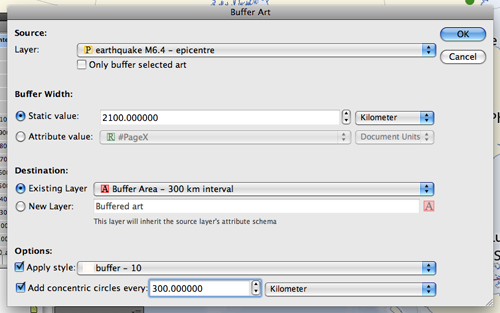
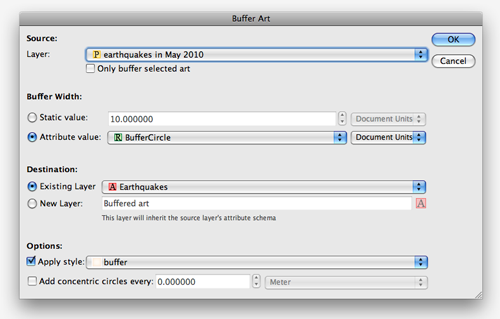
Below is the new Buffer Art dialog box. I have one MAP Point layer with a location of a strong earthquake recorded in India n May 31, 2010.
I specified a value of 2100 Kilometer as the distance to buffer from the epicentre (the origin of the earthquake). The buffered art will be placed in the existing destination layer Buffer Area – 300 km interval.
For the buffered area, a pre-designed graphic style will be applied.
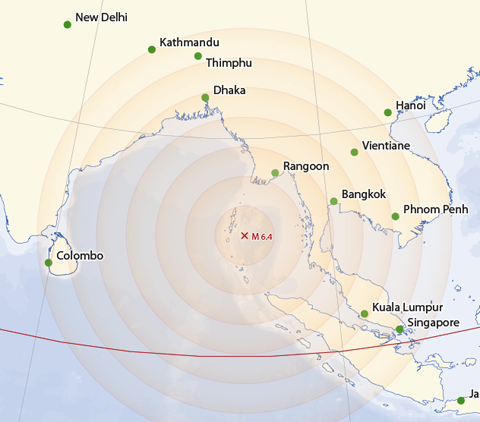
Lastly, I enabled the Add concentric circles every: option. This option will generate evenly spaced rings around the points within the buffered area. I am selecting 300 Kilometer for each concentric circle distance. It will generate seven concentric circles within the 2100 km buffer. As a result, you can see that a concentric ring is drawn every 300 km from the epicentre.
Example 2: Applying values from an Attribute Column for the buffer width (Creating Graduated Symbols for every point)
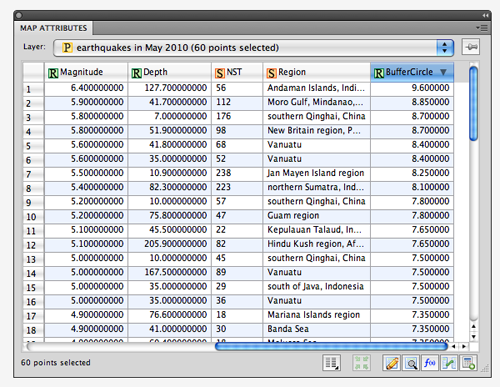
I will use another point layer this time. I have one MAP Point layer with the point information of earthquake epicenters. The size of the buffer width in the page unit (pixel) was calculated based on the size of the magnitude for every point in the layer. Those values under the BufferCircle column will be used for the buffer width.
Now, the Buffer Art feature will be performed with those calculated values for the buffer width.
The Attribute Value option is chosen and the BufferCircle field for the Buffer Width.
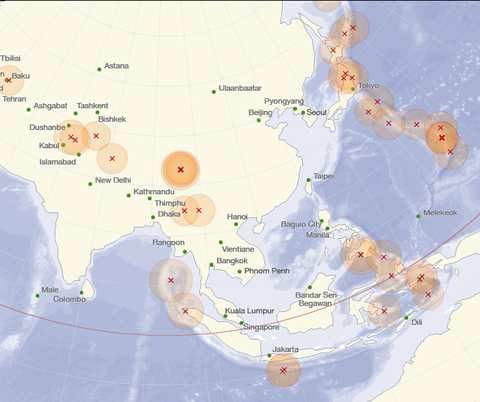
As a result, every buffered area (circle) has a different size. Also, the graphic style selected for the buffer art had some level of transparency applied. You can see the darker color when the buffered art overlaps each other. In other words, the region where the dark orange is observed experienced earthquakes more than once.
Buffer Art can be applied to many situations such as around parcel lots, around road or highway lines or even creating them to find intersection proximity between map features. Experiment with your own to find out what is most useful for your own data.
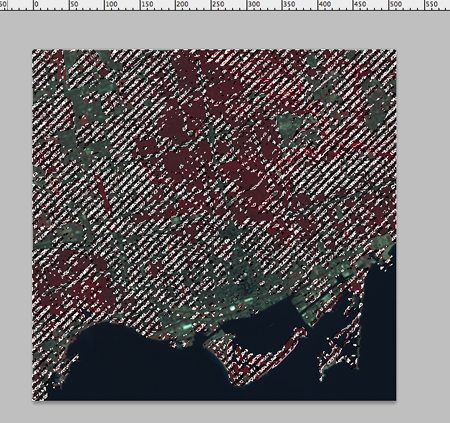
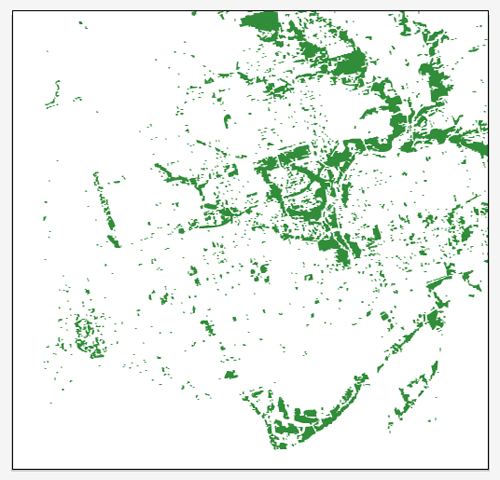
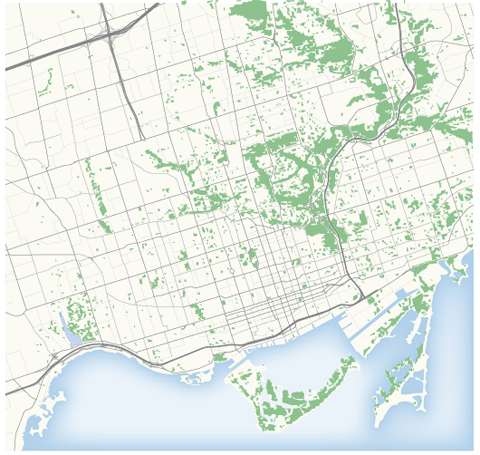
In our previous blog, we introduced you to a quick technique for remote sensing imagery: to depict a type of land types (green area) from a Landsat image. Below is the false composite image created in the previous blog. Basically, the red area indicates a lot of green vegetation (i.e. trees, shrubs, etc).
Now, you may be wondering how those red areas can be extracted from Adobe Photoshop and Geographic Imager and brought into Adobe Illustrator and MAPublisher?
An overview of the steps involved in this technique:
In Adobe Photoshop & Geographic Imager:
Select the red areas with Adobe Photoshop tools.
Save the selected pixel areas as “work path”.
Export the saved work path as an Adobe Illustrator file.
Export the georeference information from Geographic Imager option menu.
In Adobe Illustrator & MAPublisher:
Import the exported Adobe Illustrator file with the work path.
Assign the georeference information to the imported work path objects.
If you have already made a map with vector dataset, open the AI file.
Import MAP Objects from the AI file with the workpath to another AI file with a map.
Drag and Drop transformation to align the workpath objects geospatially.
Below are the detailed step-by-step intructions.
In Adobe Photoshop and Geographic Imager:
1. Select the red areas
Open the false color composite image in Adobe Photoshop. Now, all the red areas must be selected using any of the following Adobe Photoshop tools.
For example, you can select the red areas using the Magic Wand Tool. You may want to adjust the tolerance values as you begin to select the areas so that only the approriate areas are selected. If you disable the “Contiguous” option from the settings tool bar, it selects all the areas with the same color as the one you collected.
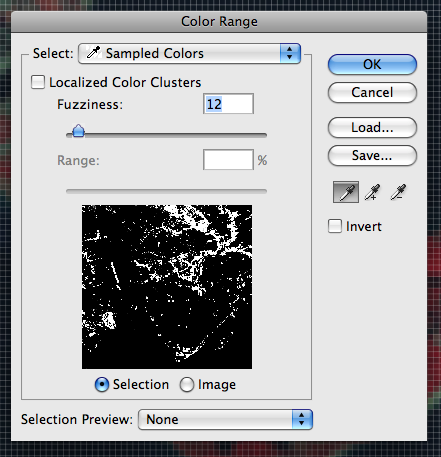
If you want to more precisely select red areas with a preview window, use the Color Range Tool (Select > Color Range). With this tool, sample the color of interest first. In this example, you might want to pick only the areas with the bright red color or you might want to be within a specifc range of red. Using this, you will have more control on which areas are selected.
Of course, there are other techniques you can use to collect the pixels with a specific color. The two suggested above are used quite commonly in our workflows.
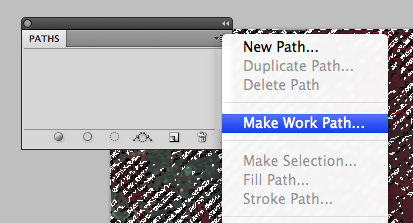
2. Save the selected pixel areas as “work path”
After all the red areas are selected, save the selected area as “work path”. This option is available in the Paths panel options menu.
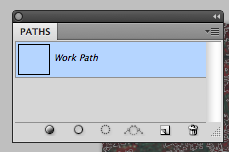
The selection is now saved as a “work path” in the Paths panel.
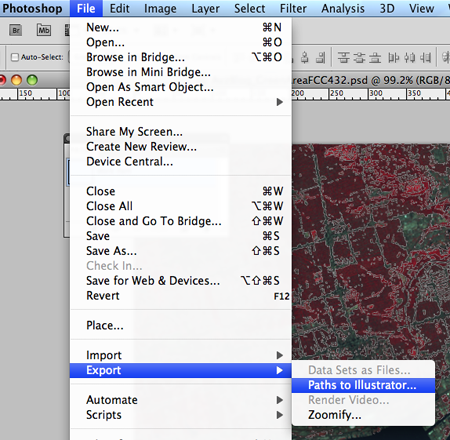
3. Export the saved work path as an Illustrator file
Once the work path is saved in the Paths panel, export it as an Illustrator file (File > Export > Paths to Illustrator).
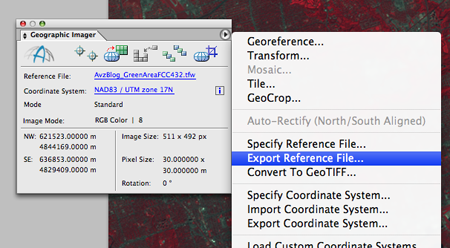
4. Export the georeference information from Geographic Imager option menu
As you saw in the Geographic Imager panel for the false color composite file in the previous blog, this image was georeferenced. Furthermore, we need to export the georeference information that will coincide with the Adobe Illustrator file we just exported.. You can export this georeference information as a MapInfo TAB file or Blue Marble Reference RSF file from the Geographic Imager panel options menu.
In Adobe Illustrator & MAPublisher
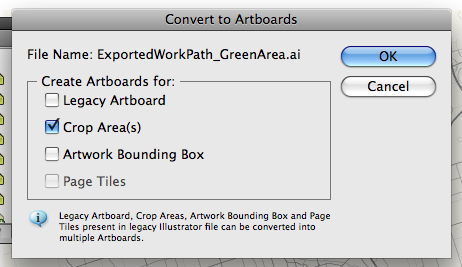
5. Import the exported Illustrator file with the work path
In Adobe Illustrator, open the Adobe Illustrator file exported from Adobe Photoshop (Step 3). Upon opening, a prompt appears to convert the exported file to Artboards. Select the second option “Crop Area(s)”.
When the artboard is opened, it seems like there is nothing on the artboard. It is simply because there is no color assigned to the fill and stroke. I put a green color for the work path objects.
6. Assign the georeference information to the imported work path objects
The imported work path objects do not have the georeference information yet. We exported the reference file in Step 4 using Geographic Imager. We are going to use the exported reference file to assign the georerefernce information to those work path objects.
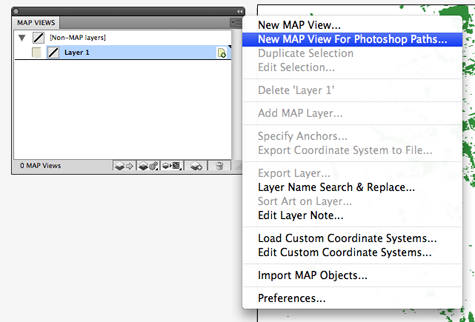
In the MAP Views panel options menu, click “New MAP View For Photoshop Paths…”
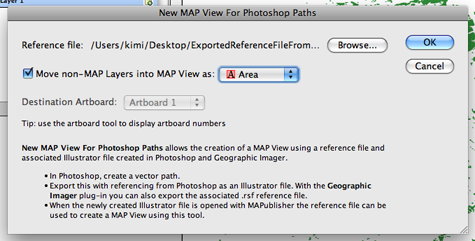
Browse for the exported reference file (either *.tab or *.rsf format from Step 4). Then select “Area” as the feature type for the MAP layer to be created.
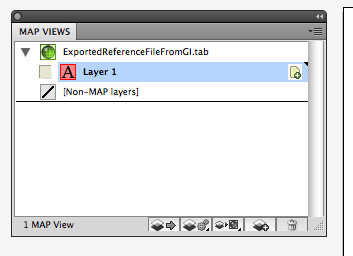
The georeference information from the original image is now inherited by the work path objects in the Adobe Illustrator file.
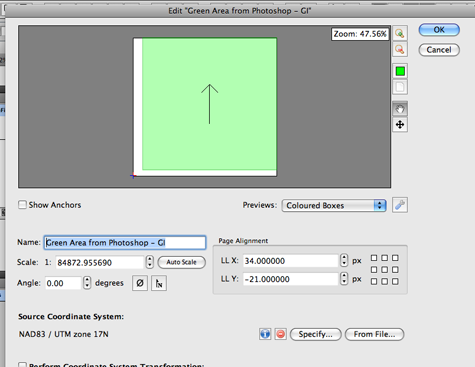
In the MAP View Editor window, you can see all the spatial information such as the coordinate system, scale, and map extent within the artboard. The name for the MAP View is renamed to “Green Area from Photoshop – GI” for Step 8.
At this point, if you have GIS dataset, you can import them to this document. However, I will show you one more MAPublisher trick to bring this green area into an existing MAPublisher file.
7. If you have already made a map with vector dataset, open the Adobe Illustrator file
Keep the Adobe Illustrator file with the work path objects open, then open another Adobe Illustrator file with MAPublisher MAP Objects. Now you have two Adobe Illustrator documents open.
8. Import MAP Objects from the AI file with the workpath to another AI file with a map
Make the Adobe Illustrator document with the map (not with the work path objects) the current document.
On the MAPublisher Toolbar, click the “Import MAP Object” button.
In the “Import MAP Objects” dialog box, select the MAP View “Green Area from Photoshop” and click OK.
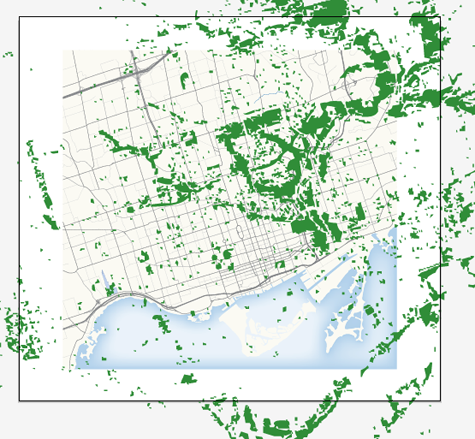
All the path objects are imported to the other Adobe Illustrator file with the base map.
However, the imported objects and the base map do not line up appropriately. It is because the scale of the MAP View with the work path and the MAP View with the base map do not match. You can line up those green areas with a simple step.
9. Drag and drop transformation to align the workpath objects geospatially.
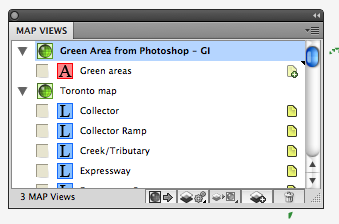
In the MAP Views panel, there are two MAP Views: “Green Area from Photoshop – GI” for the work path imported from another AI file and “Toronto map” for the base map.
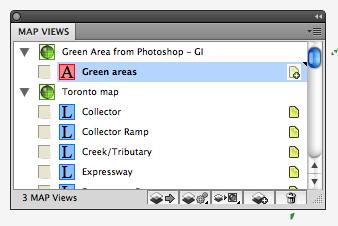
Click the MAP Layer “Green areas” in the MAPView “Green Area from Photoshop – GI” …
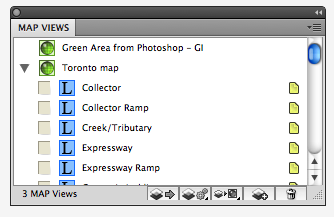
… then drag the map layer to the MAPView “Toronto map”.
Now all the green areas (work path objects) are lined up nicely with the base map.
Try this out with your own workflow to see how it may improve your maps.
Whether you’re new to MAPublisher®, an experienced user, or simply thinking about a purchase, Avenza software training is a worthwhile experience. Get hands-on training from Avenza product specialists at one of our training courses around North America.
Who should attend?
GIS professionals who want to produce better quality maps
Map makers and cartographers incorporating GIS data to improve accuracy in their maps
New MAPublisher users who just purchased a license
Users who want to experience the latest features of MAPublisher
Cost
Cost of the two-day training course is $1,000 USD per person. Discounts are available to groups of three or more from the same organization and for returning students desiring a refresher or update. Major credit cards are accepted.
Training details
Hands-on training takes place at a training center classroom where Windows computers and all required software and training data are provided.
Attendees will learn the fundamentals of MAPublisher and learn how to use all major features. Attendees will also receive basic instruction on the use of Adobe Illustrator as it relates to MAPublisher and cartographic production. A basic knowledge of Adobe Illustrator is recommended, but not required.
Attendees are encouraged to bring his or her own datasets. There will be some time during the end of the course to discuss these with an instructor.
Attendees that are Mac users may opt to bring his or her own Mac and software. Make sure to inform Avenza a week before training to setup the system properly for training.
Classes may be cancelled up to seven business days prior to the confirmed training date (depending on the number of reservations received).
Toronto, ON, April 6, 2005 – Avenza Systems Inc., producers of MAPublisher cartographic software, and MAPdata USA, MAPdata World and MajorCities USA royalty-free GIS/cartographic data files, announces that it has agreed to an exclusive sponsorship of the Cartotalk online discussion group for cartography and design.
“We have been looking for a suitable online forum of cartographic discussion to which to lend our support for some time now” said Ted Florence, president of Avenza. “Cartotalk is definitely a worthwhile and active forum and we are delighted to participate in its growth and to see it flourish as the main source of exchanging information on map-making subjects”, he added.
“The goal of Cartotalk was to create a forum for cartographers with an emphasis on the design aspects of cartography. Avenza’s MAPublisher is widely recognized as an important tool in modern-day digital cartography and we are very pleased to have Avenza participate in Cartotalk to such a degree” said Nick Springer of Springer Cartographics, the administrator of Cartotalk. “We hope that Avenza’s involvement and support Cartotalk will help make it the primary portal for cartographers” he added.
More about MAPublisher
MAPublisher is powerful map production software for creating cartographic-quality maps from GIS data. Developed as a suite of plug-ins for Adobe Illustrator and Macromedia Freehand, MAPublisher leverages the superior graphics editing capabilities of these applications with the strength and power of GIS data. Full details and downloadable demo versions are available at www.avenza.com.
More about Avenza Systems Inc.
Avenza Systems Inc. is a privately held, award-winning supplier of powerful map-making software and affordable geodata products. The Company also offers product training and consulting services. Visit www.avenza.com for more details.
More about Cartotalk.com
Cartotalk is a public forum for cartography and design which includes sections on general cartographic news, a searchable discussion forum, an events calendar and related tutorials and tips. Cartotalk is maintained by Springer Cartographics of Crosswicks, NJ and can be found at www.cartotalk.com.
For further information:
Tel: 416-487-5116
Email: info@avenza.com
Web: www.avenza.com
3 part set of GIS map data covering the world at 1:15 million scale.
Toronto, ON, March 22, 2005 – Avenza Systems Inc., the developer of MAPublisher map production software and MAPdataUSA shapefile data for the United States , is pleased to announce the release of MAPdata World, a 3 part set of royalty-free GIS map data covering the world at 1:15 million scale.
This detailed world vector dataset was initially created by Avenza UK reseller and digital data experts, The XYZ Digital Map Co., Ltd., and was specially created / designed for Avenza and the MAPublisher user. As a result it contains many data and design elements you will not find anywhere else in a world data set.
MAPdata World comes complete with ESRI Arcview project and shapefiles, MapInfo tab and workspace files and a set of MAPublisher-optimized mid/mif files which have been fine tuned and simplified for optimum performance with MAPublisher, whether working in Adobe Illustrator or Macromedia FreeHand.
Vector data layers include towns, roads, railways, rivers, lakes, administration areas and lines, symbols and physical names. Raster contour and hillshading layers are also available. This is a royalty-free data set that allows for the unrestricted use of all files for the design and creation of maps for print and/or electronic distribution.
“MAPdata World is our response to customer requests for more high-quality and royalty-free map data that they can use with MAPublisher or their GIS,” said Ted Florence, president of Avenza Systems Inc. “This data set has everything you need to make detailed maps of the world or world regions whether for publication or for use with your GIS.,” he added.
Summary of MAPdata World features and benefits:
royalty-free*
ready for immediate use in your GIS or with MAPublisher
cross-platform (Windows and Mac) compatibility
presented in widely used GIS file formats
optimized files for use with MAPublisher included
includes national road and rail networks
includes hydrologic features such as drainage, rivers and lakes
includes up-to-date administrative boundaries
raster hillshading and contours are included
selected features include attributes for labeling
project and workspace files contain labels set at pre-determined zoom levels for ease of viewing
MAPublisher-optimized files include preset labels that can be used without further modifications
For complete product details and downloadable samples visit www.avenza.com
*certain restrictions apply. See website for details.
MAPdata World is available now direct from Avenza Systems Inc. and through Avenza’s worldwide reseller network at US$999 for the complete 3-format set or at US$599 for an individual file format.
More about MAPublisher
MAPublisher is powerful map production software for creating cartographic-quality maps from GIS data. Developed as a suite of plug-ins for Adobe Illustrator and Macromedia Freehand, MAPublisher leverages the superior graphics capabilities of these design packages with over 40 tools including import/export of major GIS file formats with all the attribute information intact and usable.
More about Avenza Systems Inc.
Avenza Systems Inc. is an award winning, privately held corporation that provides cartographers and GIS professionals with powerful software tools for making better maps. In addition to software offerings for Mac and Windows users, the Company offers value-added data sets, product training and consulting services. Visit www.avenza.com or call 416-487-5116 for more details.
More about The XYZ Digital Map Co., Ltd.
The XYZ Digital Map Co., Ltd., based in Scotland , are specialists in Geographic Information Systems (GIS) and cartography. They supply map data for GIS users and the web as well as specializing in map creation and complete map and GIS database design and production services. Visit www.xyzmaps.com for more details.
For further information:
Tel: 416-487-5116
Email: info@avenza.com
Web: www.avenza.com
Toronto, ON, February 7, 2005 – Avenza Systems Inc., producers of MAPublisher cartographic software, announces that the School of Mathematical & Geospatial Sciences at RMIT University in Melbourne, Australia has chosen the MAPublisher software for use in their cartographic lab.
“We have continually subscribed to the ideas that contemporary cartography education programmes must ensure that the ART is not excluded in the rush towards automation of the mapping process” said William Cartwright, Associate Professor of Multimedia Cartography. “Students in the bachelor of Applied Science in Multimedia Cartography have access to a wide range of mapping, GIS, multimedia and scientific software and the addition of MAPublisher will complement these software packages and allow for us to realize the ART elements, by combining existing software and processes with the design and production capabilities that MAPublisher offers”, he added.
MAPublisher will be primarily used in the software lab by staff and students towards the degree. This 3 year program educates students who have an interest in multimedia technology and geographical visualization, and who wish to apply these interests to tasks involving the design and production of contemporary maps and geospatial products. The program then allows students to enter the bachelor of Applied Science in Geospatial Science (honours), where they are able to undertake a research programme that focuses on a contemporary cartography issue. Students will be able to take advantage of the graphics capabilities of MAPublisher to produce high-quality maps.
More about MAPublisher
MAPublisher is powerful map production software for creating cartographic-quality maps from GIS data. Developed as a suite of plug-ins for Adobe Illustrator and Macromedia Freehand, MAPublisher leverages the superior graphics editing capabilities of these applications with the strength and power of GIS data. Full details and downloadable demo versions are available at www.avenza.com.
More about Avenza Systems Inc.
Avenza Systems Inc. is a privately held, award-winning supplier of powerful map-making software and affordable geodata products. The Company also offers product training and consulting services. Visit www.avenza.com for more details.
More about the RMIT School of Mathematical & Geospatial Sciences
The School of Mathematical & Geospatial Sciences at the Royal Melbourne Institute of Technology was created in 2004, combining the former Department of Geospatial Science with the Department of Mathematics and Statistics. It draws together disciplines involving the quantitative and qualitative visualization of data in a unique amalgam of expertise and application. As well as teaching its own undergraduate science degrees in Geomatics, Mathematics, Multimedia Cartography and Surveying, the School is a key provider of service teaching to other Schools of the RMIT University . The School also offers graduate programs at Graduate Diploma, masters and Doctoral level.
For further information:
Tel: 416-487-5116
Email: info@avenza.com
Web: www.avenza.com
One of the powerful remote sensing tools available in Adobe Photoshop is to detect the land surface information by creating a false color composite image. Multispectral images contain the reflectance information from the visible and invisible electromagnetic spectrum. Using this information, we can detect many kinds of land surface information. For this example, we will detect the green area using Landsat images imported by Geographic Imager for Adobe Photoshop, which ensures all the georeference information is maintained.
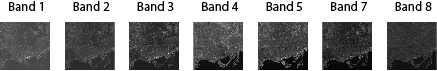
Landsat images consist of several gray scale images, with each image containing one of the bands of the electromagnetic spectrum. For example, in the Geographic Imager tutorial folder, there are a set of Landsat images available. Those gray scale images are from Band 1, 2, 3, 4, 5, 7, and 8.
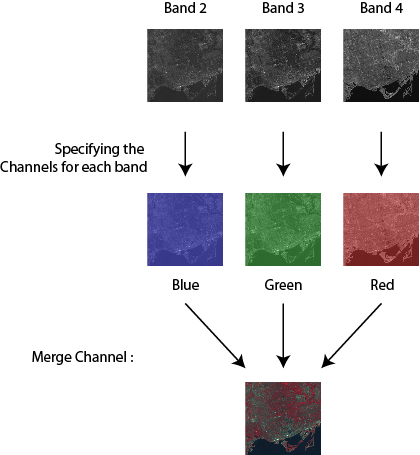
These images need to be combined into one image. The Adobe Photoshop function called “Merge Channels” produces one image by combining mulitple gray scaled images. With this example, those gray scale images from Band 2, 3, and 4 will be merged into one image by assigning a color for each band.
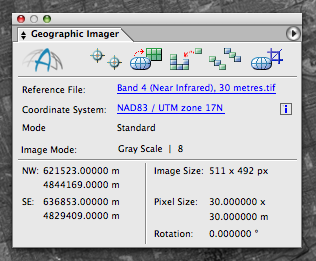
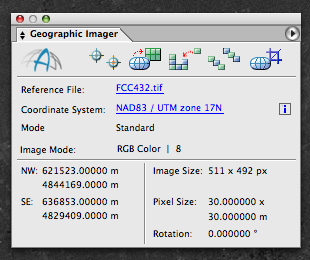
1) Open the Landsat image from Band 2, 3, and 4. Note that the Geographic Imager panel shows the information on the coordinate system and image extents.
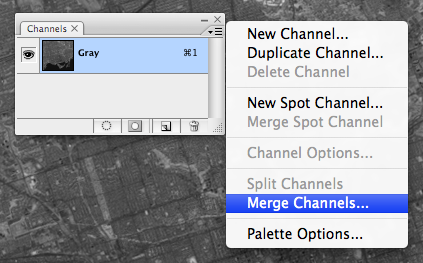
2) Open the Channel panel (Window > Channels). Choose “Merge Channels” from the panel options menu.
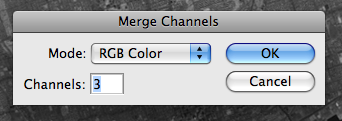
3) In the Merge Channels dialog box, select RGB color as the mode.
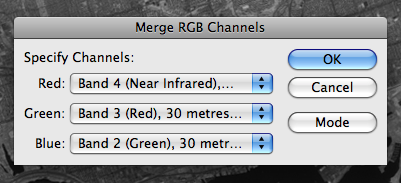
4) In the Merge RGB Channels dialog box, specify the band for each channel: band 4 for the red channel, band 3 for the green channel, and band 2 for the blue channel.
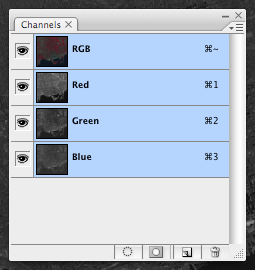
5) As a result, those three images from Band 2, 3, and 4, are assigned to the Blue, Green and Red channels, respectively.
6) Now, let’s take a look at the image!
This combination of false-color makes vegetation appear as red tones. The bright red color indicates the growing vegtation. Water is displayed in a blue color. When the water contains high sediment concentrations, the color will be lighter blue. Urban areas will appear gray to blue-gray in color.
7) All the georeferenced information is inherited by the new image with merged channels from those original images. The georeference information is displayed in the Geographic Imager panel.
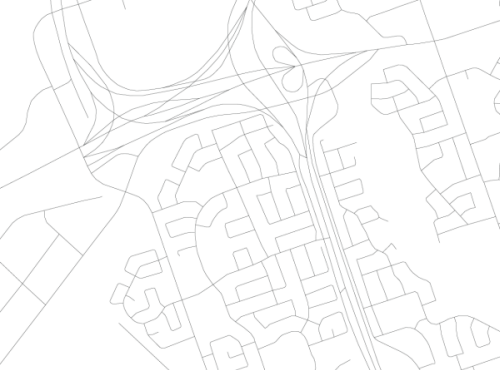
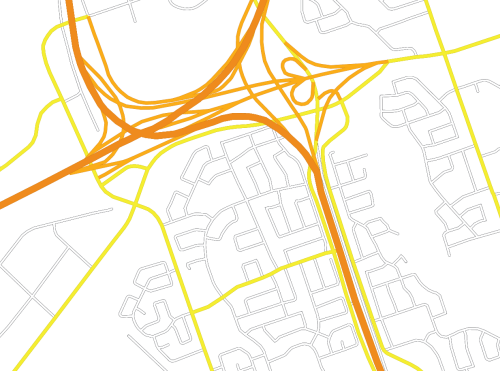
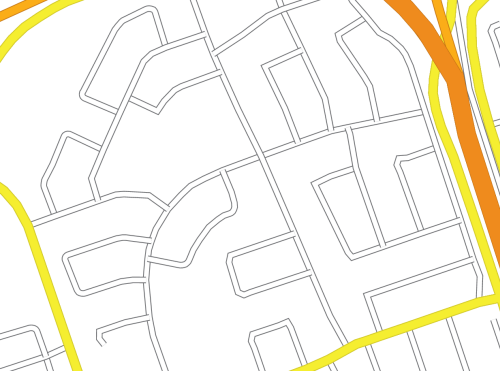
Here’s a question we receive at Avenza support quite often: I’ve located and imported a GIS layer of road lines with attributes for the city I’m mapping. How can I turn this:
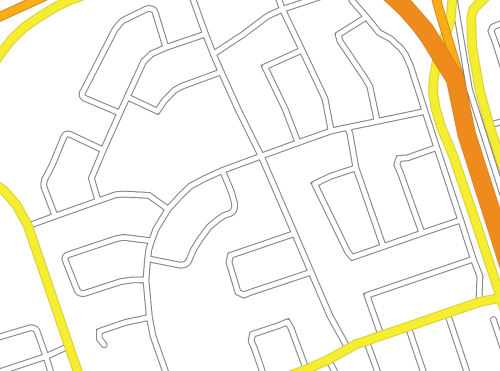
into this:
Getting Started
The workflow for this process involves the use of both MAPublisher and Adobe tools, specifically MAP Stylesheets and MAP Selections along with Illustrator’s Graphic Styles and the Appearance Panel.
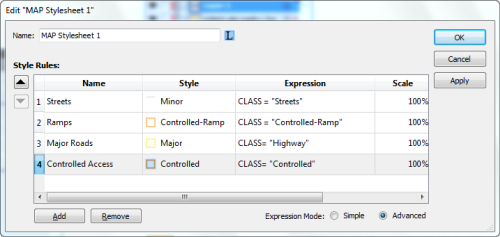
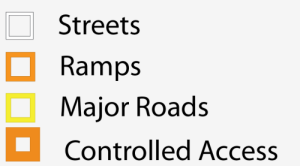
This process works on roads that have an attribute on which you can base classification rules. My road data has a column named “CLASS” with four categories: Controlled, Controlled-Ramp, Highway, and Street. I’ve created a graphic style for each and loaded them using “Open Graphic Style Library”. I keep the road styles I have created in a template document titled RoadStyles.ai so that I can import the graphic styles I need into whatever map I’m making from my template (see Adobe Graphic Styles Help).
Controlled Access Highway:
Controlled Access Ramp:
Major Road:
Minor Road:
These styles all have been created using the Illustrator Apprearance panel to overlay two strokes, the top stroke with a smaller weight and different colour than the bottom stroke (see Adobe Appearance Panel Help).
With our graphic styles set I can now apply the MAP Stylesheet I built using the following expressions:
Cleaning up with groups
Once we apply these styles using MAPublisher Stylesheets, we will see what steps we muys take to get the appearance we want. Our roads look like this:
but we want them to look like this:
Why does this happen?
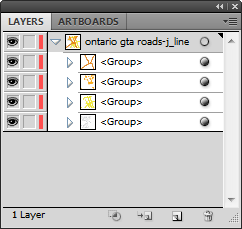
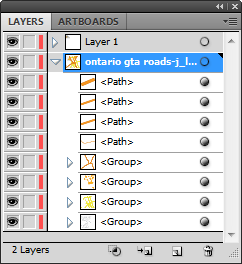
This occurs because MAP Stylesheets applies graphic styles at the path level. To look like intersections, each road classification must become one object, whether by being grouped or by turning the various paths into a compound path. Grouping is the preferred method for managing these objects since a compund path will delete the attributes of all paths that are being compounded. In this case, the street names field would be blank for our compound path object as dozens of streets are turned into one compund path. The consequence of this would be to make automatic labelling with MAPublisher Label Pro impossible. A set of paths turned into a group will not have their attributes available to MAPublisher while in a group, however these objects can always be ungrouped making individual paths and their original attributes available again.
Grouping Objects
In order to group our road classes we will have to select the road paths belonging to each class. The expressions we created when defining our MAP Stylesheet rules are available to us to use again through the Expression Library (new in MAPublisher 8.3). We can use MAP Selections to individually select each of our road classes. Once selected the street classes can be grouped using CTRL+G on your keyboard or Object > Group from the menu (See Adobe Group Help). The final step is to re-apply the graphic style appropriate to each group using the Adobe Graphic Style panel.
If we want to get technical here in considering what has happend to our artwork, using the Appearance panel we can see that each of the paths we initially imported now has a graphic style applied to it on two levels: at the path level (done through MAP Stylesheets) and at the group level (done by grouping and applying a graphic style to the group). It is possible to symbolize our artwork even further, at the layer level, by slecting the target symbol for our roads layer (See Adobe Layers Help). If desired we could apply a transparency at the layer level that would supersede all graphic styles used on objects in the layer. Our artwork will now have symbolization that suggests intersections, giving our road map a much neater appearance.
Tweaking
Now that our roads are grouped together, they are much easier to manage in the Illustrator Layers panel.
Groups can be stacked easily. My preference is to arrange with minor roads at the bottom, increasing to multi-laned divided highways at the top of the hierarchy. With our objects grouped it is easy to move objects between groups. Any path can be selected using the Direct Selection Tool and dragged in the Layers panel between groups. This is much simplier than having to use the Appearance panel to strip the path of both graphic styles and apply the desired style. There will be some situations where we will need to override the intersection appearances that result from grouping. In this image we have onramps that definitely do not interesect as this line work suggests!
To do this we must select the road lines that will be on top of the intersection, and using the Illustrator Layers panel, drag them from their group (it does not matter where in the layer hierarchy the are placed).
Our ungrouped ramps can now be sent backwards and forwards relative to other paths, giving a truer representation of the road network:
Using MAP Stylesheets to create a Legend
So why use stylesheets if we must manually group the objects after use? For a few reasons: it keeps us organized, it adds the expressions to the expression library, and most importantly MAP Stylesheets can automatically generate a Legend for us that reflects our Stylesheet rule names:
Good luck creating customized road styles! A deeper understanding of the Illustrator object styling hierarchy can go a long way in helping you use MAPublisher to leverage your GIS datasets!