Every year new projections are created and we endeavour to add all of them to MAPublisher with new releases. While we’re very excited about Equal Earth coming in MAPublisher 10.4, there are a few other new projections that will also be added. Looking outside of our regular sphere of planet earth, we’re excited to announce we’ll be including Narnia Conic, Pandora Copernican, Camelot Equal Area and Atlantis Azimuthal.
We’re very comfortable mapping planet Earth. There are hundreds of projections to choose from, whether you’re mapping a town, a state or a continent there are lots of options. While the world of planetary cartography is growing, there are relatively few projections for planets outside our realm. Pandora Copernican is the first of its kind and can be used for the entire planet of Pandora. While the Na’vi may not be big map users, the humans on Pandora need them in their quest for unobtanium.
Narnia Conic and Camelot Equal Area will help create a more solidified general map for both lands. While both exist in different realms, these projections will help cartographers create maps to assist readers in identifying key plot locations and add to their enjoyment of the story. By creating projections for these two areas, the maps created for these mythical areas will now allow for a more accurate representation of the fantasy.
The most anticipated projection, Atlantis Azimuthal, will allow any cartographer to display Atlantis in its full glory. With Atlantis Azimuthal, the islands around Atlantis will be shown in proper relation to the capital, along with the canals. Bringing Plato’s land to life, Atlantis Azimuthal will be a staple for all cartographers mapping mystical lands.
These undoubtedly useful, otherworldy projections will be available with the upcoming release of Avenza’s MAPublisher cartographic plug-in for Adobe Illustrator.
We are always looking for shortcuts to make work easier for our MAPublisher users. One way to simplify your workflow is by automating some of the routine tasks that are required to make maps using MAPublisher in Adobe Illustrator. Not everyone is familiar with software automation, or even knows that it’s available in MAPublisher but if you are curious to learn more, then keep reading!
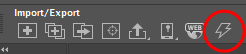
Automation tools in MAPublisher help to make simple or repetitive tasks easier and faster. Automation can be run independently or in conjunction with the FME Auto MAPublisher Plug-in which allows more advanced automation. The Automation tool can be accessed from the automation button (lightning bolt) on the MAPublisher toolbar, or by clicking in the menu Object > MAPublisher > Automation.
There are several automation options available in MAPublisher. You can use automation to create MAP Grids, apply labels, apply applicable MAP Stylesheets, and even export to geospatial PDFs. An important point to note, to use automation on a MAPublisher document, the document must be active in Illustrator.
Automating Map Views
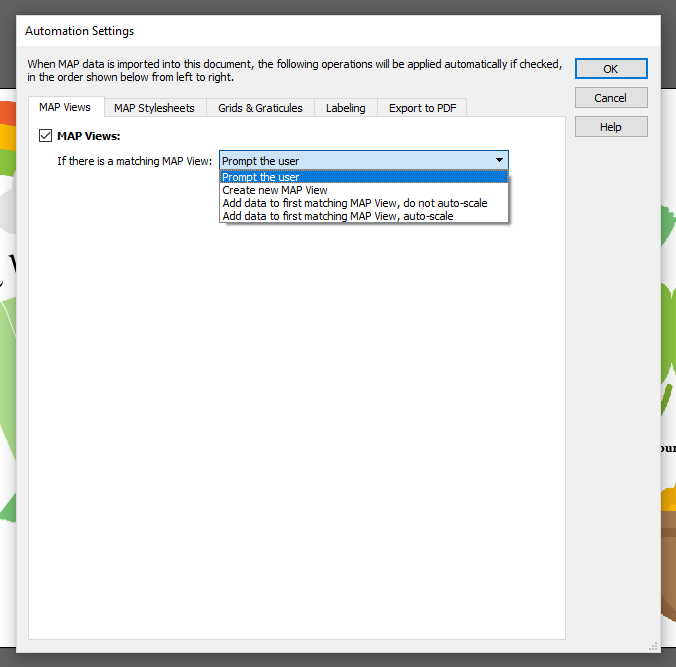
If you’re planning to use automation, you’ll have to enable the specific options you would like to automate. For example, to import data to a matching MAP View, simply enable the MAP Views option, and select from the dropdown list the tasks that you want MAPublisher to complete. Make sure that the coordinate system of data being imported matches a coordinate system of the existing MAP View, then select one of the four actions for your data.
Automating MAP Themes
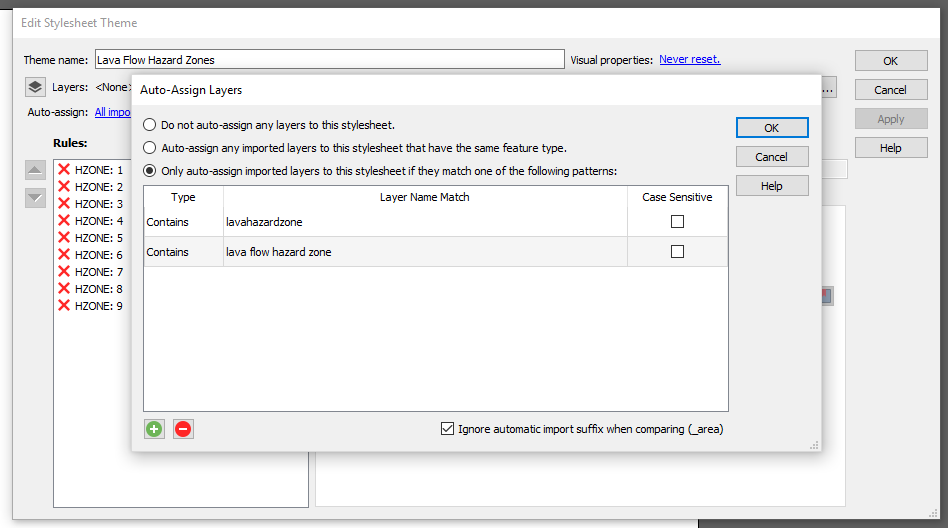
If you’re a fan of MAP Stylesheets (we all know they make our lives easier) then you can have MAPublisher apply them using automation. Enable the option and MAPublisher will apply any MAP Themes that meet the criteria to the imported data. Don’t forget to set the ‘Auto-assign’ in the specific MAP Stylesheets themselves as well since you can’t link layers that haven’t been imported yet. If the ‘Auto-assign’ properties aren’t set correctly, your data will import but the stylesheet will not be applied.
Automating Grids & Graticules
For Grids & Graticules, you can set the extents for the grid bounds with either the MAP View or a layer that you’re going to import. If you’ve already created configuration files for your grid, then select either ‘All configuration files in this folder’ or ‘Only these configuration files’ if there is a need to use only certain configuration files.
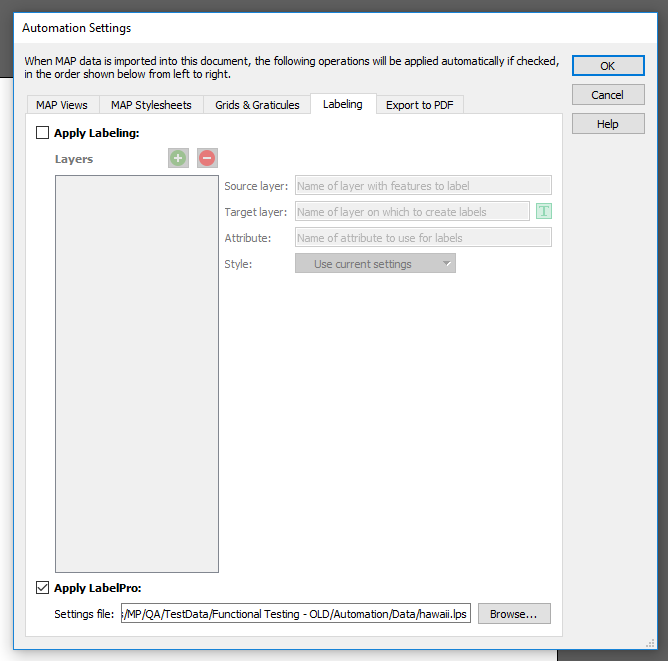
Automating Labeling
When you enable labeling, choose either MAPublisher labeling or LabelPro. You’ll also have to choose a specific setting in the MAPublisher Preferences (Edit > MAPublisher Preferences > Import MAP Data). Uncheck ‘Append feature type as the suffix on imported layer names’ to be sure that your labels import properly.
To use the regular Label Features option, set the details such as the source layer, target layer, attribute, and the style. You can add as many layers as you need with the Add Layers button on the left, and remove as necessary. If you’re using LabelPro, simply load the .lps file.
Automating Export to Geospatial PDF
Last but not least, if need your document to be exported to a geospatial PDF as the last step of the automation process, enable the option and specify the location you’d like it saved in. Once you’ve selected all of your automation settings, import your data to watch your automation work!
Enabling automation in MAPublisher can speed up your map making process, and make your workflow easier. Save yourself extra steps when working with stylesheets and grids you’ve already created, and let automation do the work for you. Simple MAPublisher magic!
Last year we wrote a blog post about some of our team’s favourite MAPublisher features. Not surprisingly for software that has been around for over 20 years, everyone had a different favourite and we had to be selective for the blog post. This year, with new team members coming on board and new MAPublisher releases it’s a good time for a new list of favourites. Check out some of these features that you might not know about, and find out how they can make your workflow easier!
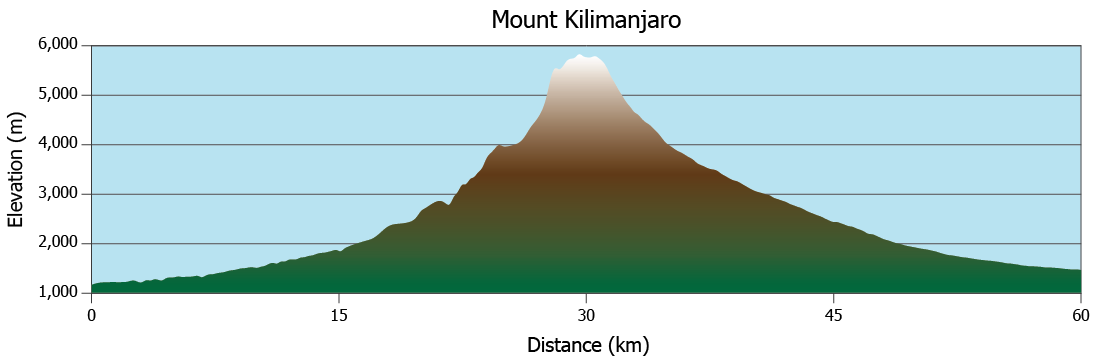
Create Elevation Plot
Jeff C. – Quality Assurance
Prior to MAPublisher 10.3, “Create Elevation Plot” was a feature of Path Utilities I seldom used because, to be honest, it had a few limitations. MAPublisher 10.3 introduced a completely new way of creating elevation profiles, and the difference is astounding. The available customization options are endless – not only can you select whether your axes will use metric or imperial units, but you can also set the Line Colour, Line Width, Fill Colour, Background Colour, Axis Intervals, Axis Labels, Graph Size and much more. Another aspect of this updated tool that I love is the ability to save and re-use ‘styles’. These styles remember specific elements of an elevation profile (e.g. appearance, units, size, etc.) and can be applied to other profiles made in the future, saving the user a lot of time.
Text Utilities
Keith S.- Quality Assurance
In my opinion, the Text Utilities tool is one that is underutilized in MAPublisher. The tool allows you to perform actions on text within a document, including Curve Text to Latitude, Draw Shape Around Text, Merge Text, Create Line From Text on a Path, and many more. The actions can be performed on selected text only, text on specific layers, or all text in the document. The tool even allows the user to preview most actions before committing the changes.
If you have ever seen text along a path with a red plus symbol at the end of it after performing a transformation or manual adjustment it is an indication that the text path is not long enough to contain all of the text. No problem for my favourite action in the Text Utilities tool—Extend Overflowing Text. This utility solves the issue by extending the text path to a length which will accommodate the full length of the text.
Join Lines
Oliver N. – Customer Support
One of my favourite tools to use in MAPublisher is the Join Lines tool. If you are working with a road or rail network and sections of the same track or street connect to each other but are broken into different line features, you can easily join them into single features with a common attribute like Street Name or Track Number. You can target a line layer and then in the Destination options, choose either to perform the join on the original target layer or specify a name for a new line layer that will contain the joined lines. You can also use a proximity value to determine how close the lines must be in order to be joined. I find that this tool allows subsequent styling to be done easily and saves a lot of time in arranging the data to your needs. It also reduces the size of your file by compiling data into fewer features.
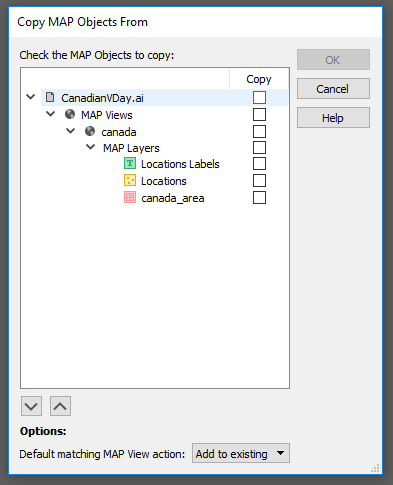
Copy MAP Objects From
Keith S. – Quality Assurance
This feature allows users to copy MAP objects (including MAP Views, MAP Layers, MAP Themes, MAP Selections, and MAP Locations) from one open document to another. MAP Views can be copied by themselves or with their associated MAP Layers. The best part is, that any artwork which is copied to the destination document will retain its styling provided that the custom colour swatches used in copied artwork are set as “Global” in the Adobe Swatch Options dialog. It works like this: With the destination document open, launch the Copy MAP Object From tool. Select the object(s) you want to copy to the destination document by checking the checkbox beside each object, then click “OK” to perform the copy. Copy MAP Objects From is one of my favourite features because it saves so much time when styling maps!
MAP Themes Scaling Charts
Bob P. – Business Development Associate
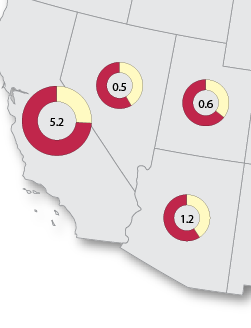
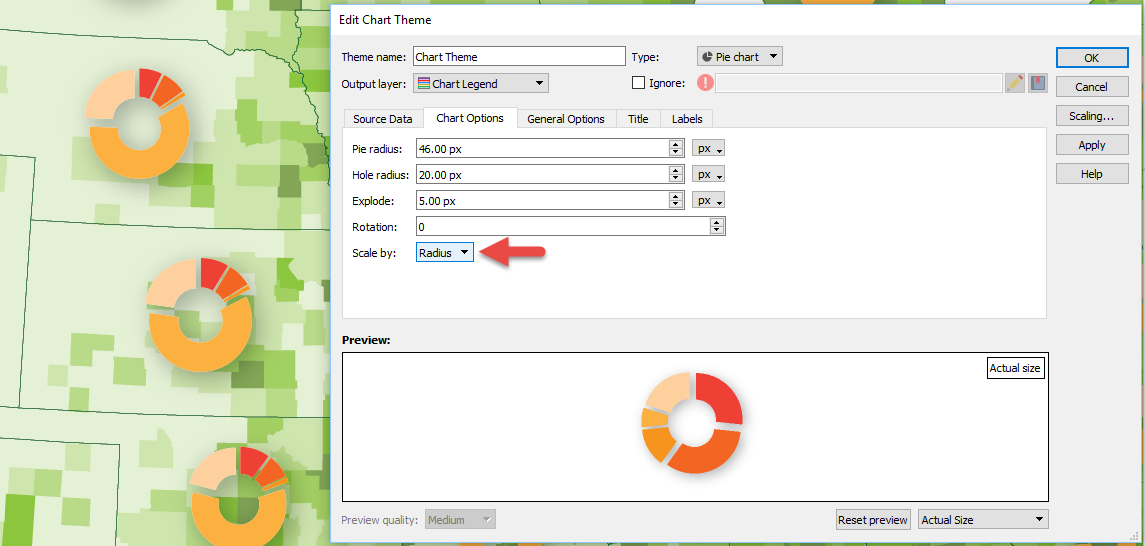
My favourite way of making infographic maps is using our MAP Chart themes. Within Chart Themes, you can add a bar or pie chart to any point layer, based on any set of attributes from the point layer. For an added level of information, each of the charts can be scaled based on the value from another attribute. This helps when you want to show the proportion of values, but also give an indication of the total population size for each point too. The best part is MAPublisher allows you to pick between Area and Radial scaling for pie charts. If the population of one point is twice the size of the smallest point, it can either have twice the area, or twice the radius length. This is my favourite tool in MAPublisher, because it shows that our team thinks of everything to make sure cartographers can make the exact map they want, right down to the smallest details.
About the Authors
Jeff, Keith, Bob and Oliver are all members of the Avenza Systems Team and their passion for maps shows through in the work that they do with our clients and in developing MAPublisher.
Happy Valentine’s Day! What better way to celebrate than with new maps (and creating infographics) about love? This year we’ve hunted for romantic data for Canada and the United States and visualized it all for you using MAPublisher 10.3 and Adobe Illustrator.
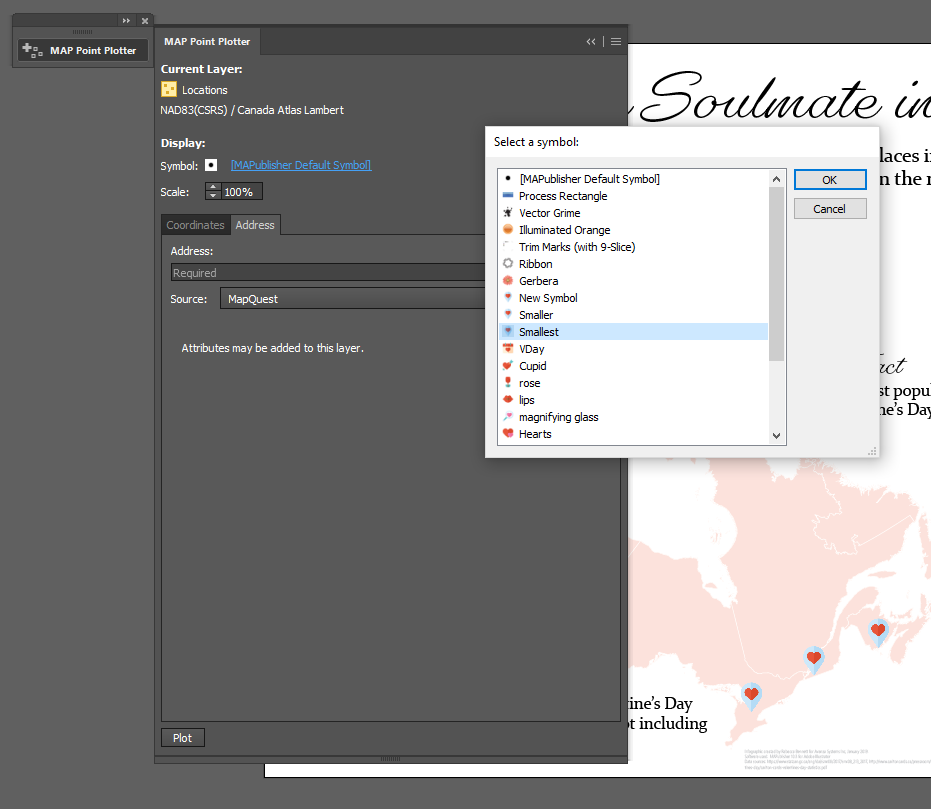
The first map shows all the most romantic locations (at least as their names suggest) in Canada. This information was provided by Stats Canada. Using the MAPublisher Point Plotter, it was easy to plot all of the locations!
The best part about using the Point Plotter is you can choose any symbol available in your symbol library to mark the points. I chose the symbol that I wanted (a Valentine’s map marker–how adorable!) and then plotted each location simply by using the town’s name and province.
After adding some text and symbols in keeping with the theme, the map was ready to go! You can check out the PDF below, or, you can download the georeferenced version from the Avenza Map Store, for use in the Avenza Maps app.
Moving on to my infographic – which is a popular and engaging way to illustrate statistics and small amounts of data that might otherwise be overlooked. I found data from the United States covering a variety of Valentine’s Day topics. The plan is for my infographic to include two maps and two additional charts. The first map illustrates the average wedding cost by state, and the second map shows popular proposal locations.
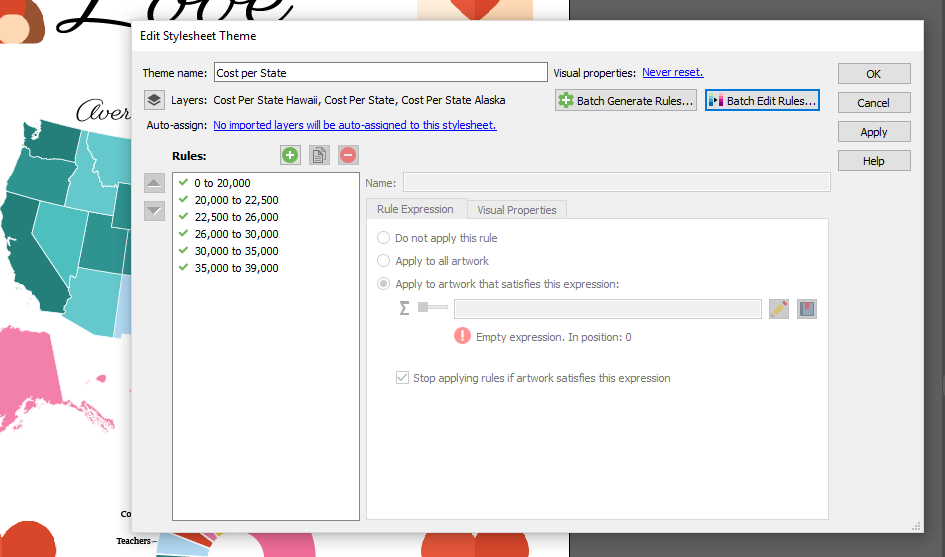
For the average wedding cost per state map, I used a MAP Theme to colour all the states appropriately (and quickly!). The benefit of using a MAP Theme is that you can apply a theme to multiple layers at once. Since Hawaii and Alaska were projected separately from the mainland of the United States, they exist in different layers on the artboard. Using a MAP Theme made it easy to include them in the colour scheme of the map.
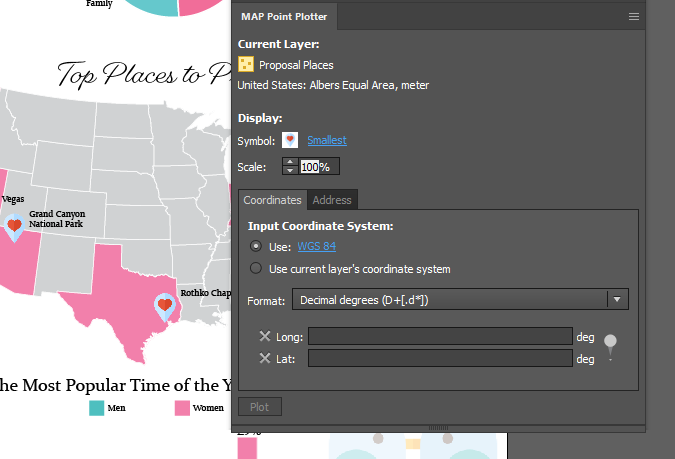
On the second map, I want to map the most popular proposal locations in the country. I used the MAP Point Plotter tool again, but, this time, I used the latitude and longitude to plot the points because some of the locations could not be plotted by name alone. It’s very beneficial to be able to swap between the two options!
My maps are complete, and after adding two graphs (made using the graphing tools in Illustrator) containing even more fun Valentine’s day data, and some love-ly symbols, the entire infographic was finished. You can check out the completed infographic below!
About the Author
Rebecca Bennett is a member of the Marketing Team at Avenza Systems and loves making creative and visually appealing maps.
We’re excited to announce the release of MAPublisher 10.2 for Adobe Illustrator. The MAPublisher product team has been working closely with our customers to build these features to improve map design productivity.
MAPublisher 10.2
This update contains new features and performance improvements as well as fixes for reported issues. Some highlights are mentioned below, for the full release notes see below.
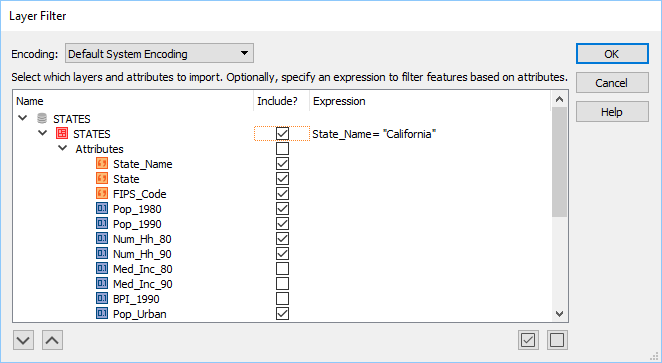
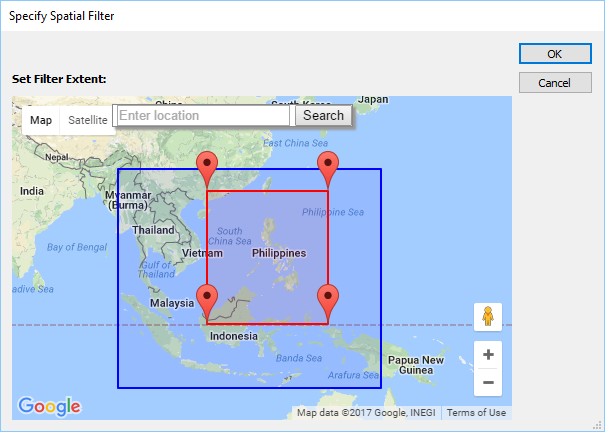
Filter layers and attributes with expressions on import. This feature that has been requested by many users in the past and we’re happy to say it’s finally here! While filtering attributes and geometry has been available since MAPublisher 10.0, the ability to filter specific layers and attributes using an expression was not available until now. This let’s you fine-tune your layer and attribute filter to only include (or exclude) specific data at the attribute value level. This improves Adobe Illustrator performance by reducing the number of map features and attributes being imported. The Filter Geometry feature has been renamed Spatial Filter and it retains the same functionality. In addition, these filtering and simplification tools reside together in an improved user interface.
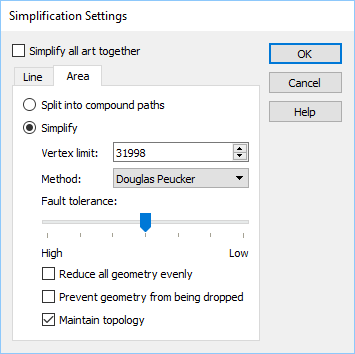
Simplify complex art on import. Another new import feature that reduces the amount of data is Simplification. It allows for the simplification or generalization of vector line and area data during data import instead of after. Using simplification during import reduces the number of map features and attributes being imported and improves overall performance. Simplification can be applied to all art together or applied separately to lines or areas and use either the Douglas-Peucker or Visvalingam-Whyatt method for removing nodes and vertices.
New support for WFS 2.0, AutoCAD 2018, and OGR formats. Several new formats are supported and updated in MAPublisher 10.2. The WFS 2.0 specification improves on a number of functionalities including response paging. More than 1,000 features can be loaded from a WFS server now. The AutoCAD 2018 format allows you to import and export version 22.0 DXF, DWG and DGN files. Read and write capabilities have been improved by updating OGR import formats (GML and PostGIS) and OGR export formats (GML and GeoJSON).
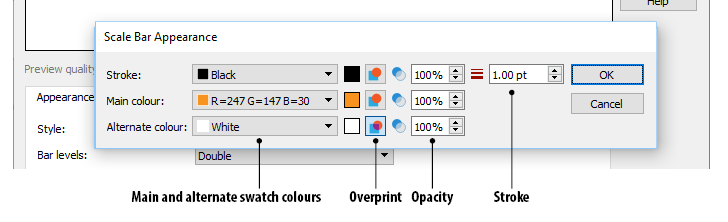
Overprint option for MAP Legend art. Overprint is essential in print production and reduces unsightly edges that could appear if printing plates are not perfectly aligned. MAPublisher generated art from Scale Bar, Grids and Graticules, and MAP Theme legends now have an overprint setting to ensure that art can be maintained as MAPublisher objects without having to expand art as separate objects, strokes, and fills.
MAPublisher 10.2 Release Notes
Filter layers and attributes with expressions on import
Simplify complex art on import
Import support for WFS 2.0 and AutoCAD 2018
Export support for GeoJSON and AutoCAD 2018
Introduces MAPublisher with a Simplified Chinese interface option
With the release of MAPublisher 10.1, you no longer have to worry about recreating map legends every time you update them. Automatic Legend Update, available in the latest release, now allows for simple updating of an existing legend. Automatic Legend Update lets you update attribute data, or change the symbology/classification method/attribute field that is linked to a legend, and automatically have the legend update to reflect these changes – no more having to recreate the legend each time you want to change something! This is possible even with MAP Themes and Legends created in older MAPublisher versions once they are brought into the 10.1 environment.
In this blog, we’ll discuss how to open MAP Themes and Legends created in older versions of MAPublisher in the 10.1 environment in order to transform them into Automatic Legend Update. This example classifies populated places in Hawaii based on elevation. We will use the ‘Create MAP Theme Legend’ tool to create a copy of the legend, which by default will be set to automatically update. Any future changes applied to the associated MAP Theme will automatically be applied to the new legend.
Step 1
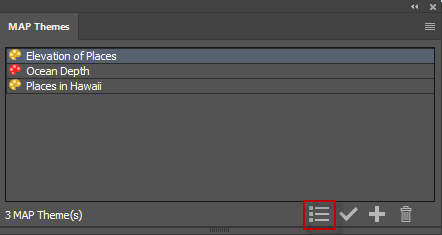
Open the MAP Themes panel from the MAPublisher toolbar. With the ‘Elevations of Places’ MAP Theme selected, click the ‘Create MAP Theme Legend’ button to create an Automatic Legend Update.
Step 2
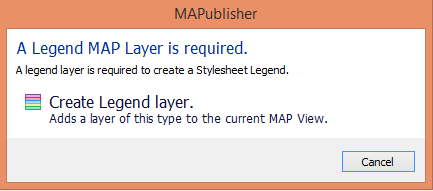
You’ll be prompted to create a Legend layer if you don’t already have one. Click ‘Create Legend Layer’ to continue.
Step 3
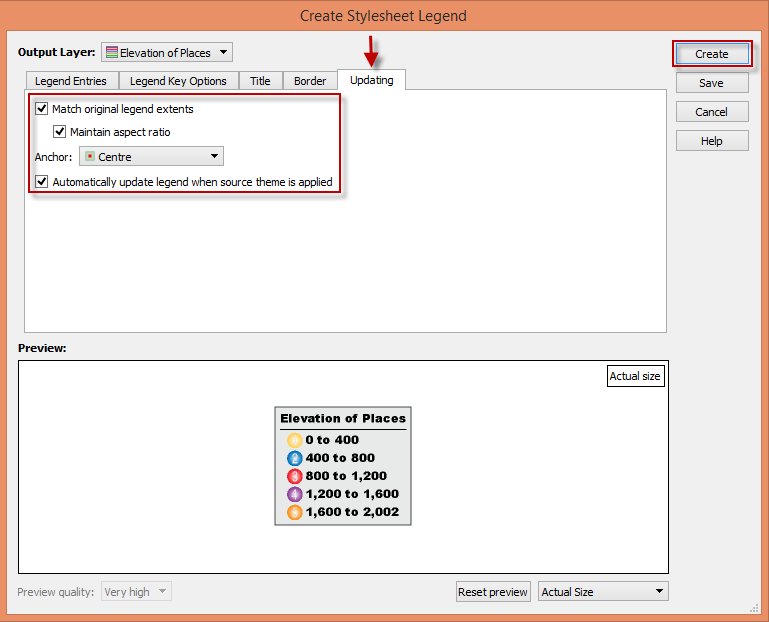
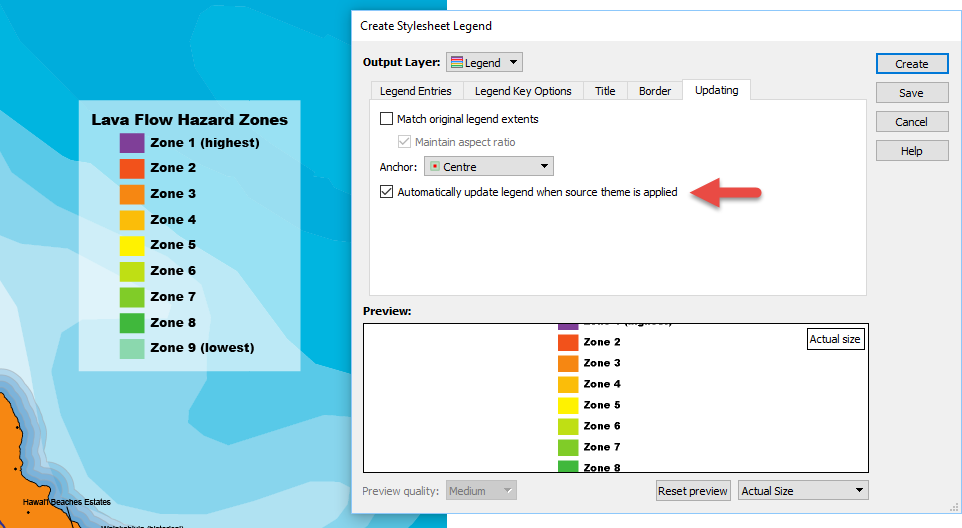
Note the legend in the ‘Preview’ section and how the legend styling and symbology are preserved, thus saving time. Click the ‘Updating’ tab to see or change your Automatic Legend Update settings. The “Automatically update legend when source theme is applied” checkbox is checked by default. In this blog, we’re also going to check the option to “Match original legend extents” to maintain the size and extents of the legend so as to not change the map layout when items are added to the legend. Instead, the legend elements will change size in order to fit within the existing legend extents. “Maintain aspect ratio” is checked to make sure that the legend elements resize proportionally and a ‘Centre’ anchor allows the resizing to start from the centre of the elements. Once you’re satisfied with your settings, click ‘Create’.
This will create a new legend with Automatic Legend Update that can be moved to any location on the map.
Now that you have created a copy of the legend with Automatic Legend Update, your legend will update when changes are applied to the associated MAP Theme.
A legend characterises a map and MAPublisher 10.1 helps to keep it up to date.
We’re excited to announce that we’ve released MAPublisher 10.1 for Adobe Illustrator. The MAPublisher product team has been working closely with our customers to build these features to improve map design productivity.
MAPublisher 10.1
This update contains new features and performance improvements as well as fixes for reported bugs. Some highlights are mentioned below, for the full release notes see below.
Automatically update existing legends when MAP Themes are modified. It’s here! MAP Theme legends are can now be automatically updated when legend items are updated in a theme. This is great time saver when you’re in the fine-tuning phase of selecting the right colour palette for your map and there is no need to manually update your legend.
New ability to create lines from text on a path. Creates a line based on a text on a path source. It’s useful for creating map features and to assist in indexing for manually created maps (i.e. scenarios where text was created manually instead of being created from attribute values). The text utility can be applied to text on a specific layer, on a specific MAP View, on the entire document or only selected text.
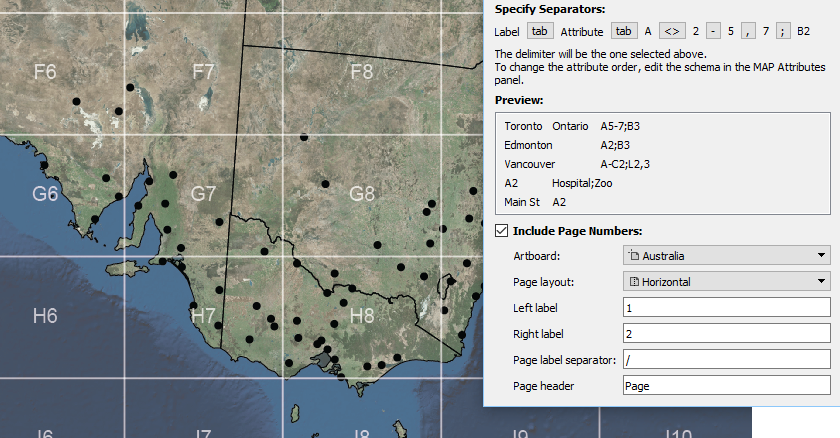
New ability to include page numbers when creating indexes. In the Make Index tool, a new Include Page Numbers option provides the ability to split a single artboard (horizontally or vertically) at the middle point to make indexes that include a reference to a page (left or right, top or bottom). This feature is useful when a map spreads over a single artboard that is intended to be split into two pages in a final output (e.g. a spread in an atlas). Text and features that span both “pages” can be listed in the index as appearing on both pages (i.e. indexing the extents of the text or feature).
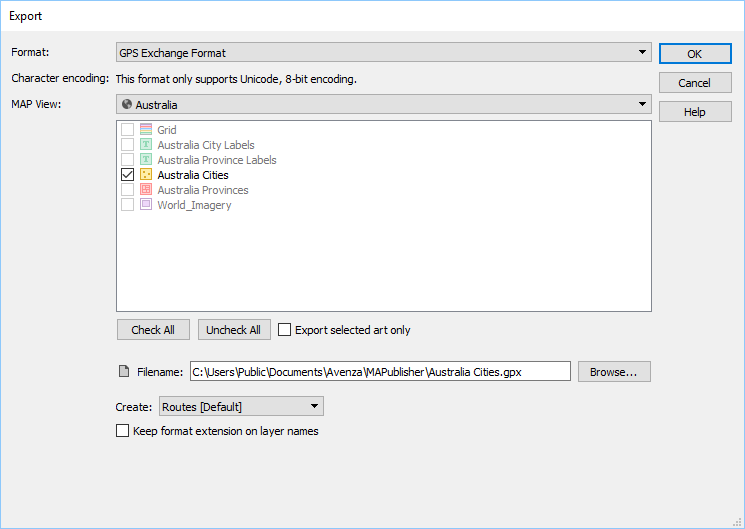
Export to GPS Exchange format (GPX) now supported. MAPublisher has long supported GPX import and now supports GPX export. It’s a format that contains contain tracks, routes and points and used to exchange data between GPS units and mapping software. It is compatible with the Avenza Maps app and many other third-party applications.
New ability to scale charts by radius. You now have the ability to scale MAP Chart Theme pie charts by radius, in addition to the existing method of using area. This provides another level of fine-tuning while adjusting charts to get proportional scaling correct. Remember that there are advanced scaling features available in the Scaling dialog box (just click the Scaling button). Learn more about chart scaling here.
MAPublisher 10.1 Release Notes
Automatically update existing legends when MAP Themes are modified
New ability to create lines from text on a path
New ability to include page numbers when creating indexes
Export to GPS Exchange format (GPX) now supported
New ability to scale charts by radius
A number of user interface and usability enhancements.
Colorado-based cartographer Mike Boruta knows a thing or two about making maps. In fact, this award-winning cartographer has been designing spectacular maps and trail guides for more than a decade. His work can be seen in the National Geographic Trails Illustrated series, in mountain biking guides released by Fixed Pin Publishing, fly-fishing reference maps curated by Stonefly Press, or most recently in the hiking trails guide for the mountainous town of Ouray, Colorado, where he currently lives. Always fascinated with viewing the world from above, Boruta has dedicated his career to capturing the beauty of mountain landscapes through well-designed maps, and captivating cartographic styles.
Following several years of post-university travel, Boruta found himself living in the tiny tourist-driven town of Ouray. Seeking more opportunities for career advancement, he moved to Arcata, located on the north-western coast of California. He considered returning to school to pursue a computer science degree but realized the subject matter did not entirely excite him. That was when a coworker of his first told him about the excellent Geography and Cartography programs at Humboldt State University nearby. He learned about a subject-stream called Geographic Information Systems (GIS), and although having never heard of GIS before, the concept immediately interested him. His years of travel had given him quite an appreciation for maps, and the GIS and Cartography programs at HSU would allow him to combine this appreciation with an interest in computer technology.
He quickly developed a passion for cartography and decided to pursue graduate schooling in Athens (OH), where he studied under established cartographer Dr. Margaret Pearce. Forever drawn back to the rugged mountain landscapes where he had lived in the past, Boruta found a particular interest in studying relief representation in cartography, the technique used to create the illusion of 3D-terrain on a 2D map. He fell in love with the work of renowned Austrian cartographer Heinrich Berann, whose painterly style “birdseye” mountain maps continue to inspire him today.
“Anytime I had to choose a place to use for projects in my cartography or GIS classes I found myself pulled back West, usually to Ouray, Colorado. I grew increasingly interested in mapping mountainous places”
In 2009, Mike Boruta first began using Avenza MAPublisher in his work. He had recently won the Arthur Robinson Award for Best Printed Map, part of the CaGIS Map Design Competition, for his entry “The Million Dollar Highway”, which explored a scenic stretch of road connecting Ouray to Silverton, Colorado. The award included a student license for Avenza MAPublisher software and allowed him to seamlessly integrate its suite of cartography tools into his already Adobe Illustrator-heavy mapping workflows. Shortly after, he began working with the publishing company Fixed Pin to create a mountain-biking guidebook for the entire state of Colorado. The project was extensive and would require the creation of several complete and detailed map sets, each describing a unique part of the state. Recognizing the vast scale of work ahead of him, Boruta sought out mapping solutions that would help him enhance the efficiency of his cartographic workflow.
“This was the first time I really got to work with MAPublisher, and it was a joy to learn and to use. I immediately found out how useful it was to set up all my graphic styles and character styles since I was having to create 118 maps with the same look and feel.”
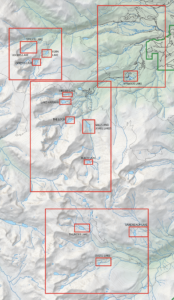
As Boruta found himself less and less dependent on dedicated GIS software, he opted to focus on completing his projects from start to finish directly in Adobe Illustrator using the many data import and manipulation tools of MAPublisher. This environment, he felt, “lent itself to so much more creativity”. Integrating these mapping tools into his workflow also meant he did not have to continuously replicate shared design features between each map, instead organizing and stylizing his data into a series of 15 “master maps” and using the MAPublisher Vector Crop tool to create separate individual maps for specific regions.
By 2011, Boruta had begun contract work with National Geographic to help produce maps for the Trails Illustrated line of topographic map products. Incredibly, in 2013 things aligned in such a way that he was able to once again move back to Ouray, the mountain-town he had fallen in love with many years earlier. There, he began meeting with the volunteer-run Ouray Trail Group (OTG) to discuss how he could help them improve their existing trail map, which is a major source of funding for the non-profit group. The first project was getting their map into the Avenza Map Store so that hikers could use the map on their phones and tablets. After that, it was clear that the newly created and extremely popular hiking route called the “Ouray Perimeter Trail” needed its own high-quality map.
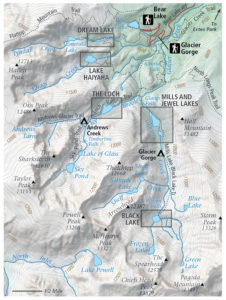
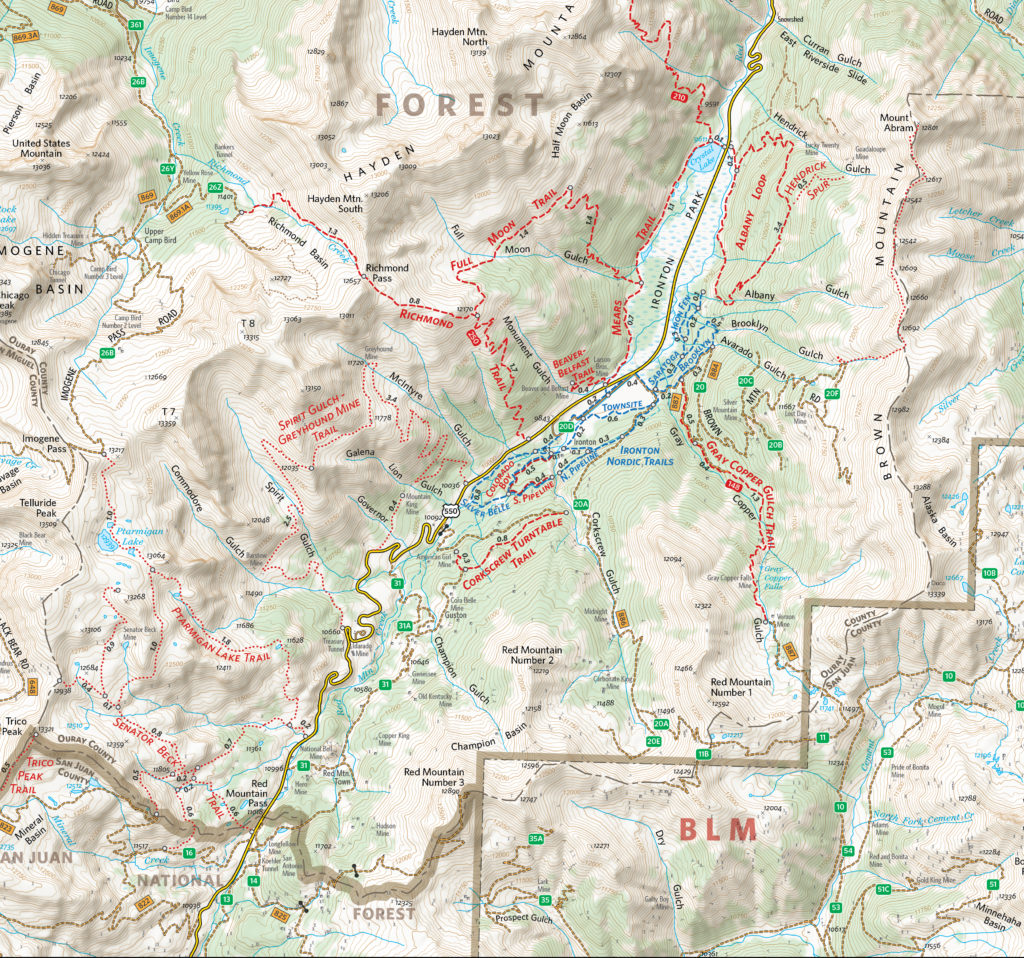
Finding some free time in the summer of 2020, Boruta dedicated himself to fully revising the Ouray Trail Group’s main trail map and also creating an all-new map for the Ouray Perimeter Trail. His vision included a highly-detailed, topographic map showing the entirety of the county’s vast trail system. He set to work collecting datasets and planning the map production, first using dedicated GIS software, before reverting to a more design-focused workflow in Illustrator.
“I quickly moved things into Illustrator and MAPublisher and never looked back. There are certain tasks I’ve grown used to doing in MAPublisher that I just find so much faster and simpler to do than if I were in ArcGIS or QGIS”.
As is common with many mapping workflows, working from mixed data sources can be a constant challenge for many cartographers, especially when data from different public agencies do not share the same projection and coordinate systems. Boruta found this to be a common occurrence while working on his OTG trail maps and highlighted his fondness for being able to drag and drop data into different Map Views directly within Illustrator. In this way, he allowed the software to automatically reproject datasets to a shared projection without having to open up any sort of tool or repeatedly configure data parameters.
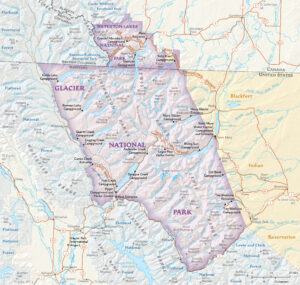
Boruta also emphasized how powerful the Vector Crop tools and “spatial filter on import” capabilities were, allowing him to quickly specify or delineate a region of interest and immediately crop all data layers to that area, retaining topology and attribute integrity, all within the Illustrator environment. When handling the reference maps used to guide the creation of the OTG trail maps, he implemented the Georeferencing tools in the Avenza Geographic Imager plug-in for Adobe Photoshop to efficiently georeference and georectify unprojected reference map images before integrating them back into his Illustrator project. After a large chunk of the summer working on the map, he delivered the finished trail map. On completing the project, he noted “It was one of the most satisfying projects I’ve ever worked on since I was literally mapping my own beloved backyard.”
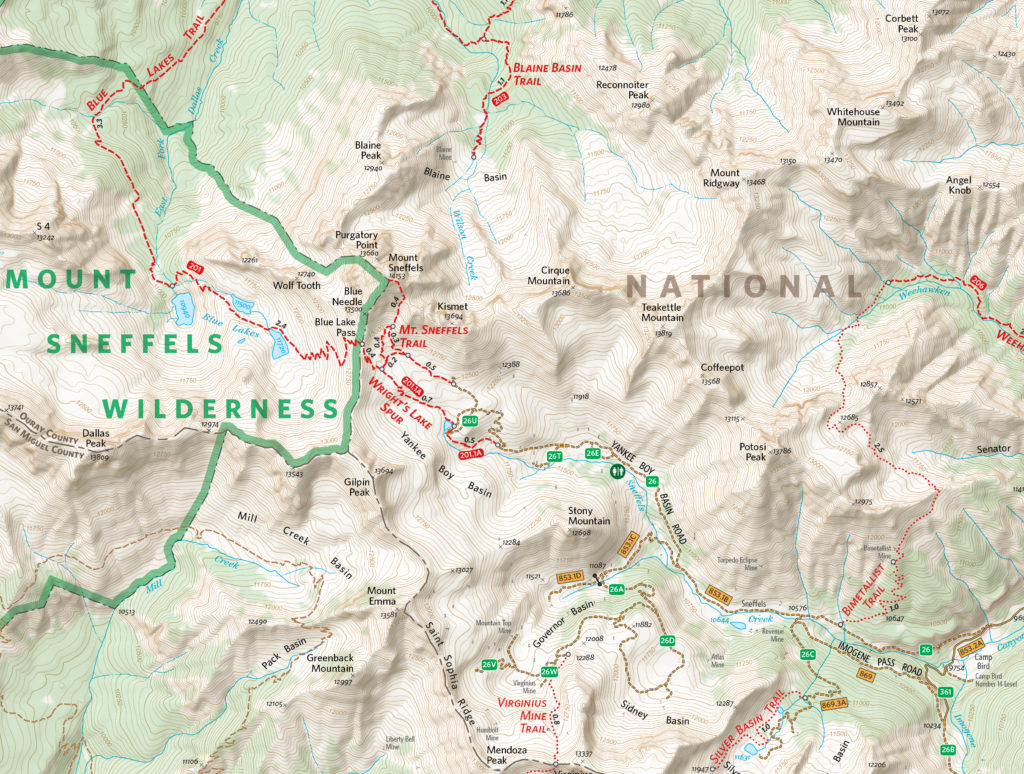
The completed Hiking Trails of Ouray County and the Uncompahgre Wilderness map is available in printed form, and users can also purchase digital forms of that map and the new Ouray Perimeter Trail Map in the Avenza Map Store. The digital maps are fully geo-enabled and support offline use for navigation and GPS-location on mobile devices using the Avenza Maps app.
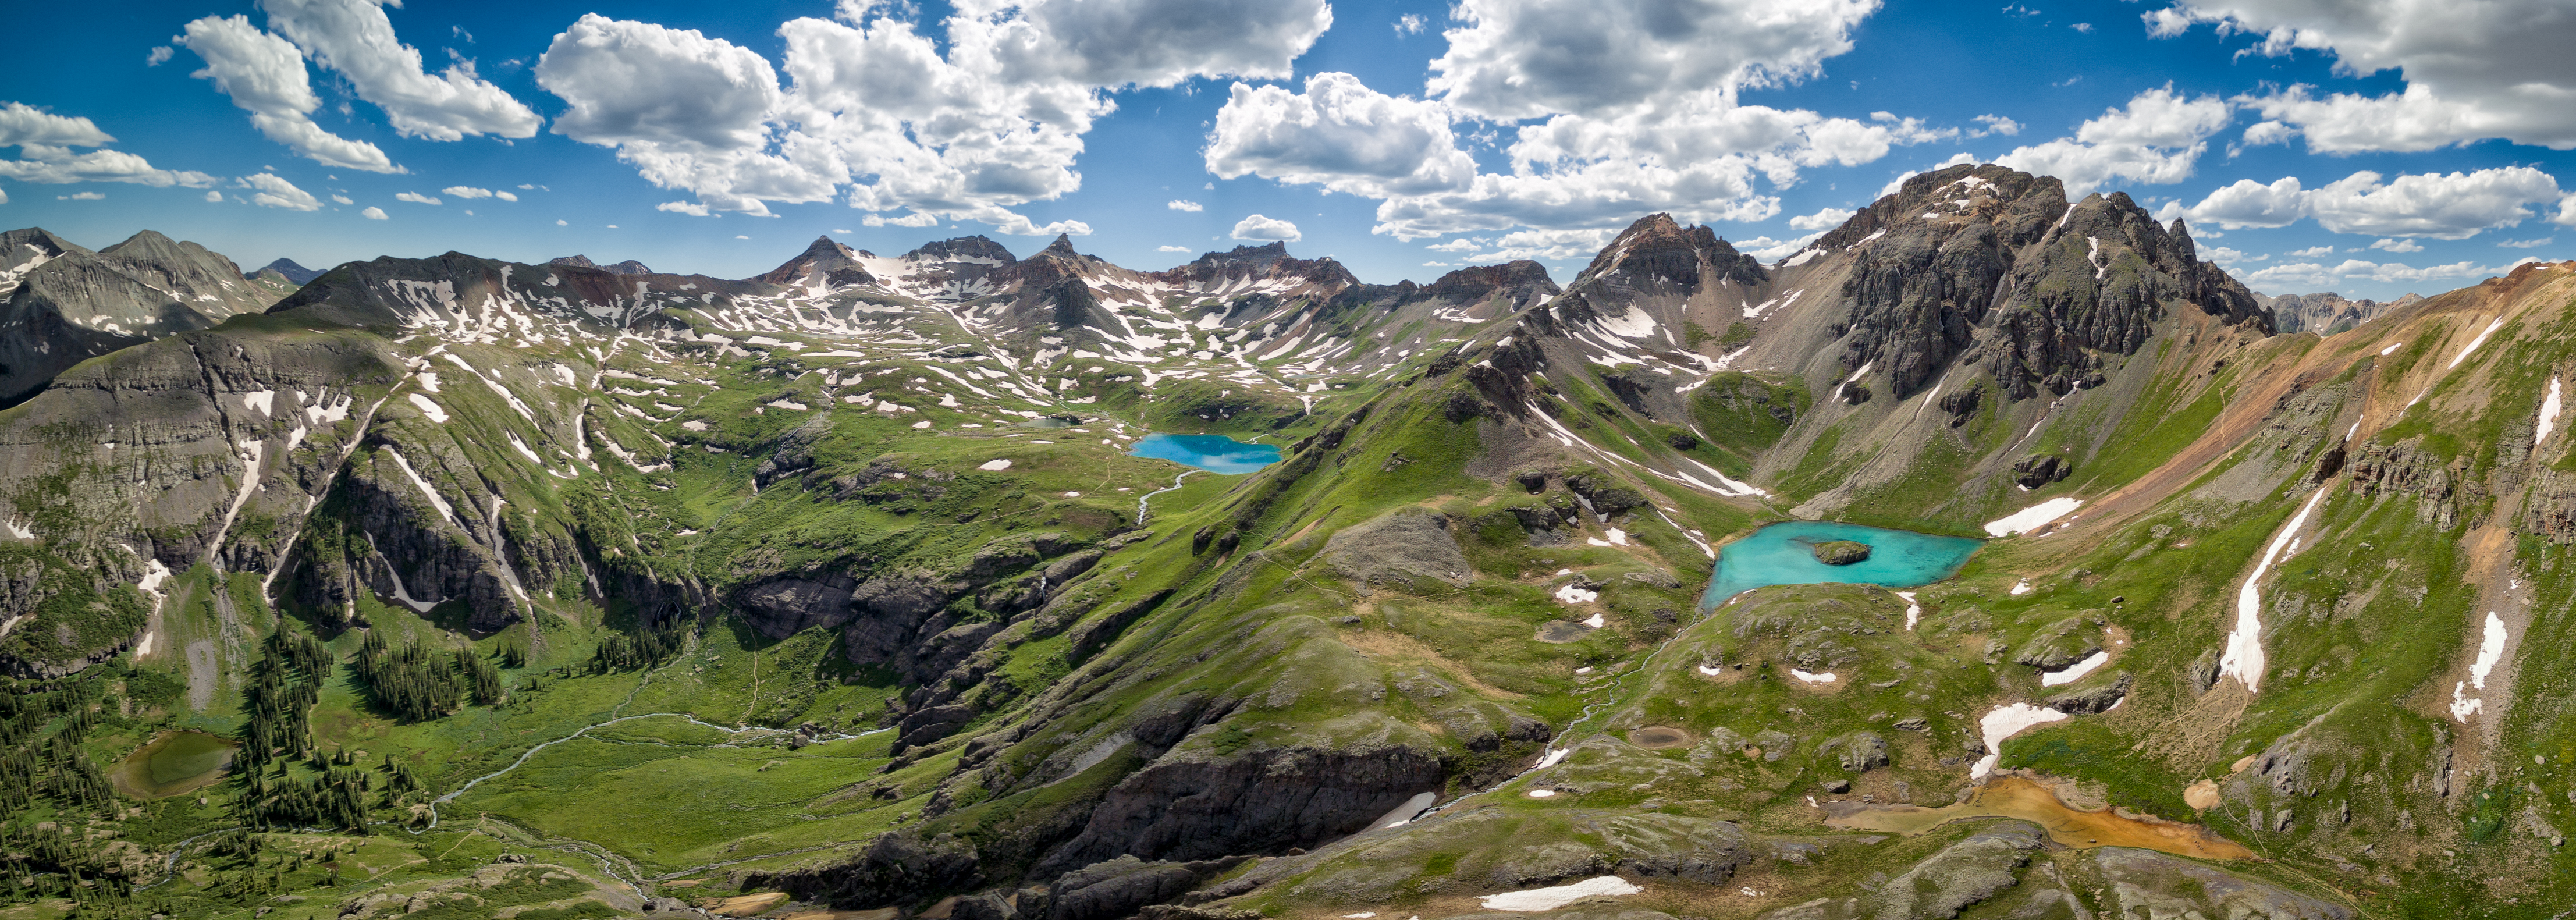
Mike Boruta still lives in his beloved town of Ouray. He spends his free time enjoying the trails and mountains which he has helped to map. He continues his work for National Geographic and has branched out his interests to include drone photography and videography. He operates the website OuraybyFlight.com, which showcases some of his spectacular drone photography work. His dream is to combine these dramatic landscape panoramas with overlaid symbols and text to create those iconic “birdseye” mountain maps that inspired him years ago.
“I envision something that would hopefully be more aesthetically pleasing, something that aims to capture the soul of these San Juan Mountains while also illustrating the geography. And just maybe it might also be something pretty enough to hang on the wall.”
We’re excited to announce that we’ve released MAPublisher 10 for Adobe Illustrator. The MAPublisher product team has been working closely with our customers to build more useful features, tools, and to improve the look and feel.
MAPublisher 10
This update contains new features and performance improvements as well as fixes for reported bugs. Some highlights are mentioned below, for the full release notes see below.
Adobe Illustrator Creative Cloud 2018 support. We are fully committed to providing the best map design tools seamlessly built into Adobe Illustrator. We have improved our user interface (panels, tools, buttons) to support high-resolution monitors. This release is fully compatible with the latest Adobe Illustrator CC 2018 on both Windows (32-bit and 64-bit) and Mac.
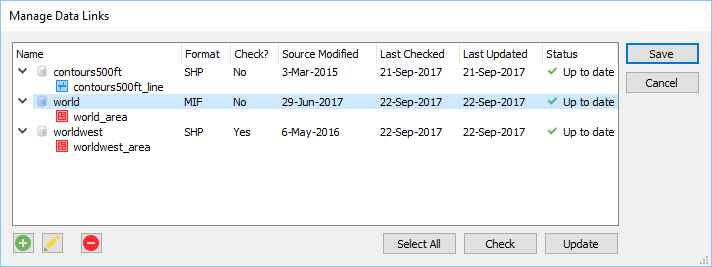
Manage Data Links. This feature has long been requested by our customers. You now have the ability to create and manage data links for MAPublisher documents. MAP layers in a document can be updated when its source data has been modified. Data links are checked automatically every time a document is opened and will display the status of affected layers in the MAP Views panel. This allows you to keep track of data that may have been moved or modified. When a data source is missing, a notification will alert you in both the Edit Data Link dialog box and MAP View panel. Note that only the link is dynamic and not the actual map features, meaning that manipulating your features in the document does not directly affect the source data. You will need to export your data if you want to overwrite your source data.
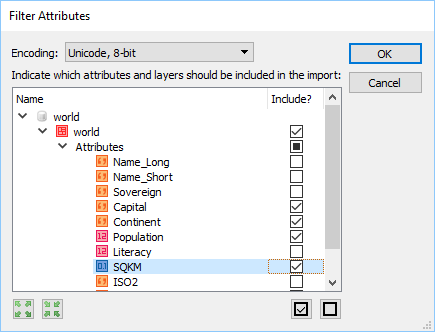
Filter attributes and filter geometry on import. A common workflow our customers encounter is trying to reduce the amount of data being imported. Often times, a dataset covers a much larger area or has too many attributes included. There is now a way to streamline import so that it’s not only quicker to import, but also results in improved Adobe Illustrator performance due to the reduction in the number of map features on the artboard. The new attribute filter helps you select which layer attributes (or layers) to include or not include prior to import. The new geometry filter provides several options (including an interactive map) to help you select which area to include or not include prior to import.
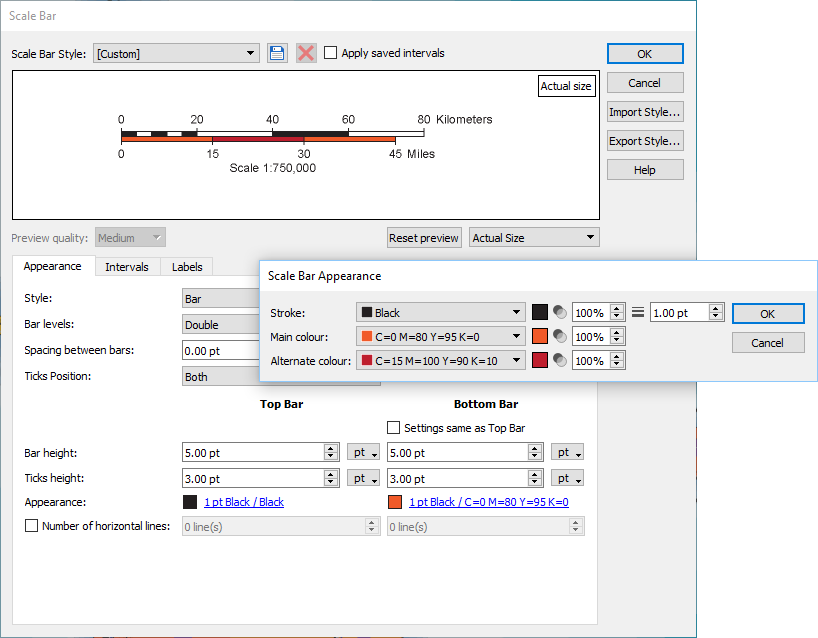
Redesigned Scale Bar tool. We’ve worked a lot with our customers to redesign the scale bar tool. In addition to new customization options, new scale bar styles were generated with the help of the US National Park Service, Harpers Ferry Center. You also now have the ability to save, import, and export scale bar styles, making it easier to share defined styles with others.
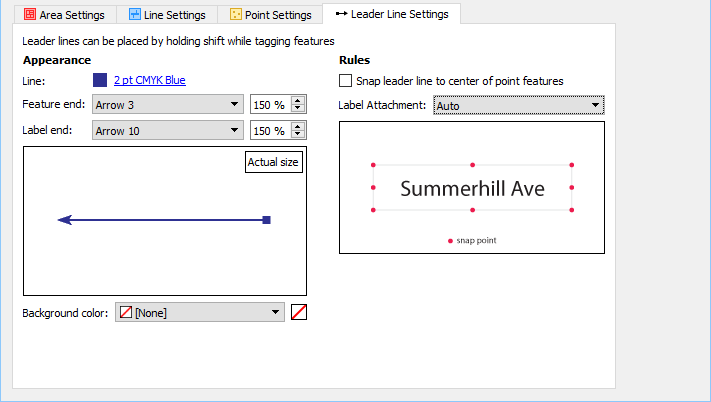
Improved MAP Tagger Tool. You now have the ability to create custom leader lines with various arrow styles and option to snap leader line to different positions around a label. This provides a new level of customization and efficiency without having to style leader lines afterwards.
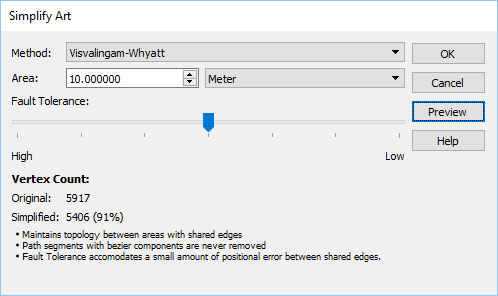
New Simplify Art simplification method. A new Visvalingam-Whyatt simplification method and fault tolerance setting to accommodate positional error between shared edges in the topology. The Visvalingam-Whyatt method is an area based algorithm which eliminates points based on their effective area. By iterating through points of lines and areas, it calculates and removes the point with the least effective area.
MAPublisher 10 Release Notes
Fully compatible with the latest Adobe Illustrator CC 2018 on both Windows (32-bit and 64-bit) and Mac
New ability to create and manage data links for MAPublisher documents. MAP layers in a document can be updated when its source data has been modified.
New attribute filter capability to select which layers and attributes to include or exclude prior to import
New geometry filter capability to select which features to include or exclude prior to import
New scale bar styles and customization options including ability to save, import, and export scale bar styles
New Visvalingam-Whyatt simplification method and fault tolerance settings to simplify art
New MAP Tagger Tool ability to create custom leader lines with various arrow styles and an option to snap leader line to different positions around a label
A new Point Utilities action that can rotate points to the angle of latitude
A modified Text Utilities action that can draw a point for text based upon text alignment for indexing purposes
New settings for North Arrow location including True North and a custom coordinate and options to use Great Circle or compass method
New MAP Web Author HTML5 export customization options including adjustable scale bar
A number of user interface and usability enhancements.
This post was contributed by Hans van der Maarel of Red Geographics.
The problem with using GIS data for point symbols is that depending on the scale and symbolization you often end up with symbols partly overlapping each other. Of course, the symbols can be manually moved around after initial placement to get a more aesthetically pleasing result, but that can be a tedious and time-intensive task.
Thankfully, there is a way to automate at least part of this process by using MAPublisher and LabelPro.
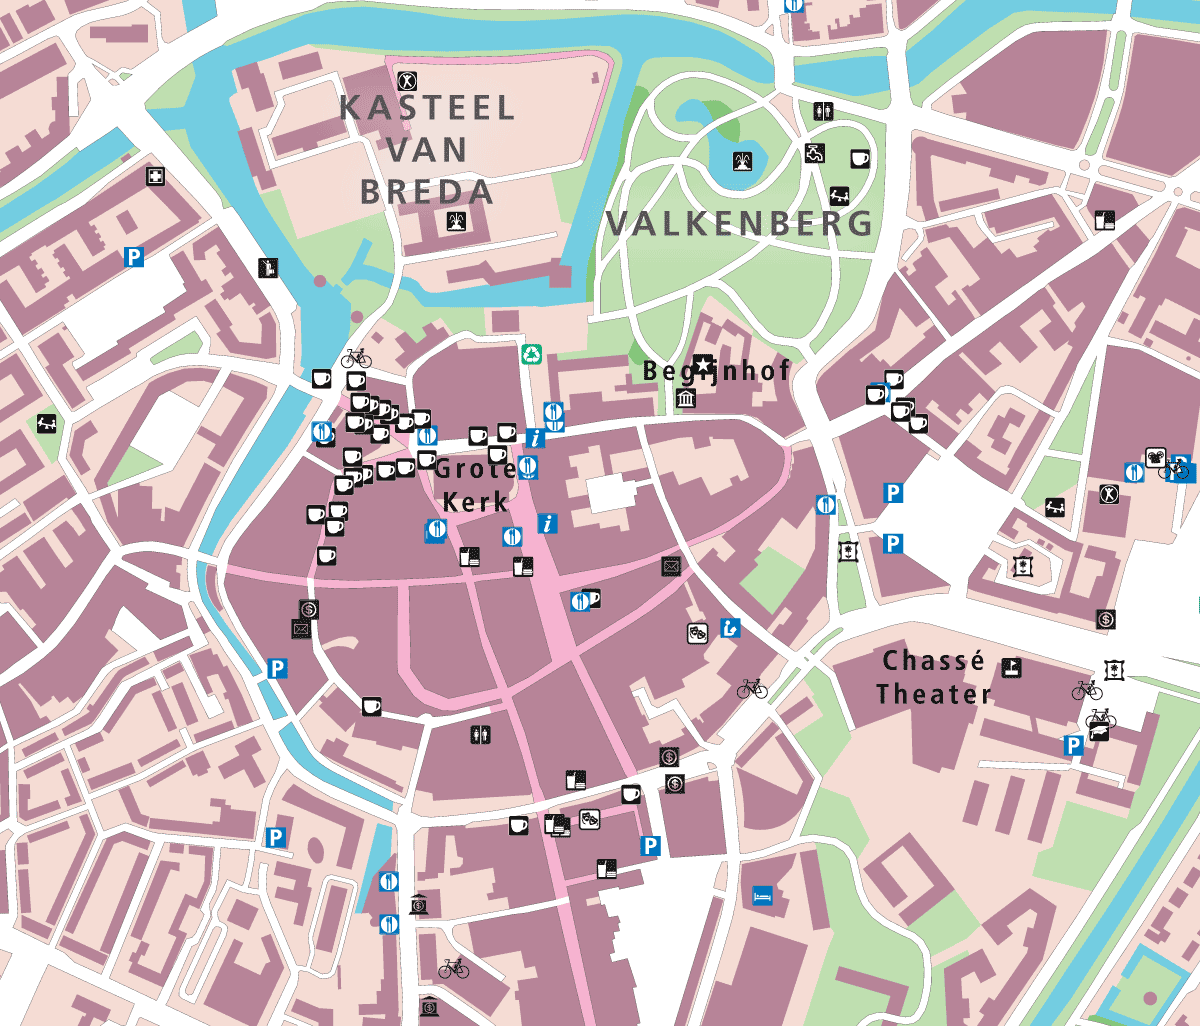
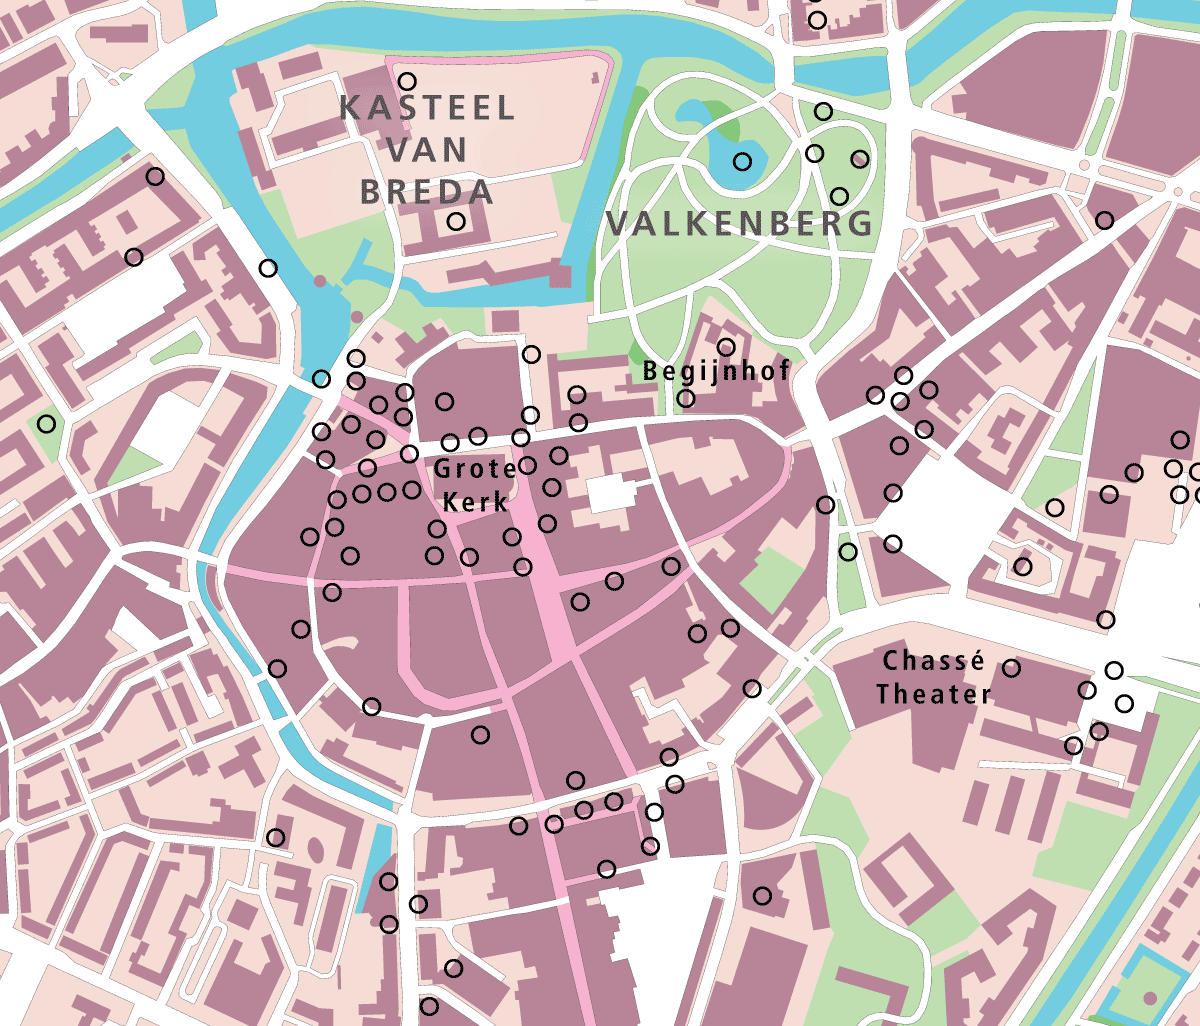
Example map of Breda, The Netherlands
This example shows the heart of an old European city (Breda in The Netherlands to be exact). The map is composed of Dutch Top10NL topographic base data, a few labels were manually added for larger features (such as the park), and points imported from OpenStreetMap (OSM) and styled using a Map Theme. As you can see, there are a number of spots where the symbols are densely located and overlap each other.
The MAPublisher LabelPro add-on is capable of collision-avoidance to make sure overlaps don’t happen. But it only works when generating labels (text). Fortunately, the solution is to trick LabelPro into processing symbols too, so that they can benefit from better placement without overlaps.
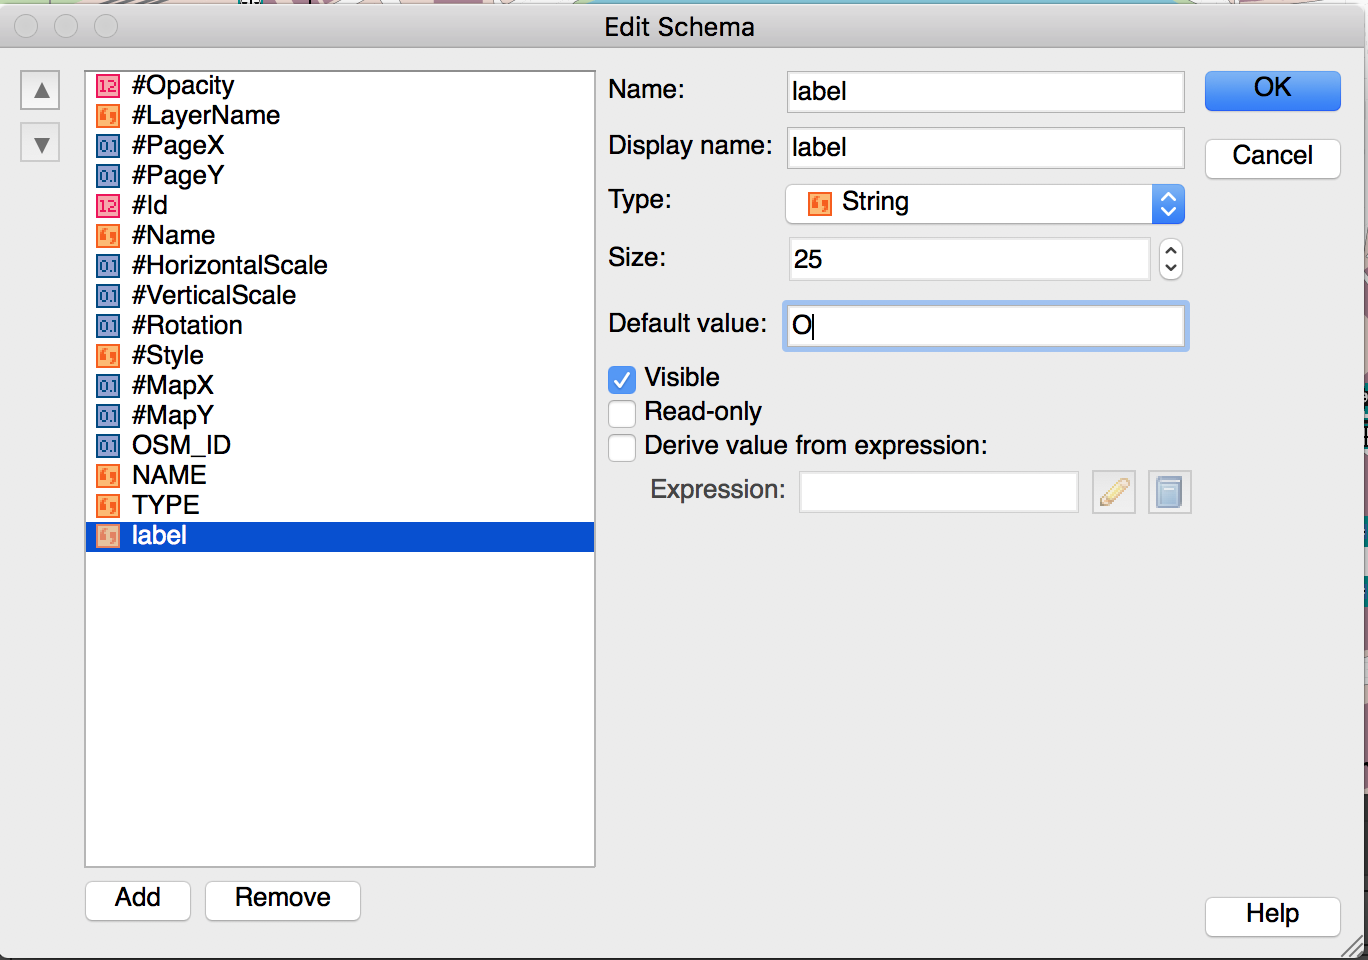
Let’s start by adding a column to the attributes to the OSM points layer and filling it with a default value, a capital O.
Thankfully, there is a way to automate at least part of this process by using MAPublisher and LabelPro.
Editing the attribute schema
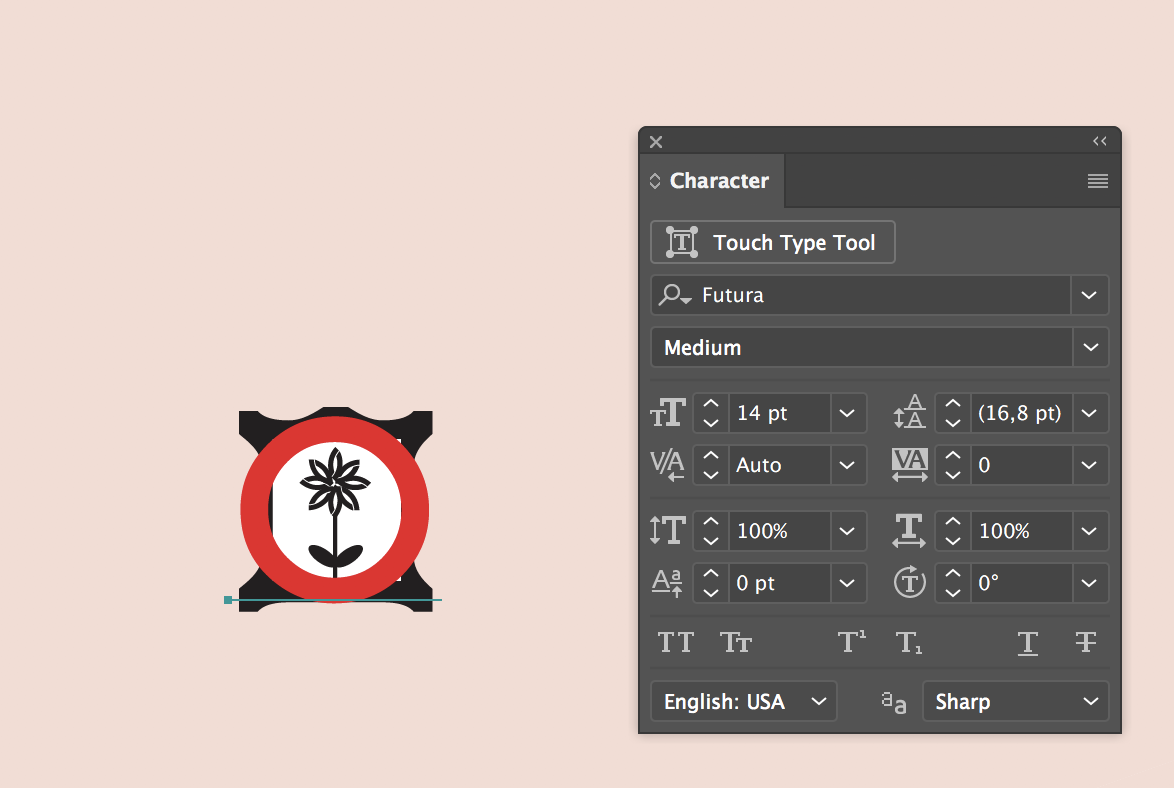
Next, determine how big the symbols are. On the artboard, use the Type tool to place a capital O and adjust its size so that it’s about the same size as one of the point symbols. In this case, a 14 pt Futura Medium, shown here in red, seems to cover it well (your results might be different).
Determine the approximate font size
Futura is a good font in this case because the O is a perfect circle. Once you’ve determined the approximate font size to use, delete the O text as it won’t be needed anymore.
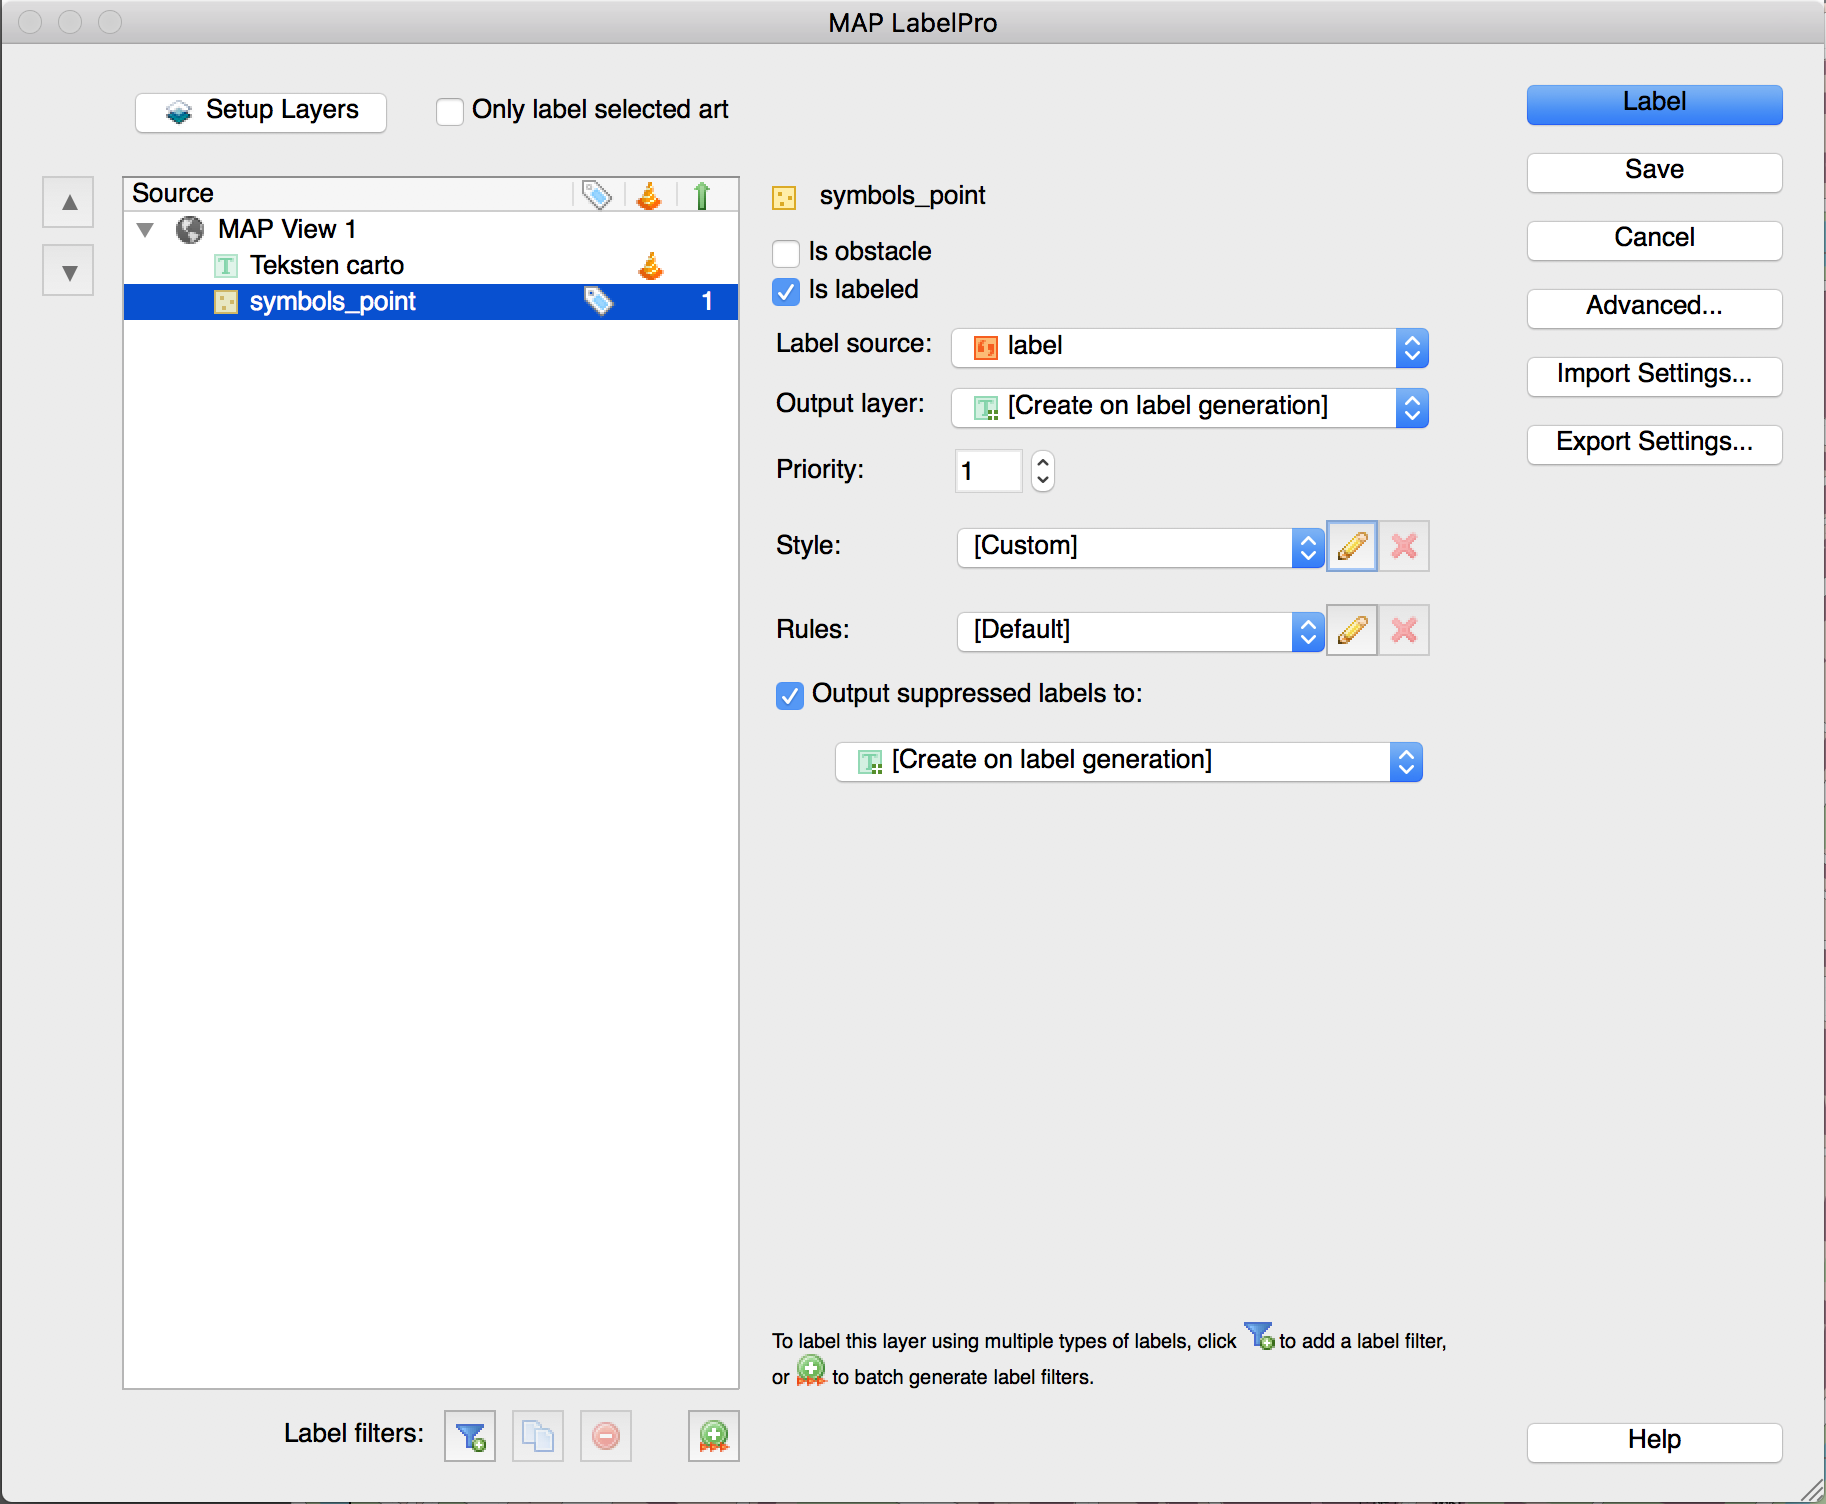
Next, set up the LabelPro labelling rules. Since there is already a layer with the manually placed labels and the symbols shouldn’t interfere with them, the manually placed labels will be designated as an obstacle layer. The symbols layer will be labelled with the attribute created earlier and the style set to the font and size that was just determined.
Set obstacle layer
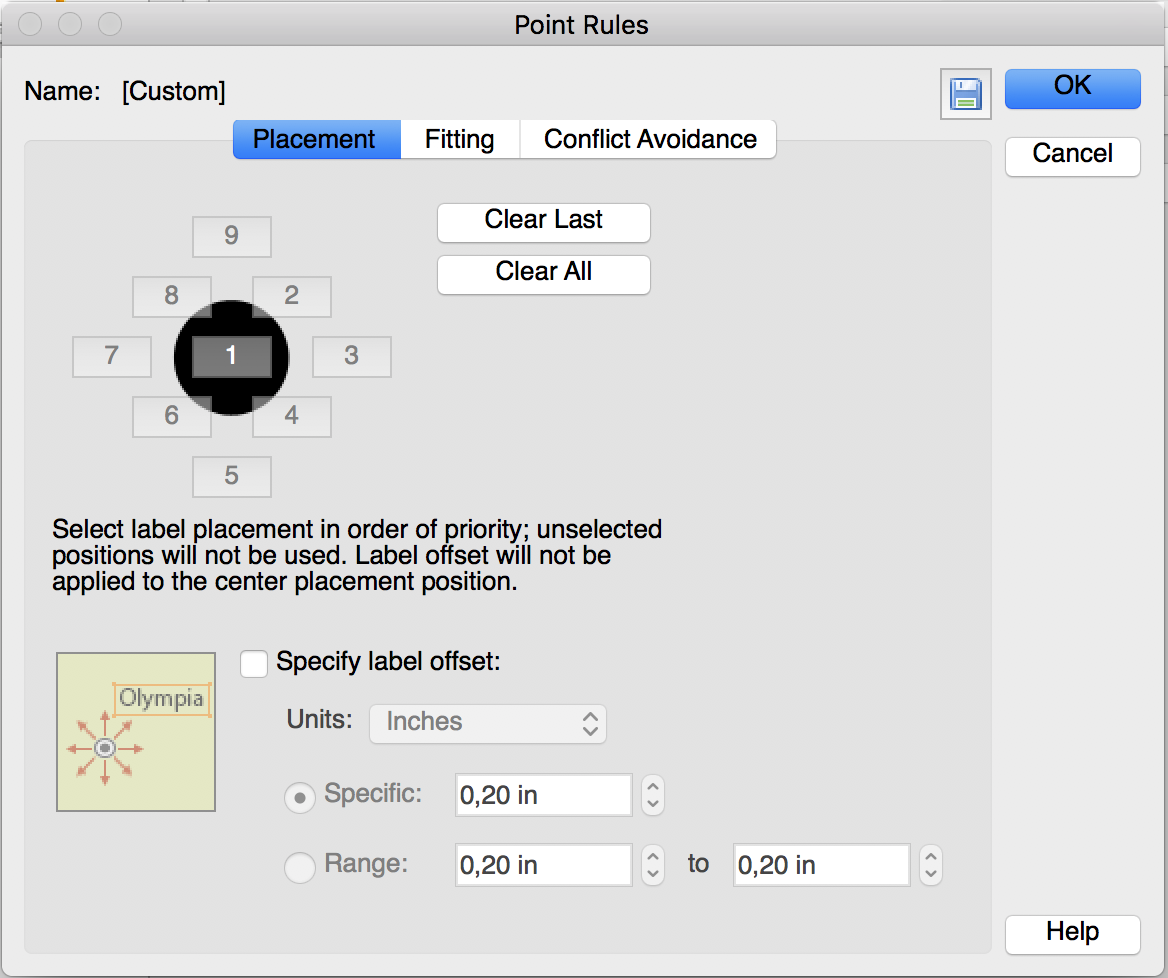
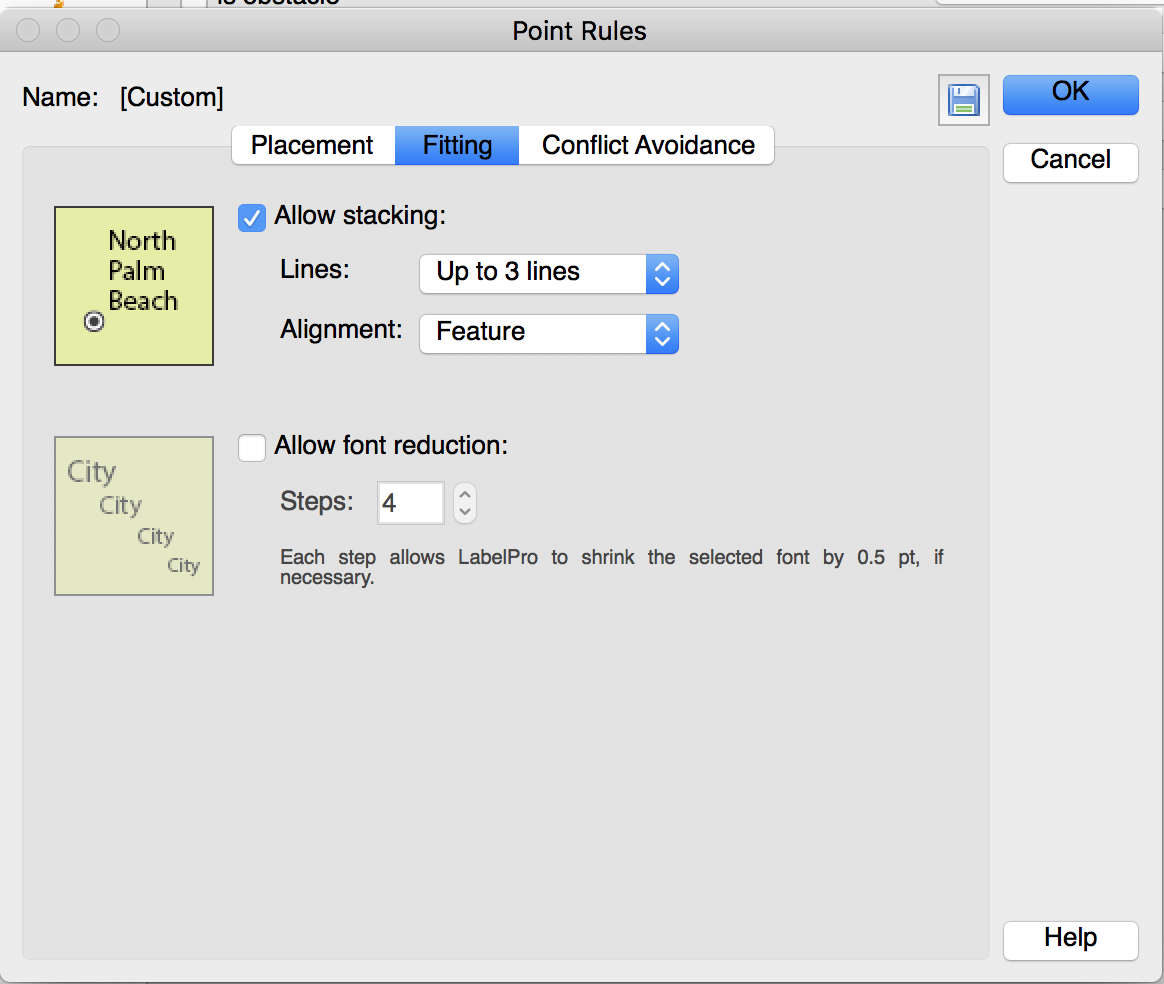
Setting the appropriate rules partly depends on personal preference but it’s important to specify that the placement prefers the center position (position 1 on the placement control). In other words: if there’s enough space for placement, the label doesn’t need to be moved or offset. Another important rule to configure is that font reduction should be turned off. All of the labels (eventually symbols) are going to be a fixed and similar size.
Set placement point rulesSet fitting point rules
Also, another good practice is to specify a suppression layer. Any labels that can’t be placed with the rules set will be placed on the suppression layer. After placement, you can determine if any labels need to be adjusted manually.
Let’s label! Go ahead and label with these settings and afterward hide the original symbols layer and the suppression layer. The map is filled with O’s where the original symbols are located.
O labels placed
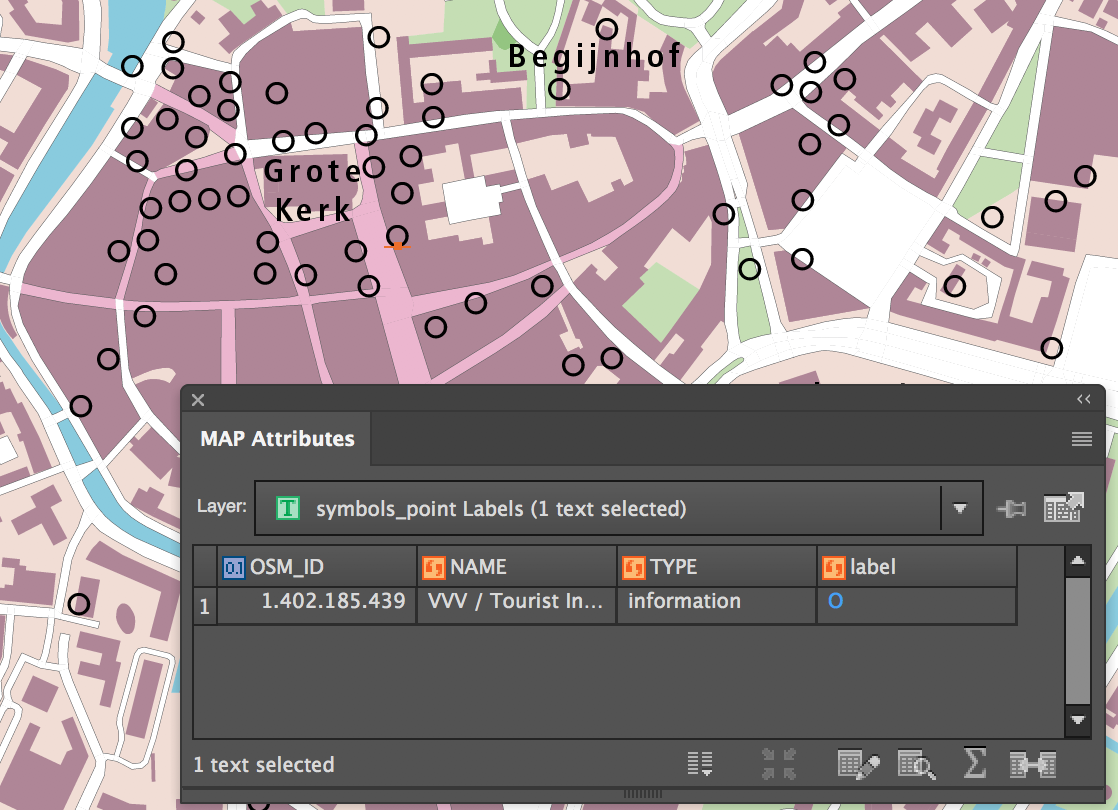
At first glance, this does not seem very useful, but closer inspection shows that the labels have retained the attributes of the original OSM point symbols.
Attributes migrated to the O labels
This means that if they can be turned back into points, they will be able to be styled!
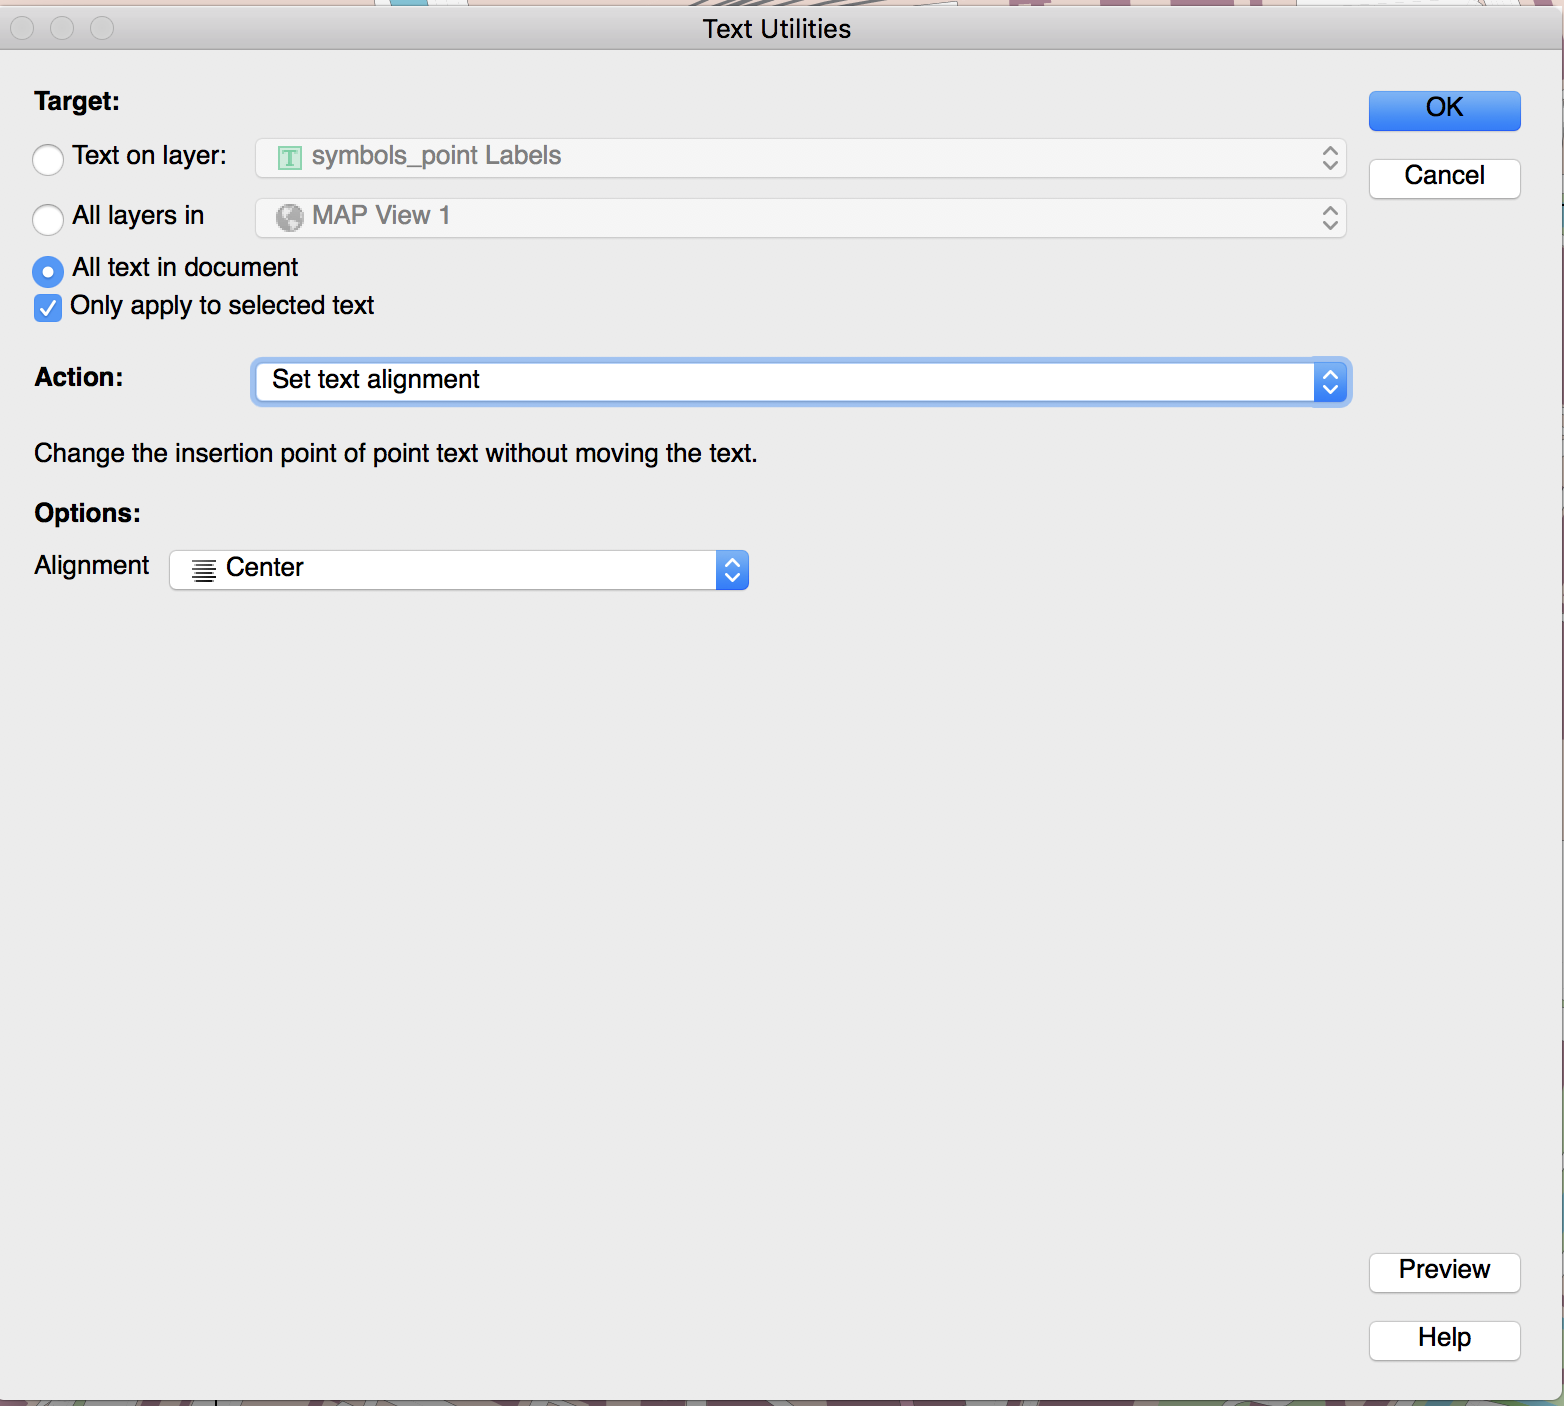
In order to turn them back into points, a text reference point needs to be created. In other words: a little dot on the text selection line, in the center of the O. This is a two-step process. First, select all the O’s on the artboard, open MAPublisher Text Utilities, and set the Action to Set text alignment and Alignment to Center. This action changes the alignment of the text without changing the actual position of the text (due to LabelPro labeling the text alignment is different based on where the label ended up in relation to the original point). This step takes care of the horizontal positioning.
Set text alignment in MAPublisher Text Utilities
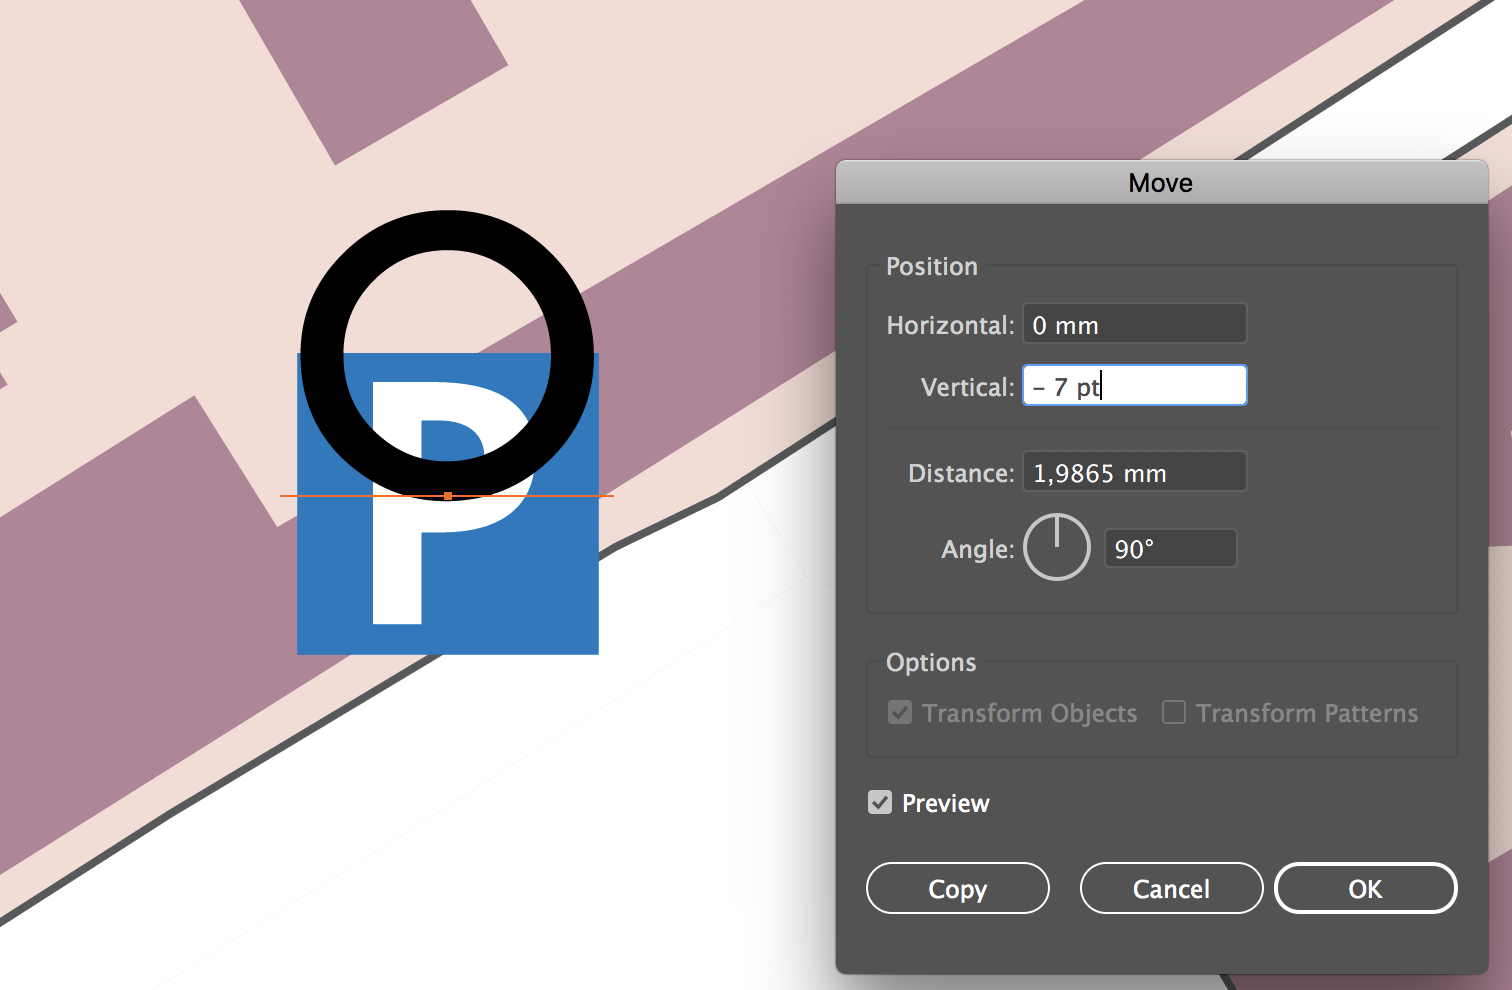
The second step is to adjust vertical positioning. Vertical positioning is adjusted by moving all text up by a certain distance. Make sure all the O’s are selected, then use the (Adobe Illustrator) Move tool. In the Position group, set the Horizontal to 0 (no adjustment here since Text Utilities was used), set the Vertical to minus half the text size (font size in this example was 14 pt, so a vertical adjustment of -7 pt), and the Angle to 90 degrees.
Use the Move panel to fine tune position
For reference, this example is zoomed into a symbol that did not get displaced.
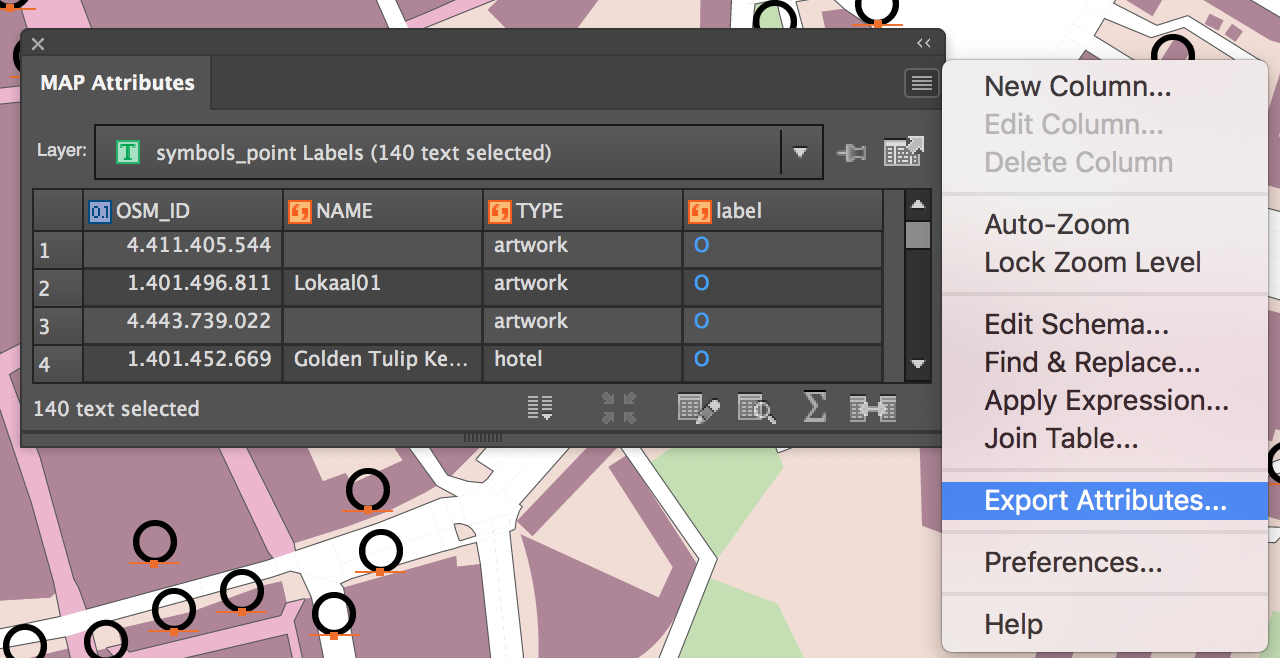
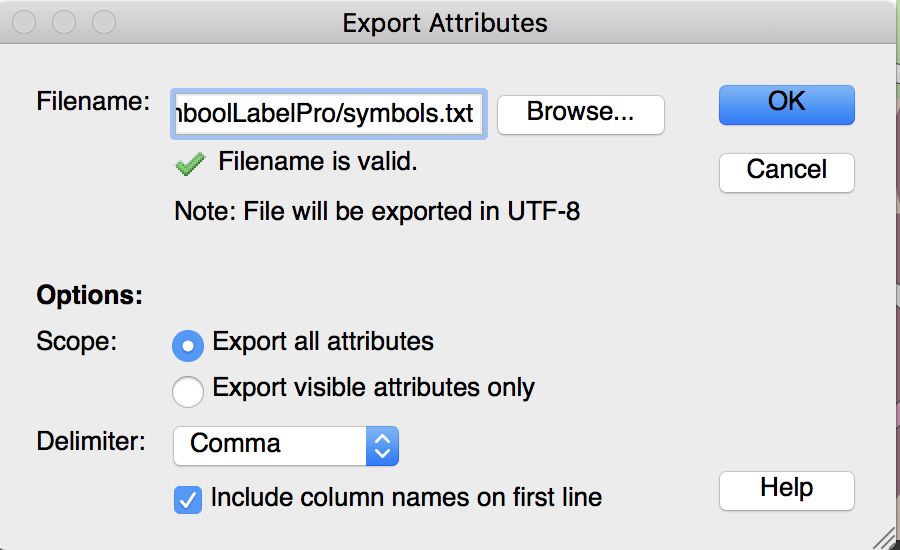
Next, these labels need to be turned into point symbols. There is a handy option in MAPublisher Text Utilities that can do that, but it places a point to the lower left of the text and the symbols need to use the center text reference point that was just created. Instead, with all of the O labels selected, open the MAP Attributes panel and export the attribute table to a text file. Make sure to specify the option Export All Attributes because there are two important hidden attributes needed to make this work: #MapX and #MapY, which are the coordinates of the text reference point.
Export attributes to a .txt file (Click for larger version)Export attributes to a .txt file
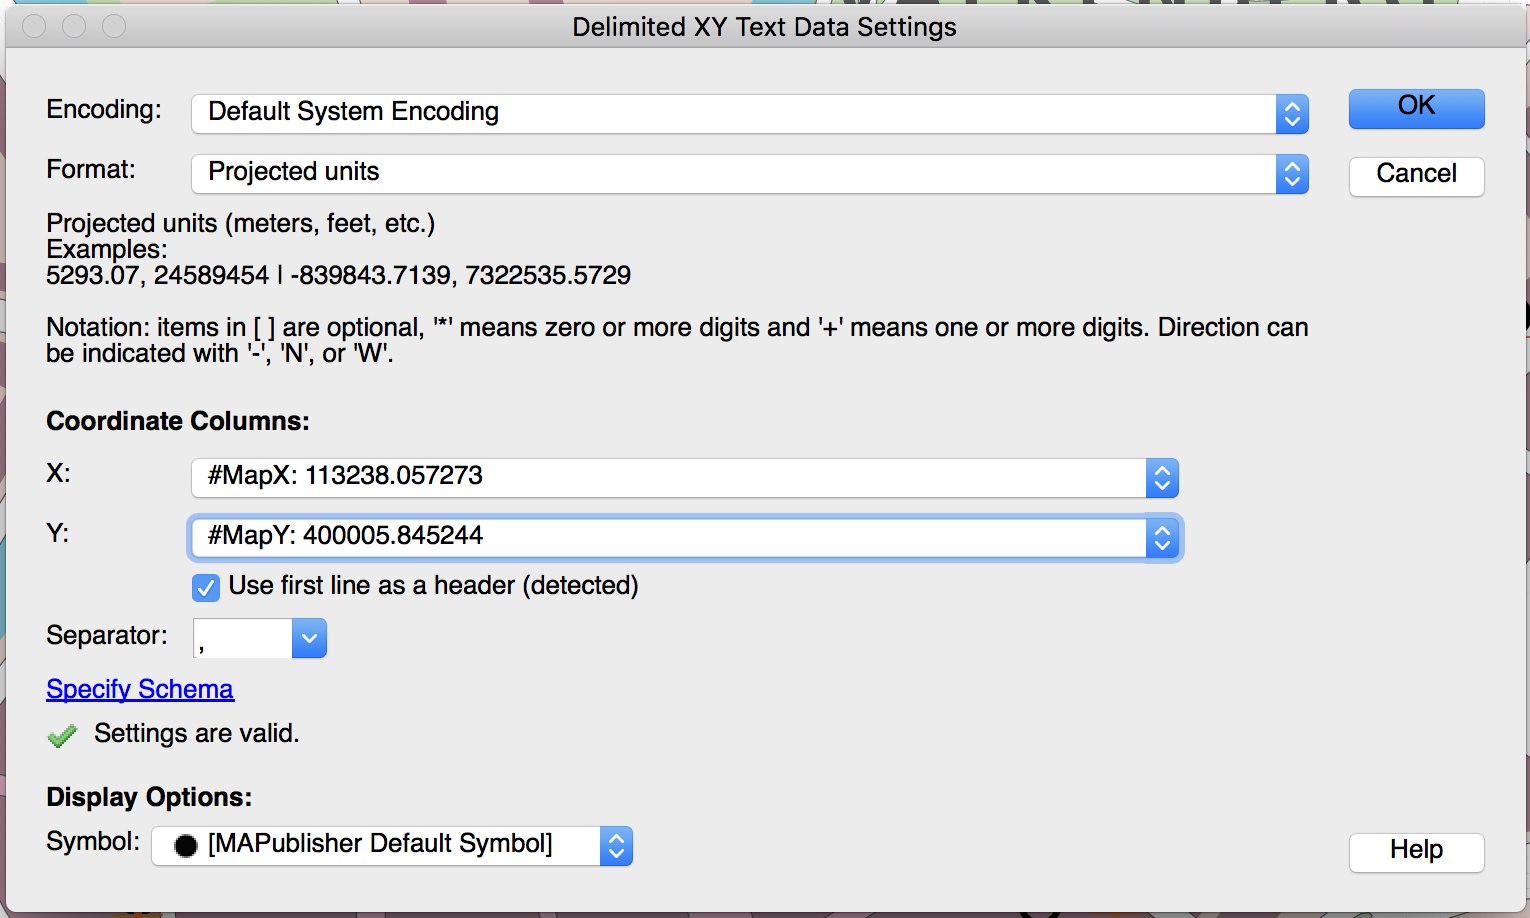
Using MAPublisher Import, add the attributes text file that was just created to the map and make sure to appropriately specify #MapX and #MapY in the X and Y coordinate columns.
Import .txt file as Delimited XY
Since there is no projection information stored in the text file, you’ll need to specify that the coordinates are in the same system as the MAP View it’s coming from and you’ll need to add it to that MAP View upon import.
On the map, there is now a new point layer and because they still have all of their original attributes, the layer can simply be added to the MAP Theme to have all the point symbols reapplied to them instantly. Let’s admire the results:
Symbols reapplied with MAP Themes
If needed, repeat the last few steps for the suppressed labels as well (to a different file and different layer of course) to see what still needs to be done manually.