
Last year we wrote a blog post about some of our team’s favourite MAPublisher features. Not surprisingly for software that has been around for over 20 years, everyone had a different favourite and we had to be selective for the blog post. This year, with new team members coming on board and new MAPublisher releases it’s a good time for a new list of favourites. Check out some of these features that you might not know about, and find out how they can make your workflow easier!
Create Elevation Plot
Jeff C. – Quality Assurance
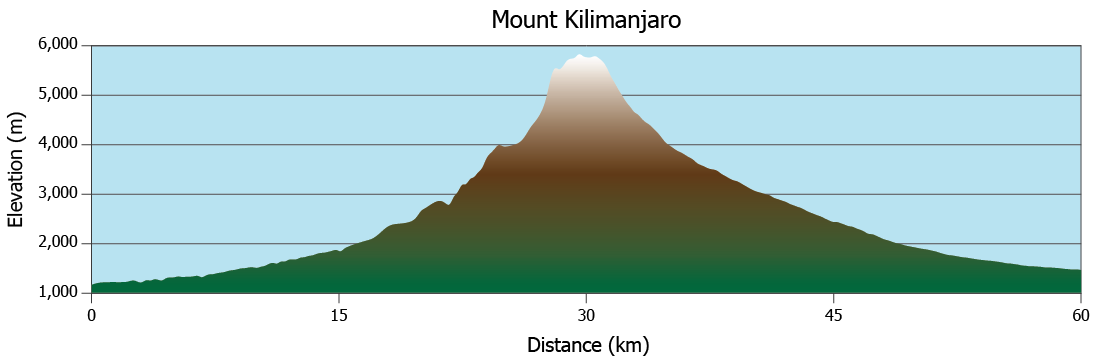
Prior to MAPublisher 10.3, “Create Elevation Plot” was a feature of Path Utilities I seldom used because, to be honest, it had a few limitations. MAPublisher 10.3 introduced a completely new way of creating elevation profiles, and the difference is astounding. The available customization options are endless – not only can you select whether your axes will use metric or imperial units, but you can also set the Line Colour, Line Width, Fill Colour, Background Colour, Axis Intervals, Axis Labels, Graph Size and much more. Another aspect of this updated tool that I love is the ability to save and re-use ‘styles’. These styles remember specific elements of an elevation profile (e.g. appearance, units, size, etc.) and can be applied to other profiles made in the future, saving the user a lot of time.
Text Utilities
Keith S.- Quality Assurance
In my opinion, the Text Utilities tool is one that is underutilized in MAPublisher. The tool allows you to perform actions on text within a document, including Curve Text to Latitude, Draw Shape Around Text, Merge Text, Create Line From Text on a Path, and many more. The actions can be performed on selected text only, text on specific layers, or all text in the document. The tool even allows the user to preview most actions before committing the changes.
If you have ever seen text along a path with a red plus symbol at the end of it after performing a transformation or manual adjustment it is an indication that the text path is not long enough to contain all of the text. No problem for my favourite action in the Text Utilities tool—Extend Overflowing Text. This utility solves the issue by extending the text path to a length which will accommodate the full length of the text.
Join Lines
Oliver N. – Customer Support
One of my favourite tools to use in MAPublisher is the Join Lines tool. If you are working with a road or rail network and sections of the same track or street connect to each other but are broken into different line features, you can easily join them into single features with a common attribute like Street Name or Track Number. You can target a line layer and then in the Destination options, choose either to perform the join on the original target layer or specify a name for a new line layer that will contain the joined lines. You can also use a proximity value to determine how close the lines must be in order to be joined. I find that this tool allows subsequent styling to be done easily and saves a lot of time in arranging the data to your needs. It also reduces the size of your file by compiling data into fewer features.
Copy MAP Objects From
Keith S. – Quality Assurance
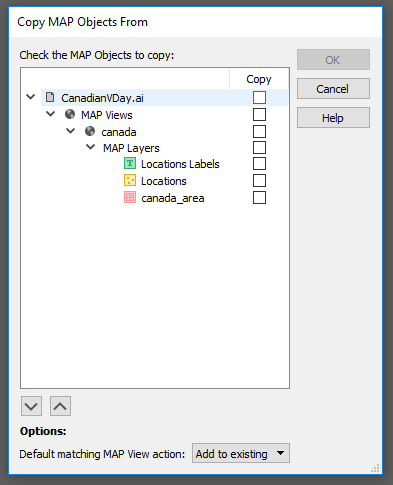
This feature allows users to copy MAP objects (including MAP Views, MAP Layers, MAP Themes, MAP Selections, and MAP Locations) from one open document to another. MAP Views can be copied by themselves or with their associated MAP Layers. The best part is, that any artwork which is copied to the destination document will retain its styling provided that the custom colour swatches used in copied artwork are set as “Global” in the Adobe Swatch Options dialog. It works like this: With the destination document open, launch the Copy MAP Object From tool. Select the object(s) you want to copy to the destination document by checking the checkbox beside each object, then click “OK” to perform the copy. Copy MAP Objects From is one of my favourite features because it saves so much time when styling maps!
MAP Themes Scaling Charts
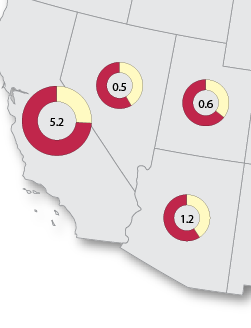
Bob P. – Business Development Associate
My favourite way of making infographic maps is using our MAP Chart themes. Within Chart Themes, you can add a bar or pie chart to any point layer, based on any set of attributes from the point layer. For an added level of information, each of the charts can be scaled based on the value from another attribute. This helps when you want to show the proportion of values, but also give an indication of the total population size for each point too. The best part is MAPublisher allows you to pick between Area and Radial scaling for pie charts. If the population of one point is twice the size of the smallest point, it can either have twice the area, or twice the radius length. This is my favourite tool in MAPublisher, because it shows that our team thinks of everything to make sure cartographers can make the exact map they want, right down to the smallest details.
About the Authors
Jeff, Keith, Bob and Oliver are all members of the Avenza Systems Team and their passion for maps shows through in the work that they do with our clients and in developing MAPublisher.