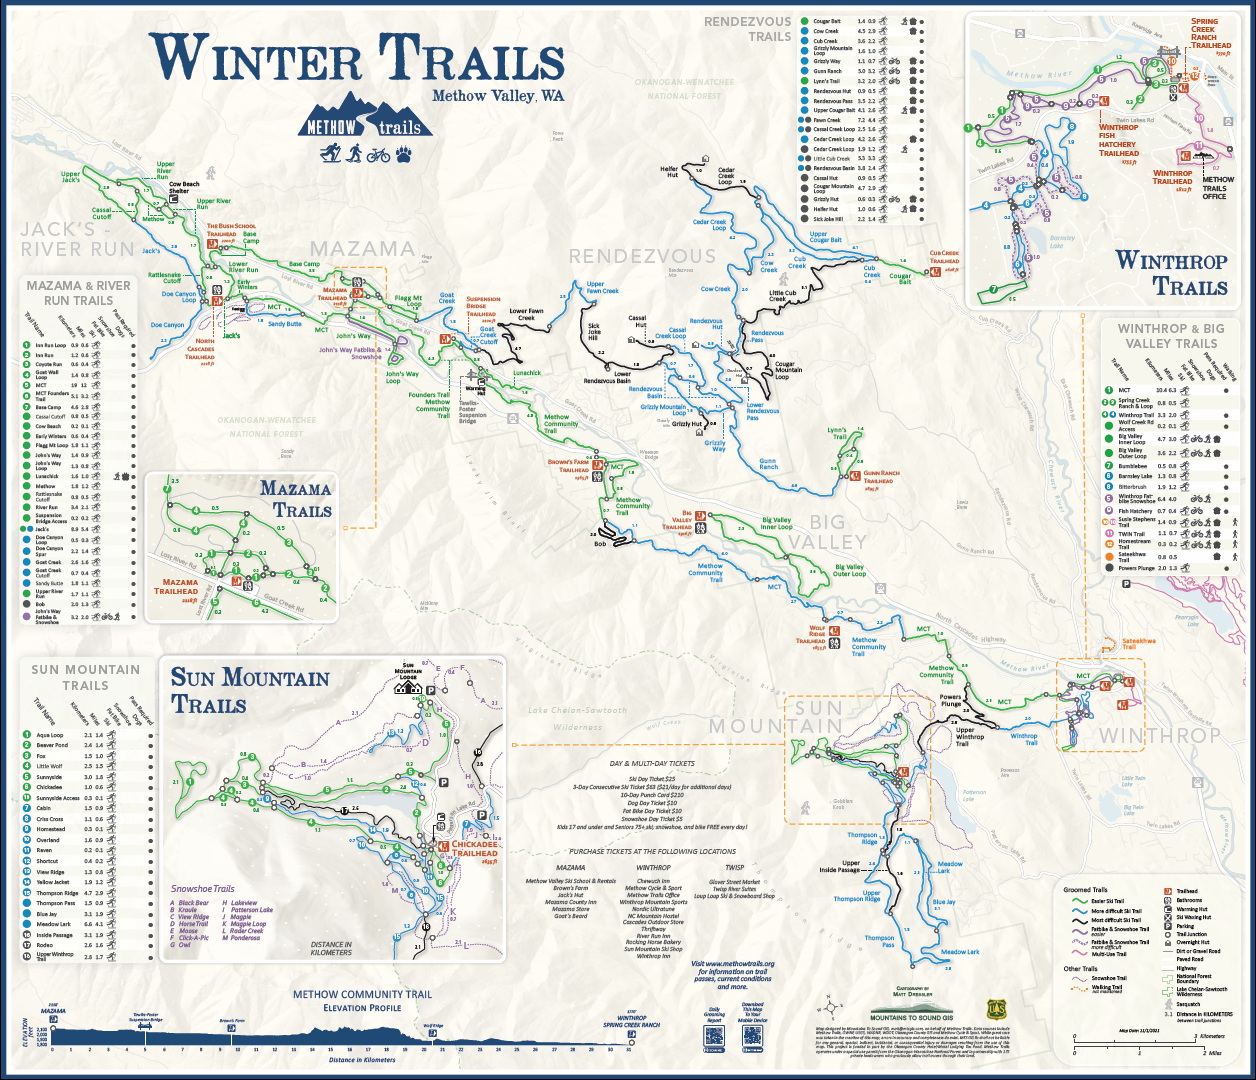
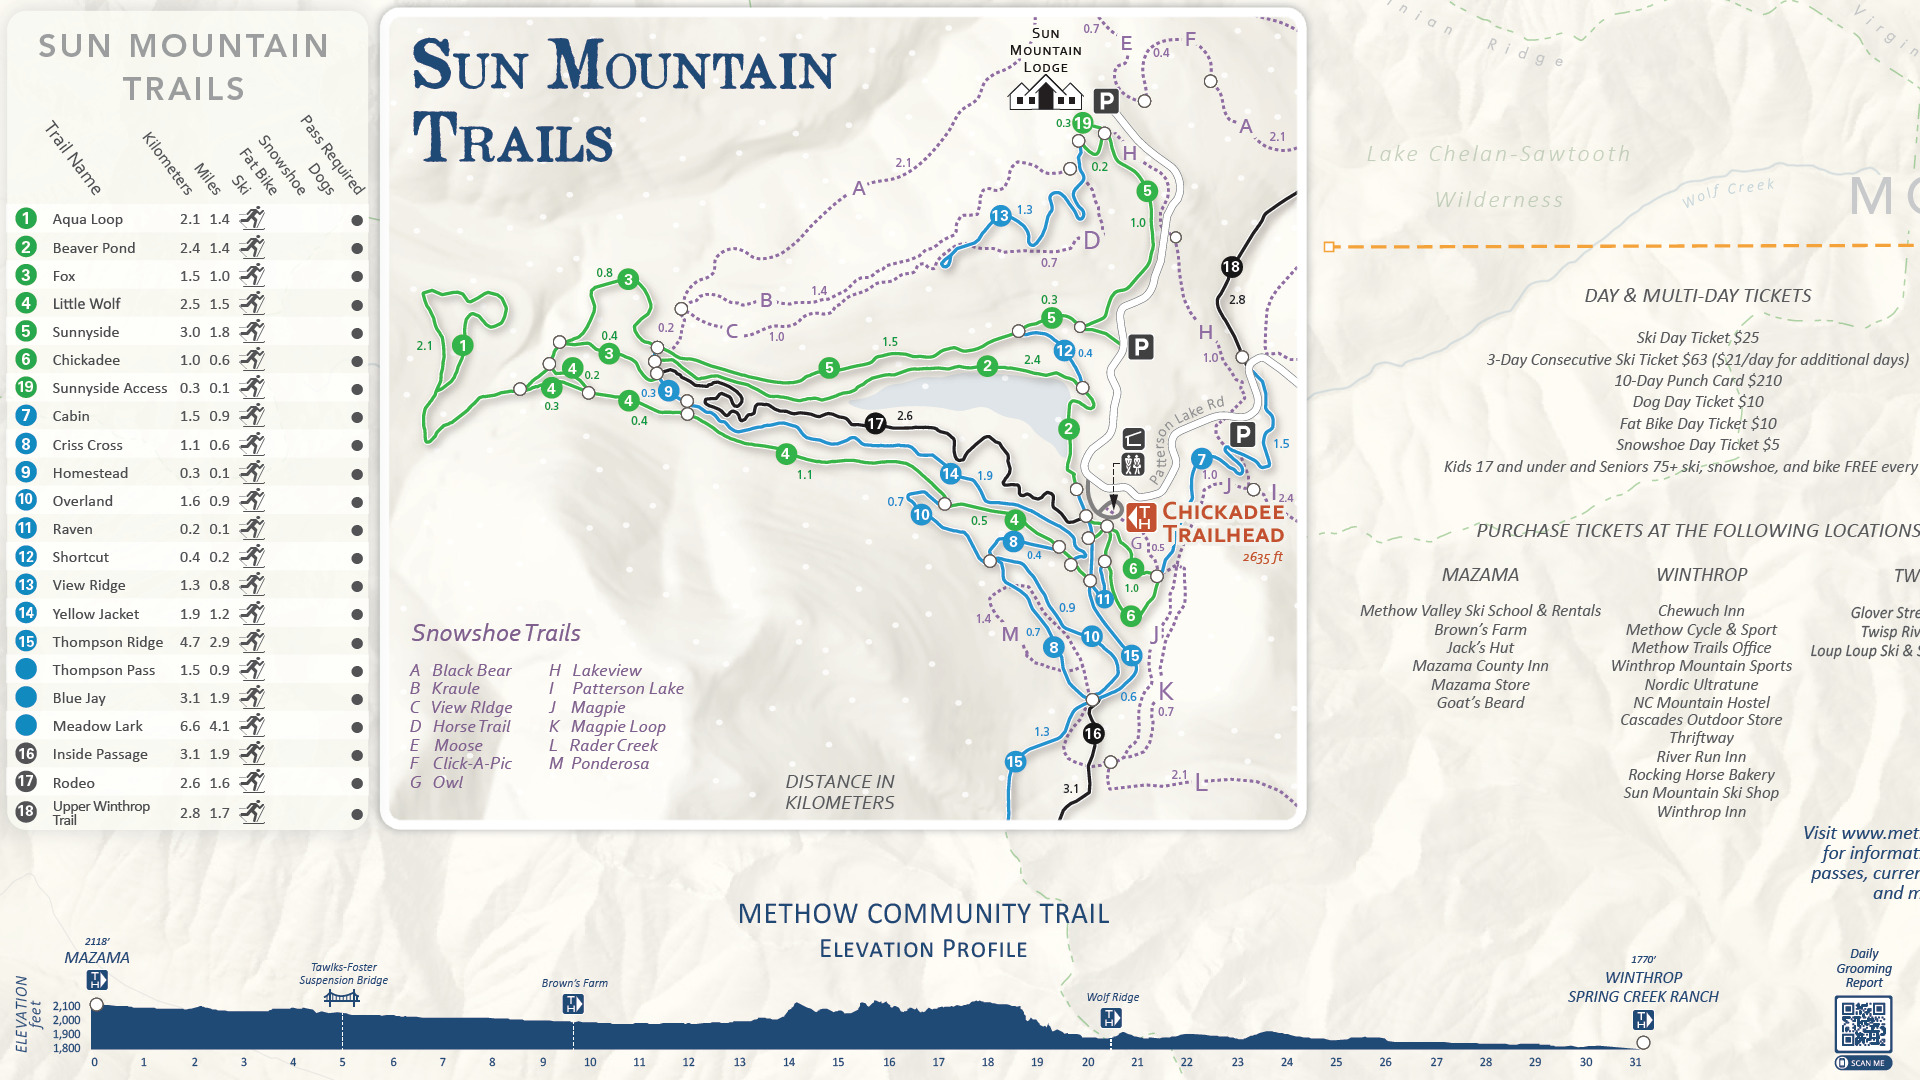
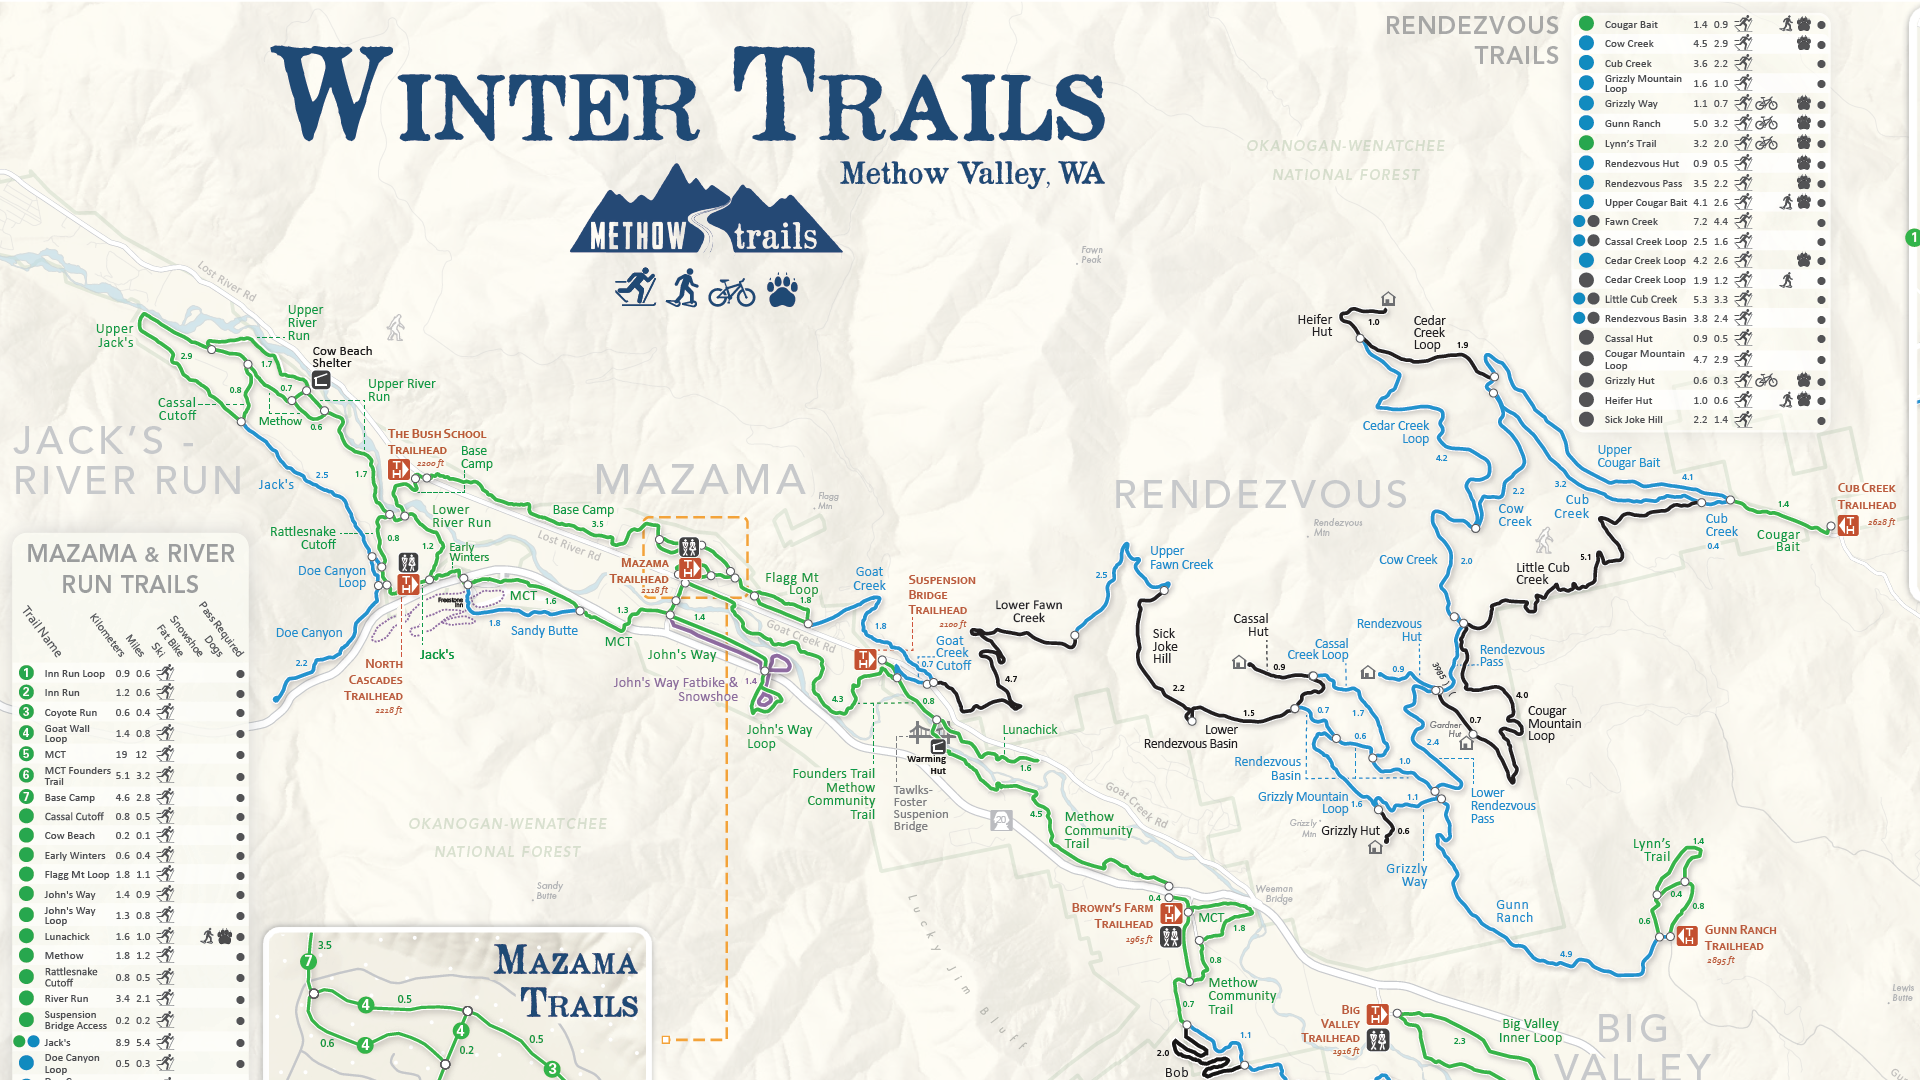
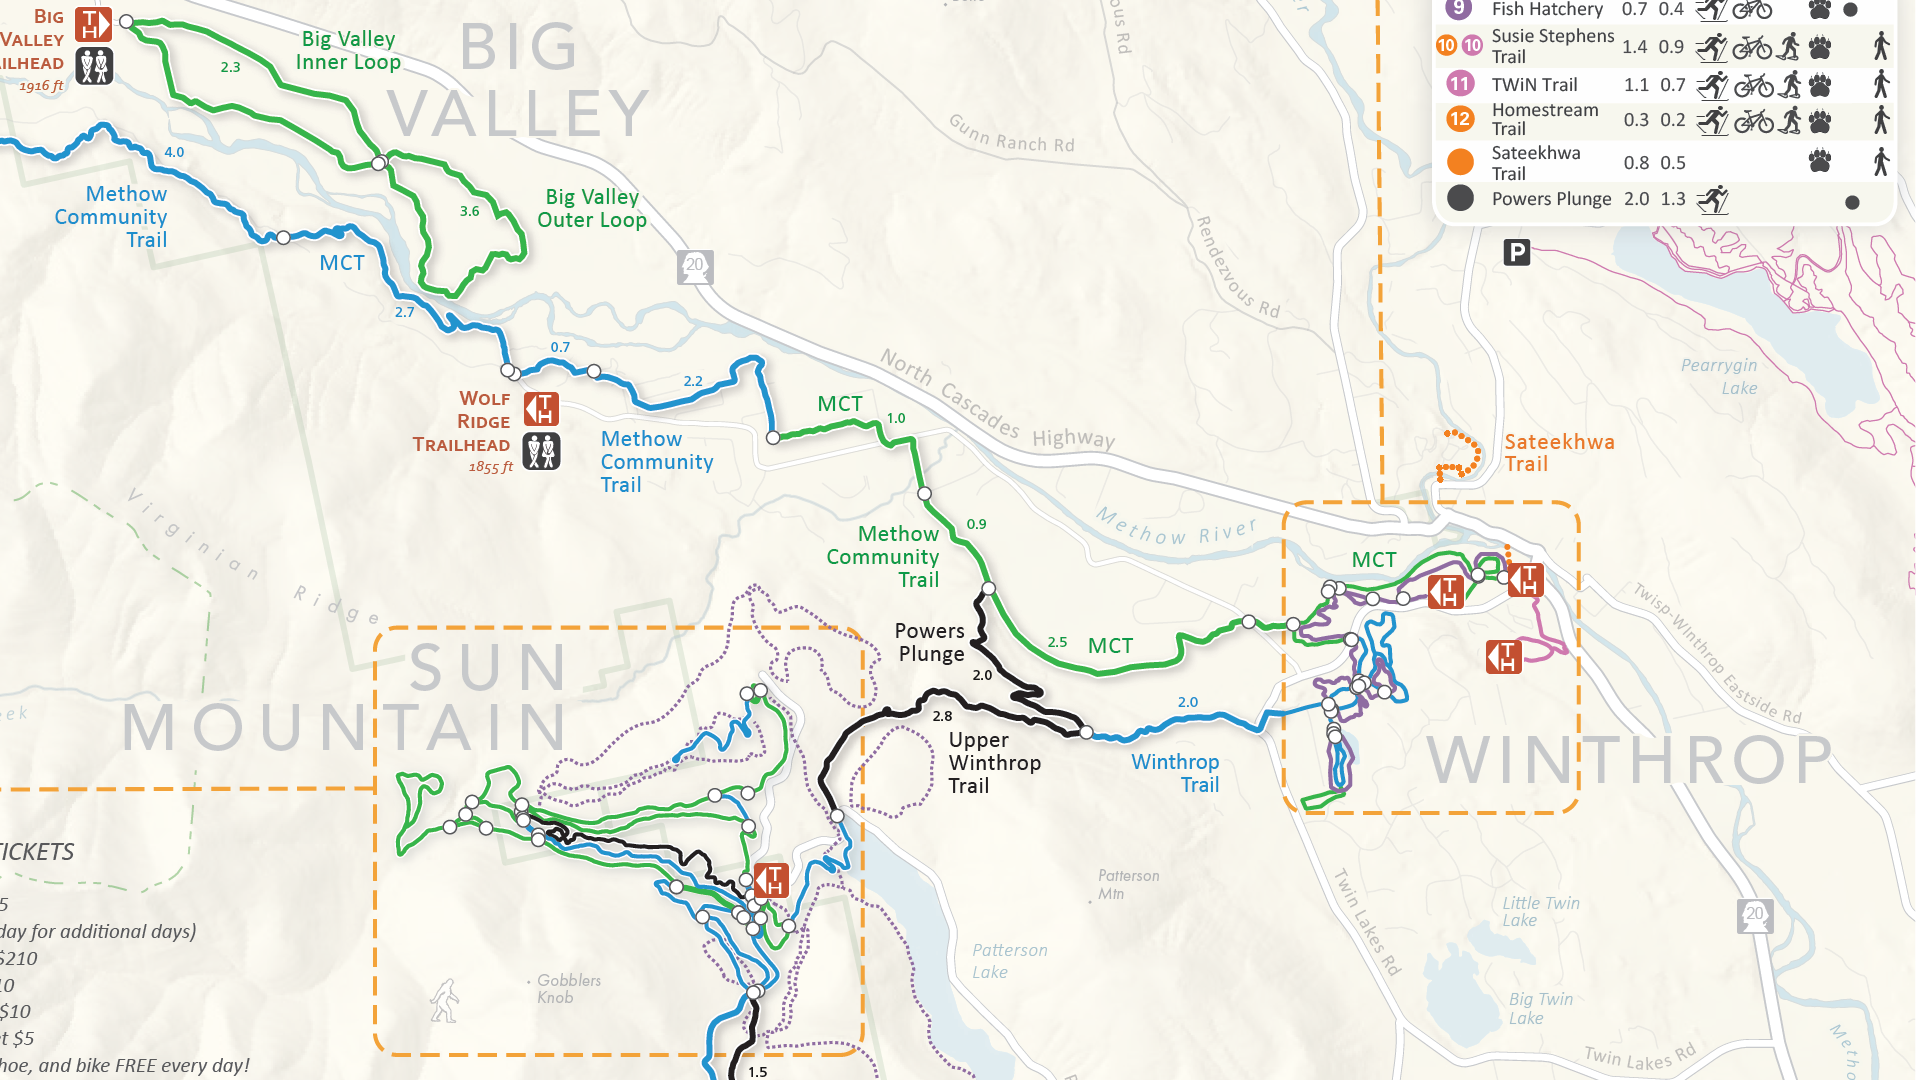
In this month’s Map Spotlight we are showcasing an honourable mention of the 2021 Avenza Map Contest: Winter Trails of Methow Valley, WA by Matt Dressler. This map was created to provide visitors to the region with all the information needed to plan, explore and navigate within the Methow Valley of Washington, the largest Nordic ski trail system in North America. The map provides users with valuable trail information including difficulty, trailheads, distances for each segment, elevation, parking, restrooms, ski waxing huts, warming huts, and usage restrictions. It also features detailed inset maps of the most popular areas of the trail system, including Mazama, Winthrop, and the Sun Mountain Complex. The map maximizes legibility for users through a strong visual hierarchy, minimalist color scheme, muted basemap, and horizontal labels juxtaposed with curving line features.
The map is available throughout the valley as a double-sided, wallet-sized map card (16″ x 25″ when unfolded) and also digitally on the Avenza Maps Store.
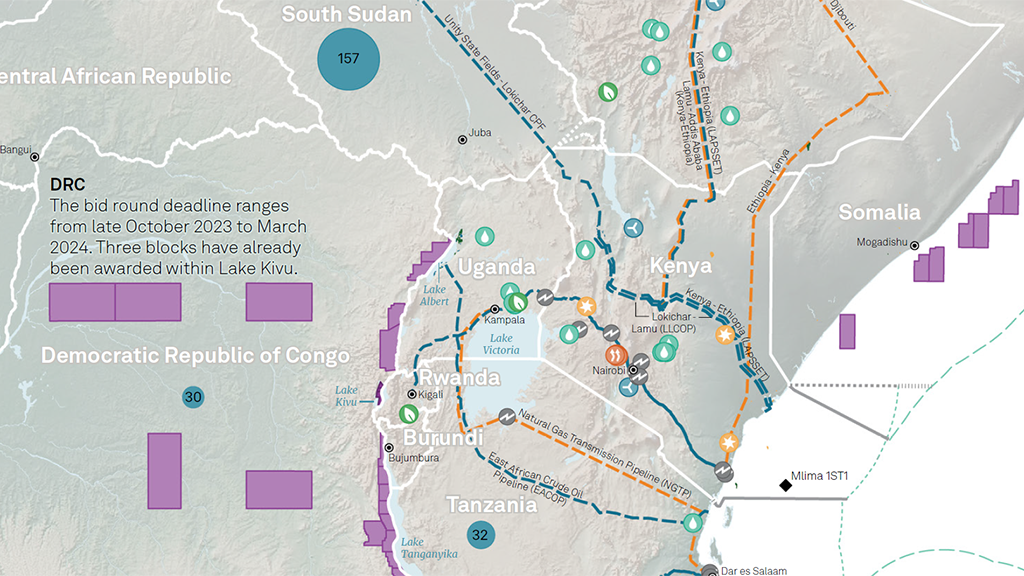
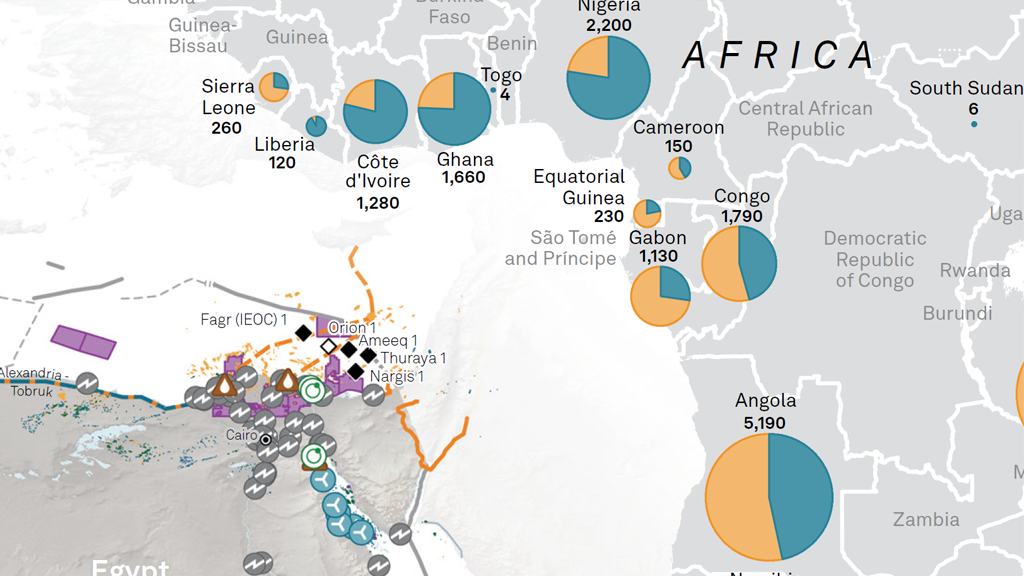
Select the images below to see a detailed look at Matt’s map
Making the Map
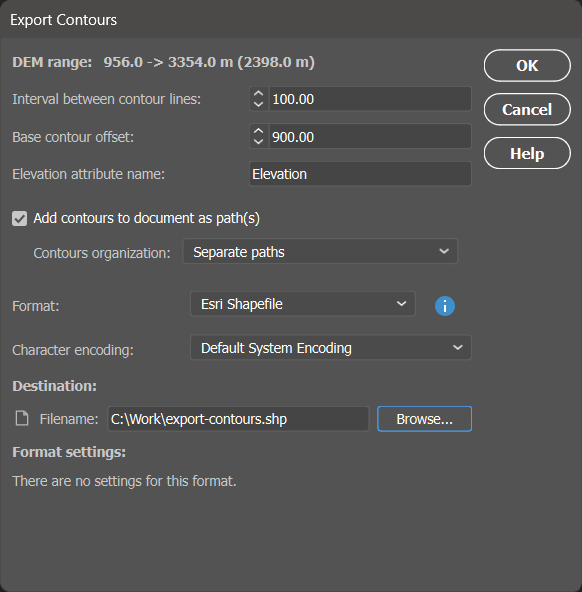
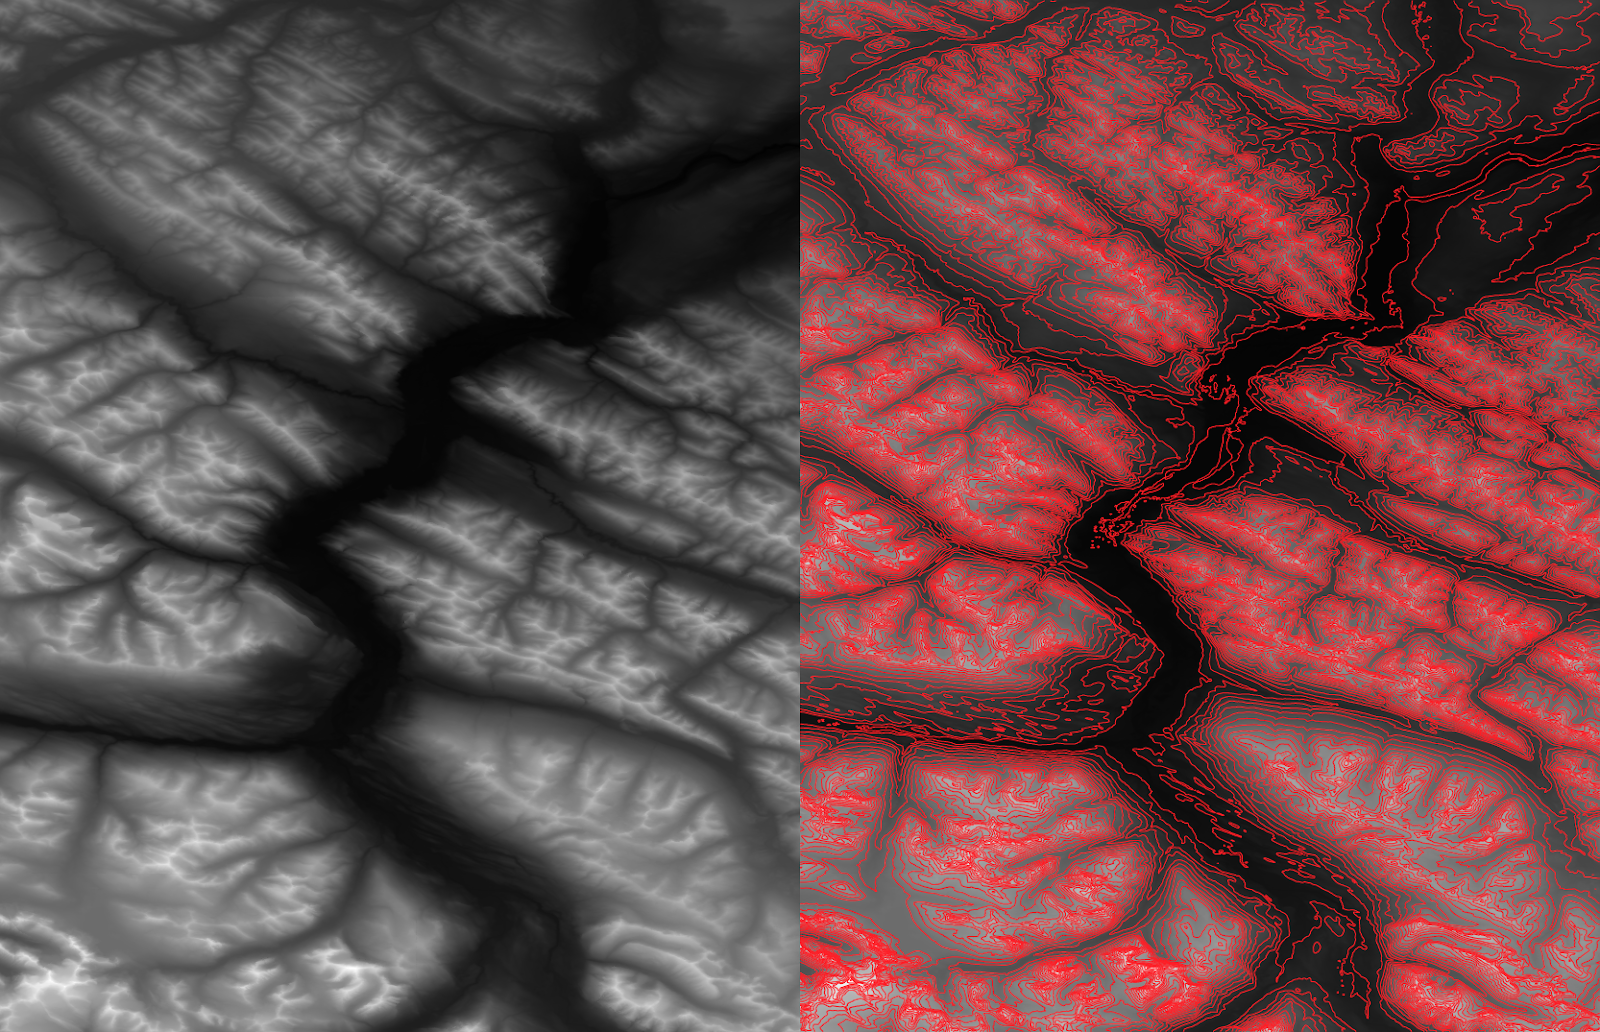
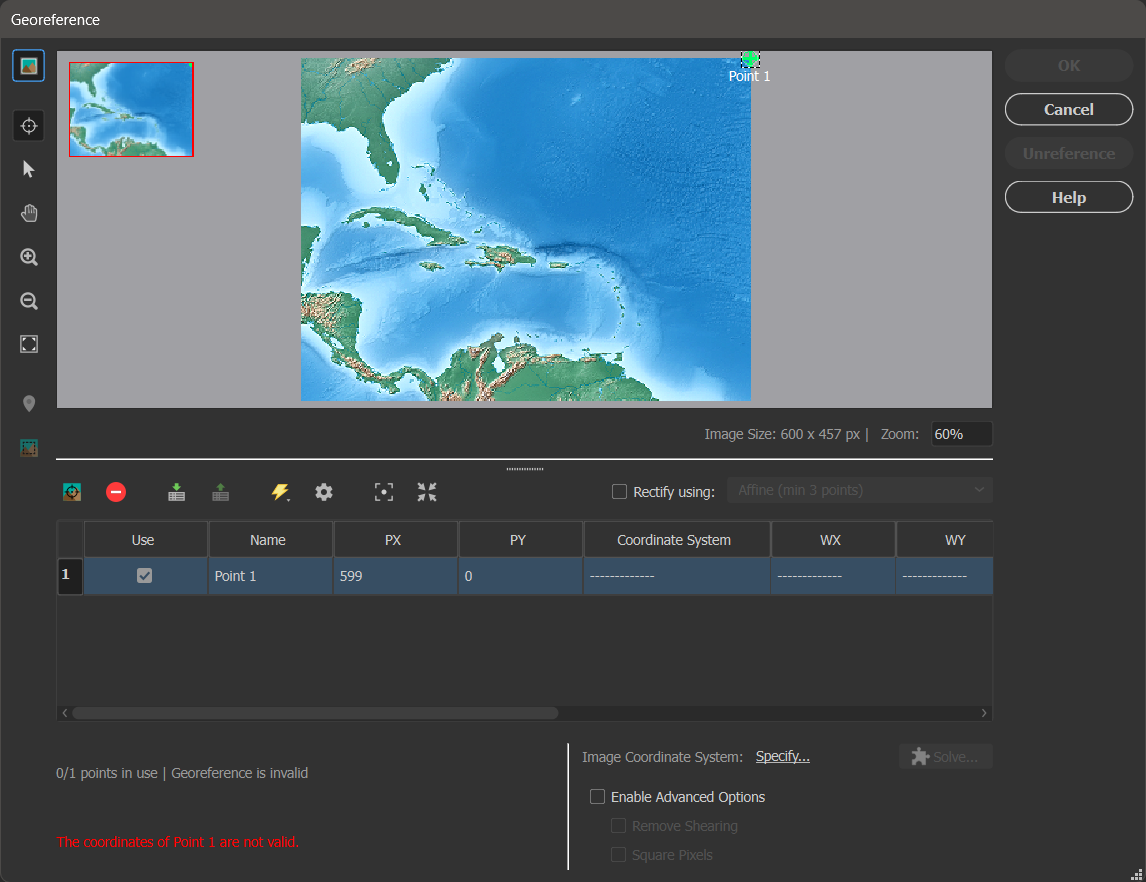
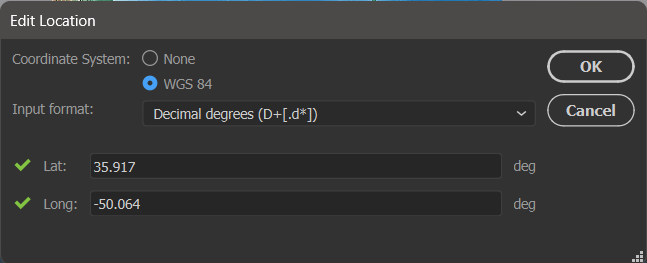
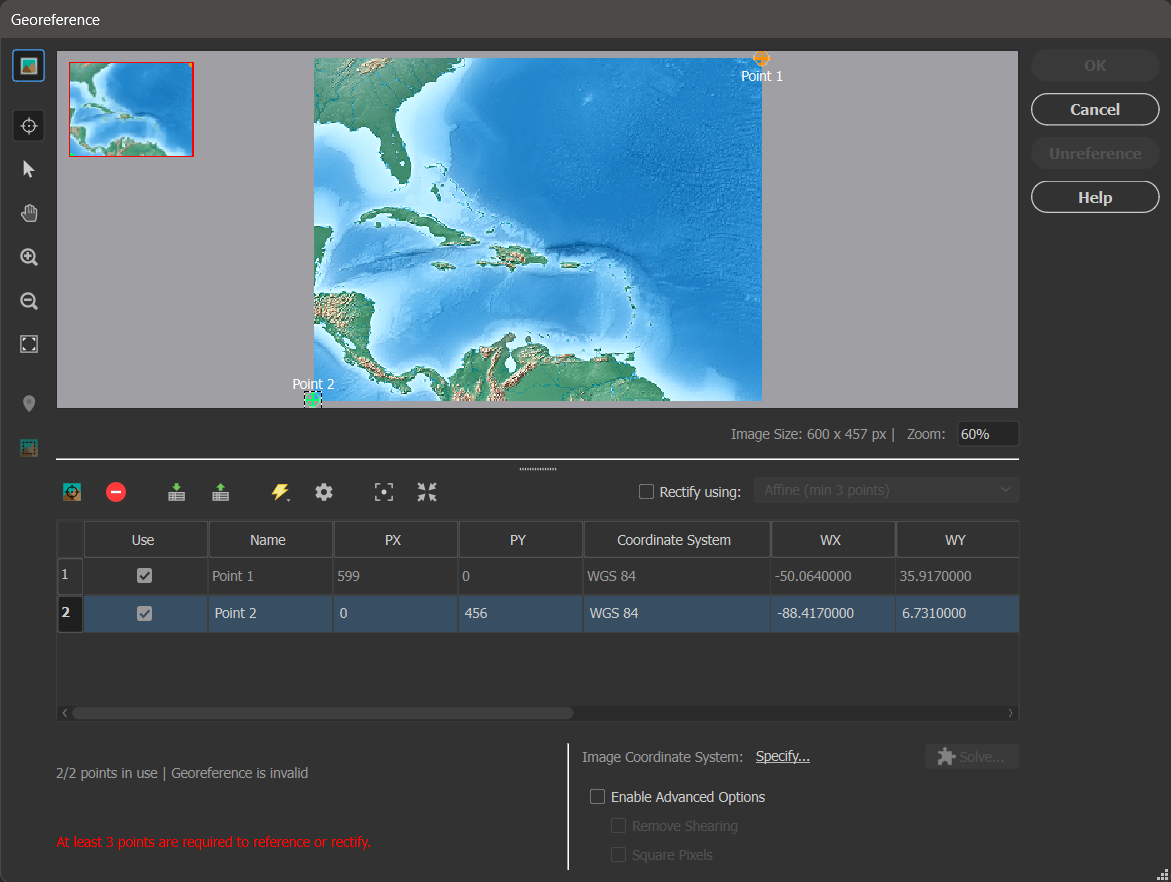
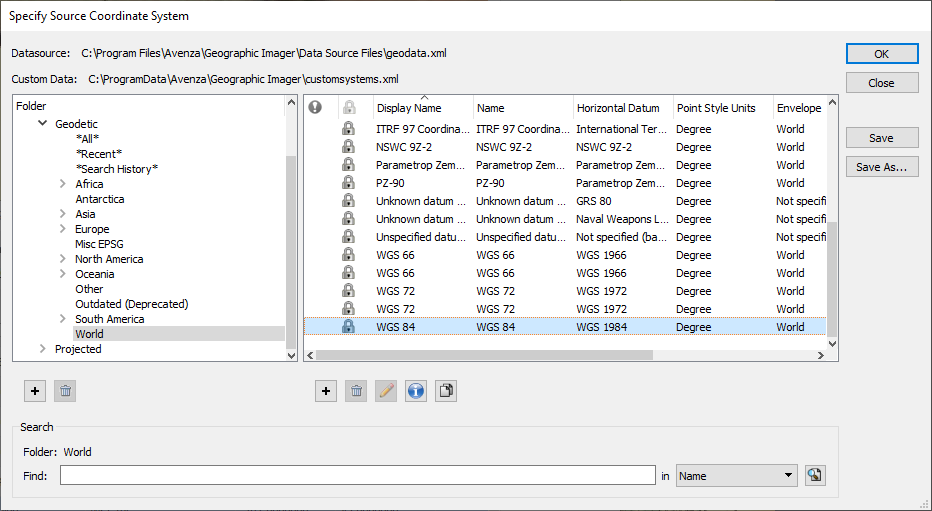
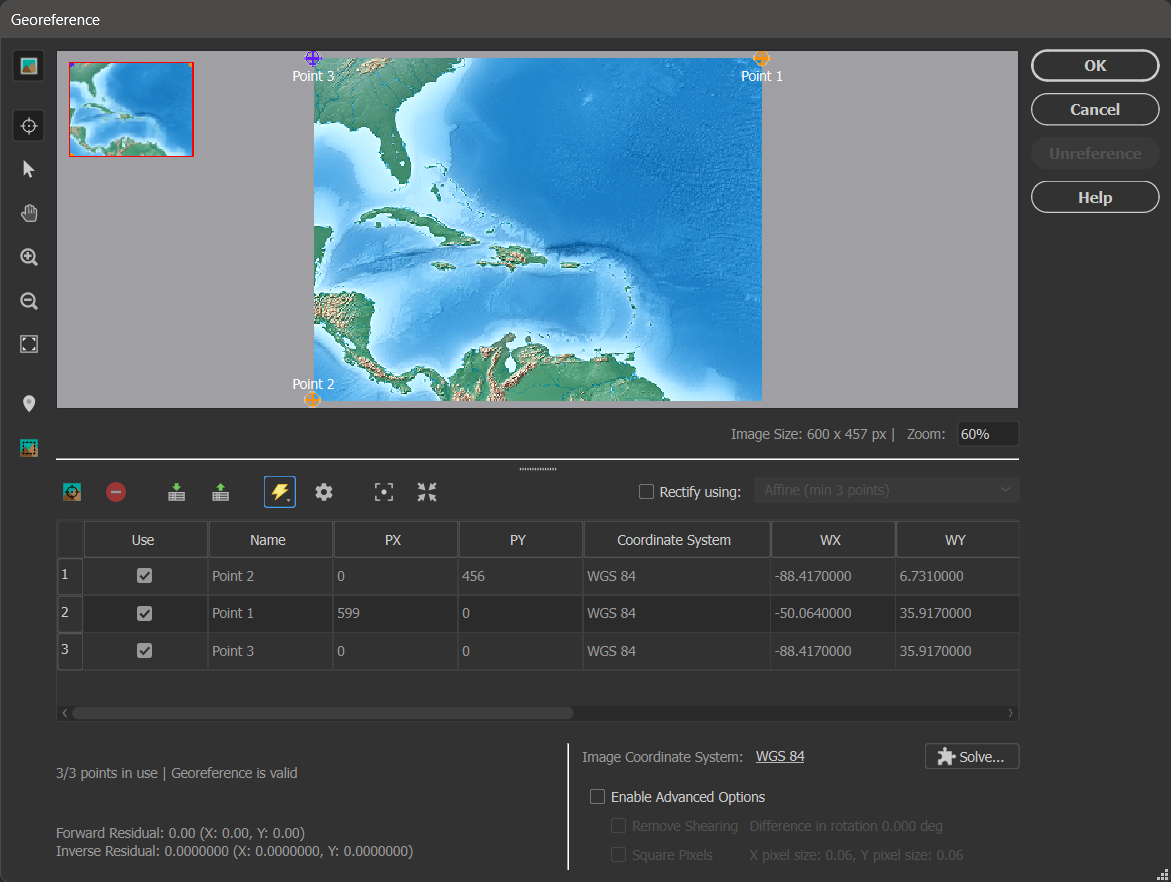
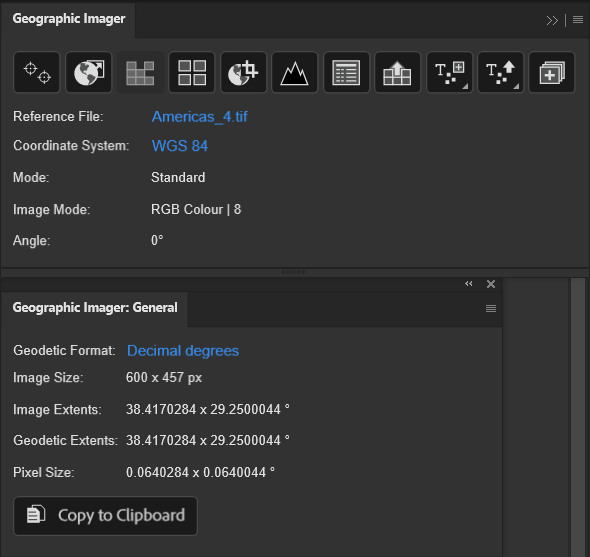
Matt worked in both Geographic Imager and MAPublisher to create this map. Geographic Imager was used in Adobe Photoshop to spatially reference and refine the shaded relief basemap. From there, the basemap was imported into MAPublisher and provided the foundation to construct the remainder of the map.
Matt used MAPublisher to import his vector data as well as his basemap image. Since his map contains multiple inset maps, he used the Copy MAP Objects From tool to copy his data to another temporary workspace document and crop it to the area for each inset map. He then used the Copy MAP Objects From tool again to bring each of his cropped maps back to the main document as an inset map (check out this blog to see this process in detail). In addition to the MAP Vector Crop tool, Matt also used the Simplify Art tool to smooth ultra-detailed trail lines to be more visually appealing.
Matt also used cartographic tools in MAPublisher to improve his map’s appearance. The Create Halo tool was used to create outlines for the trail lines to make them more legible. Adding halos to elements of a map is a quick and easy way to provide contrast for readers. Matt also used the Create Knockouts tool to create spaces in vector data where text overlapped in an undesirable way.
The MAPublisher LabelPro add-on was essential in Matt’s ability to expedite feature labeling, and allowed him to control and finetune the placement of his labels. Finally, due to the nature of his map being tilted by 12 degrees from North, Matt used the Scale Bar and North Arrow features to easily ensure his finishing touches were oriented correctly.
Learn more about the Avenza Map Contest here, and check out our other Map Spotlight blogs here!