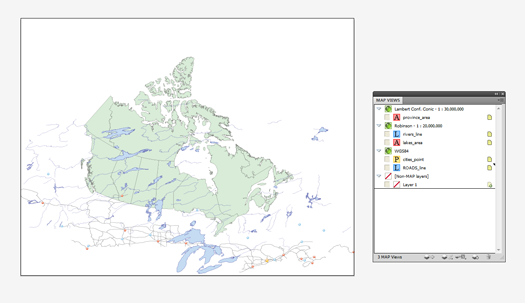
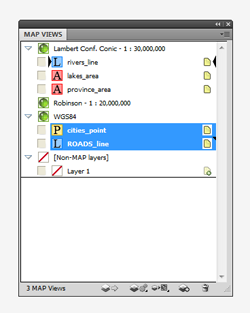
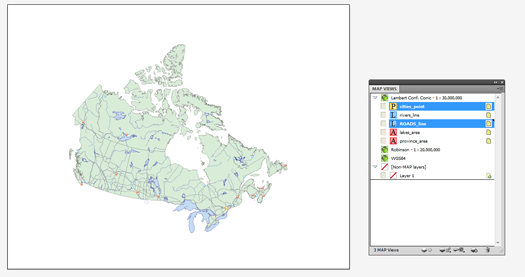
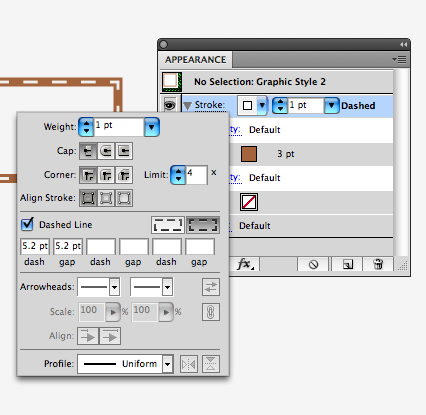
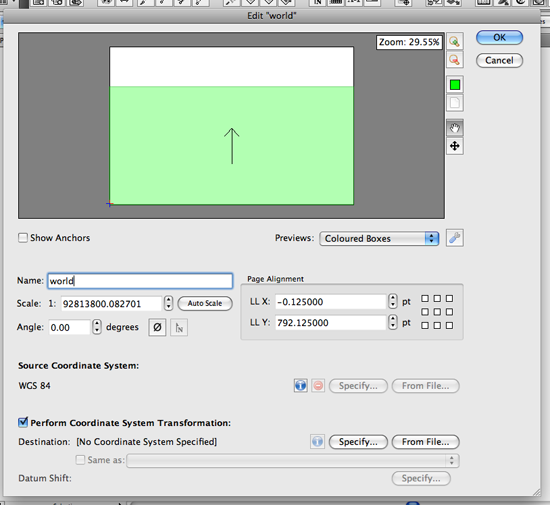
Among other great new features, MAPublisher 8.4 includes new text utilities designed to ease cartographic workflow by adding flexibility to text handling. These tools are accessed through two icons grouped with the MAPublisher document operations tools on the MAPublisher tool bar.
Text Utilities
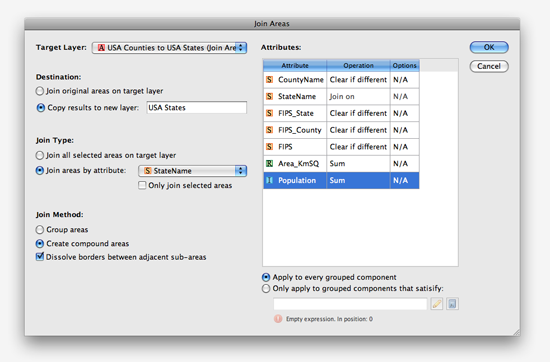
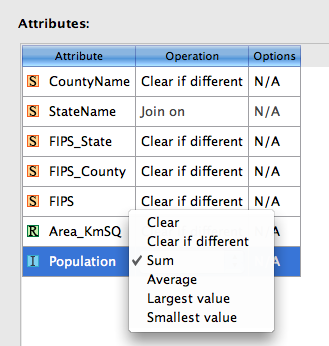
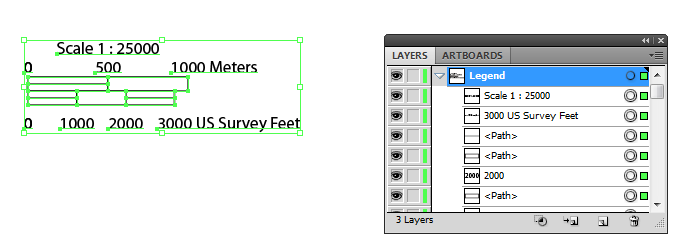
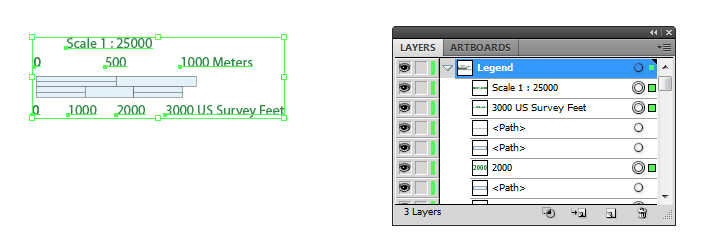
Add functions like convert text on a path to point text, separate multiline text, extend overflowing text, flip upside down text, crop text path to text length, set text alignment, rectify point text to angle, and draw shape around text. These text utilities can be applied to selections, to layers, or to all document text at once. The following table provides examples for the result of each tool.

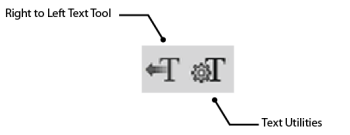
Right-to-Left Text Tool
Many right-to-left languages, such as Arabic and Hebrew, require additional language-specific processing to get the correct glyph output given the incoming character stream. Let’s look at an example.
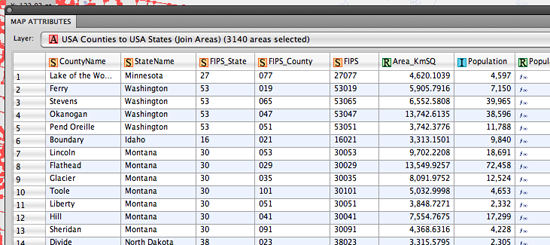
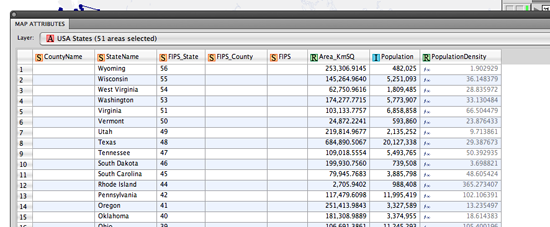
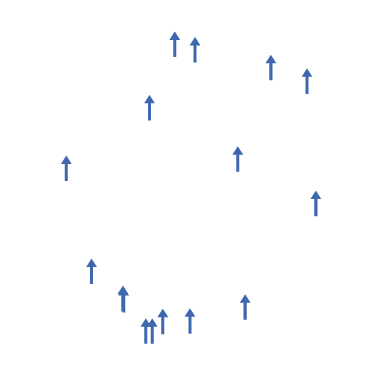
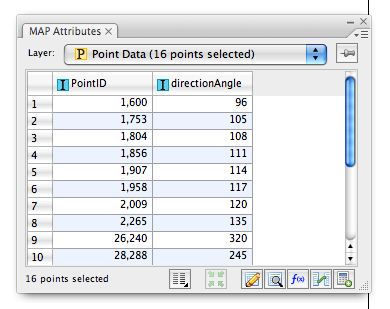
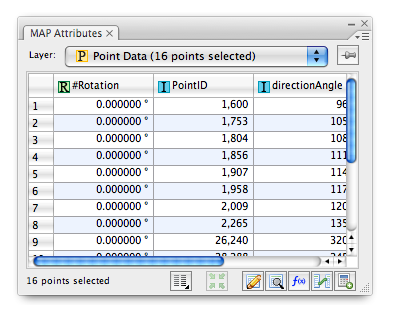
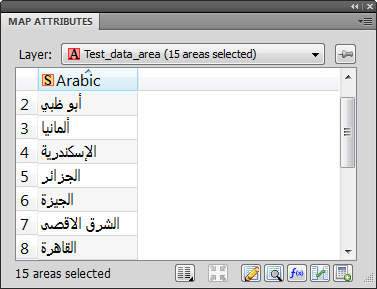
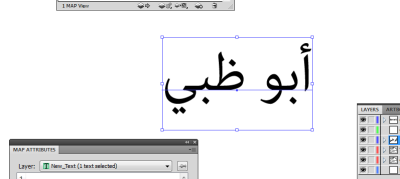
Looking at the MAP Attribute panel, we see that the Arabic script is displayed properly
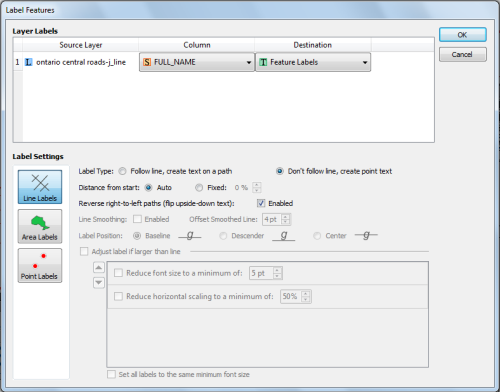
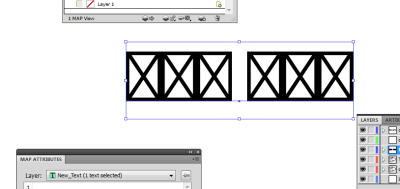
Yet, when using the Label Features tool, we see that the Arabic text is placed as a series of symbols that indicate that the text placement could not be accomplished accurately. This is one of two scenarios we will see, the other being that the Arabic characters will be placed left-to-right.
This happens because Label Features uses the currently selected font, in this case Myriad Pro. Since the Arabic characters were not found in the current Myriad Pro, the displayed symbol is substituted.
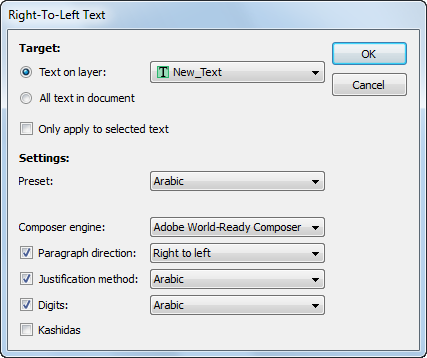
Once we apply the Right-to-Left text tool to these symbols, the Arabic characters will be reordered and altered to display the character appropriate to placement within the word and appropriate to surrounding characters. To apply the Right-to-Left text tool select Arabic from the preset drop-down menu. This populates the remaining settings with the correct parametrs.
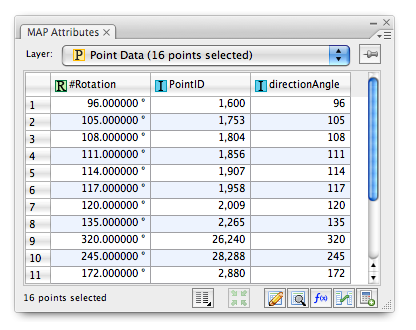
Clicking OK, the script now matches what is found in the MAP Attribute Table.
If you are using MAP LabelPro, you will also need to use the Right-to-Left text tool after labeling. However, there is a slight difference between Feature Labels and MAP LabelPro behaviour. Instead of displaying the box with “x” symbol, it will place the Arabic characters in reverse order from their proper placement in the MAP Attributes table.
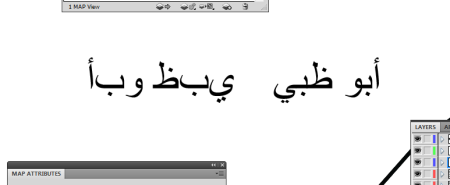
The text on the left is placed by MAP LabelPro, with the text on the right having been corrected with the Right-to-Left text tool.
We’re excited that these text utilities are being incorporated into MAPublisher. Many users have been requesting more text options. We hope you’ll like them as much as we do. We’re putting the finishing touches on MAPublisher 8.4 and will be releasing it in a few weeks.