Creating multiple maps that share cartographic styling is a common requirement for MAPublisher users. The most effective way to accomplish this is the use of MAP Themes. MAP Themes are a collection of thematic cartography tools designed to increase productivity by automating how styles and symbols are applied. Creating a number of MAP Themes based on regularly used layers with standard attribute schemas can greatly reduce the amount of time spent styling maps.
This guide will walk through creating and setting up MAP Themes to automatically apply to the appropriate layers upon import. If done correctly, rather than seeing this:
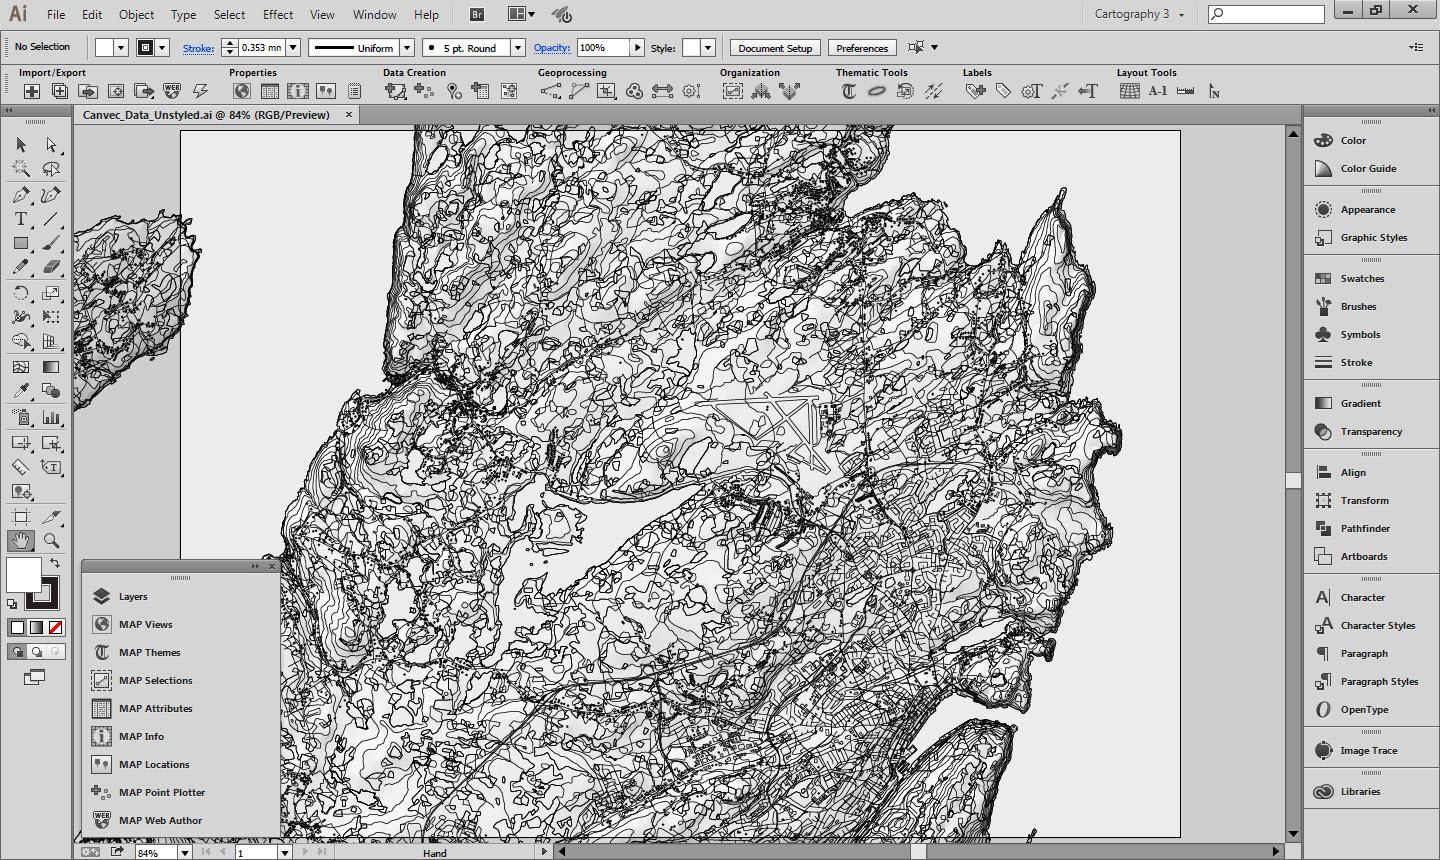
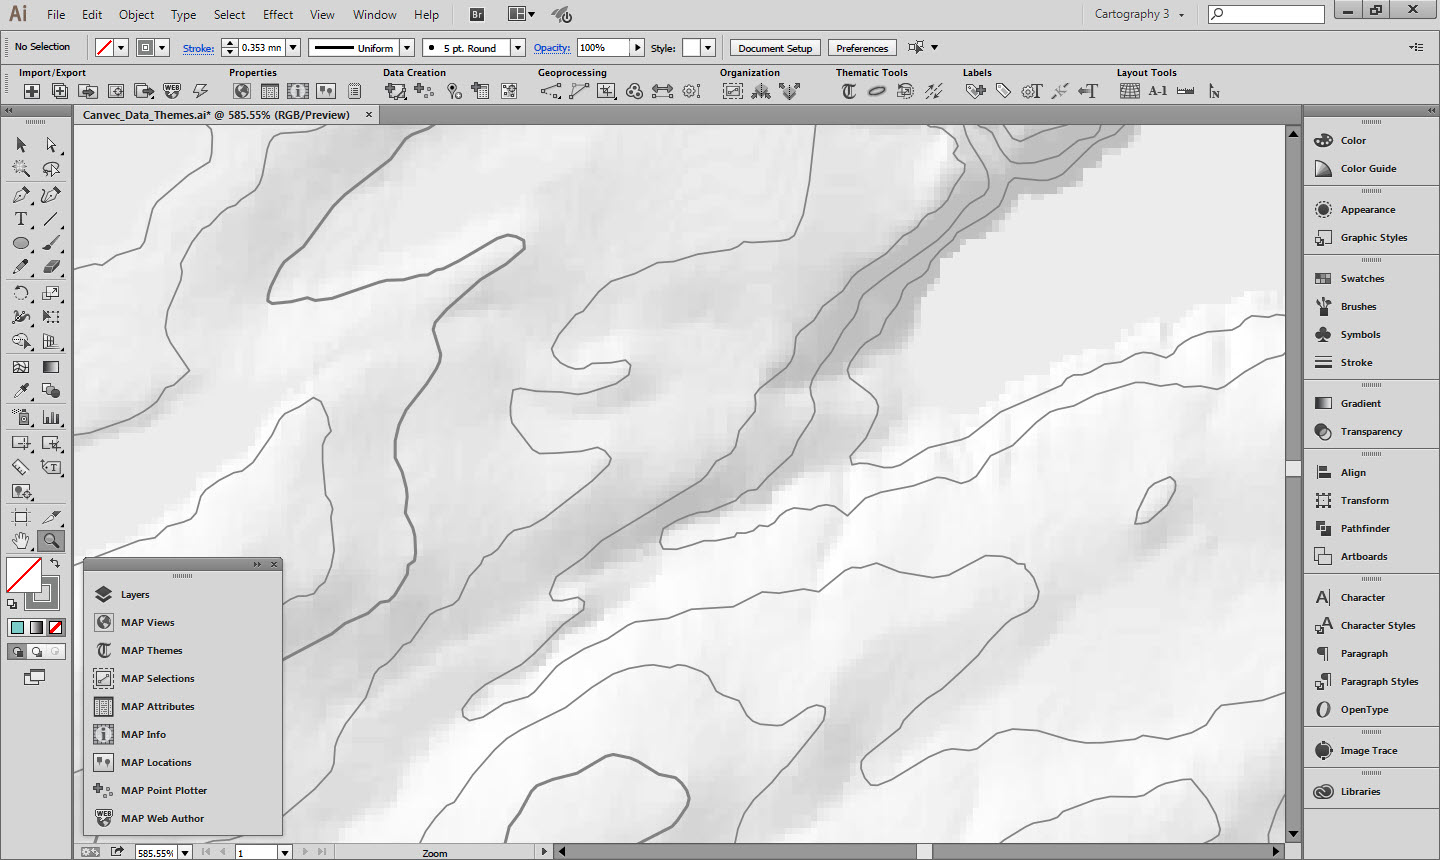
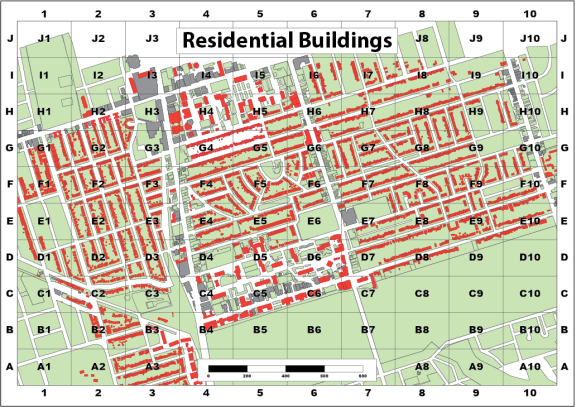
Unstyled CanVec+ layers
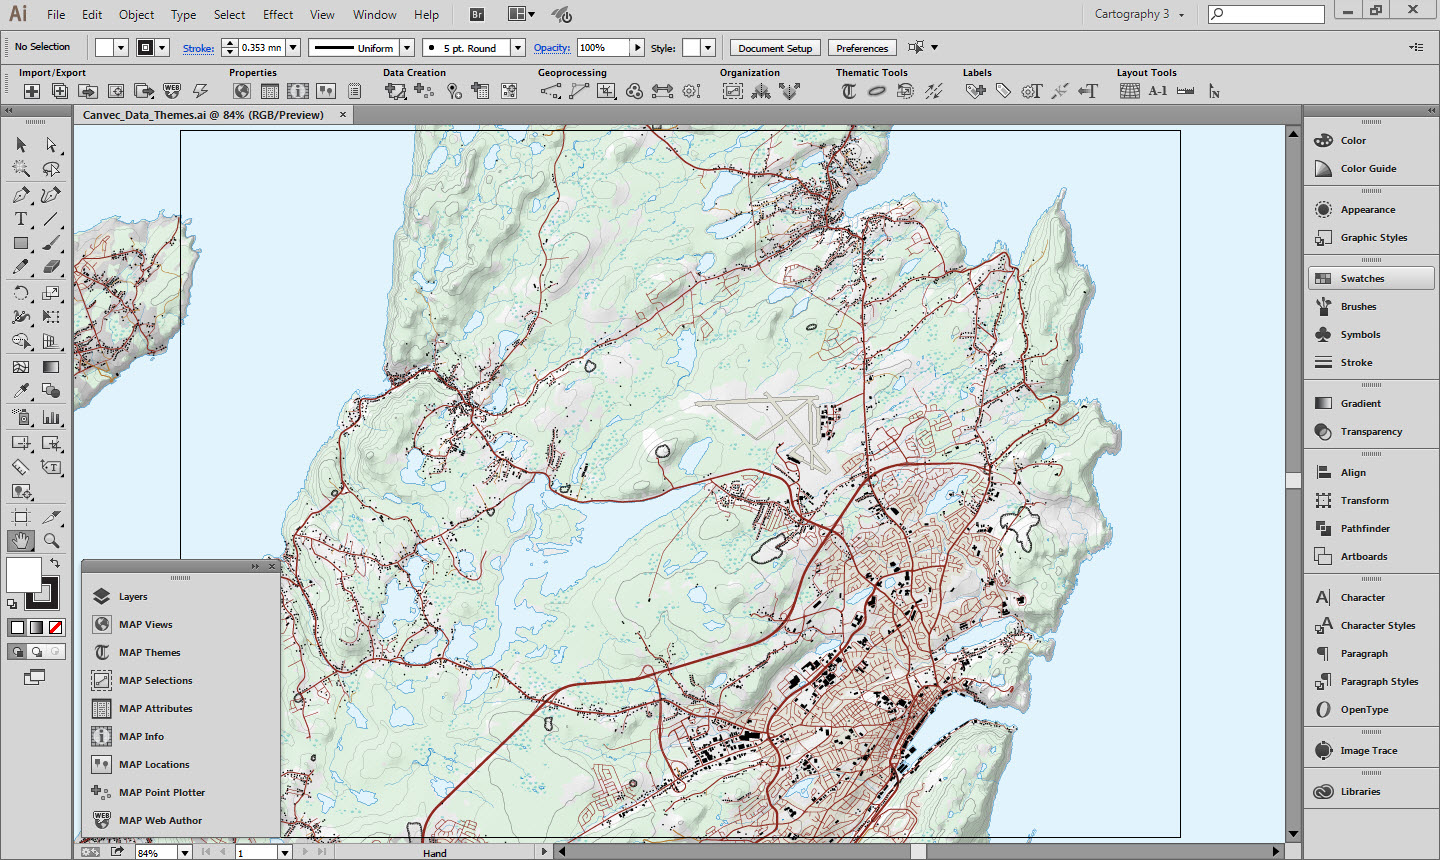
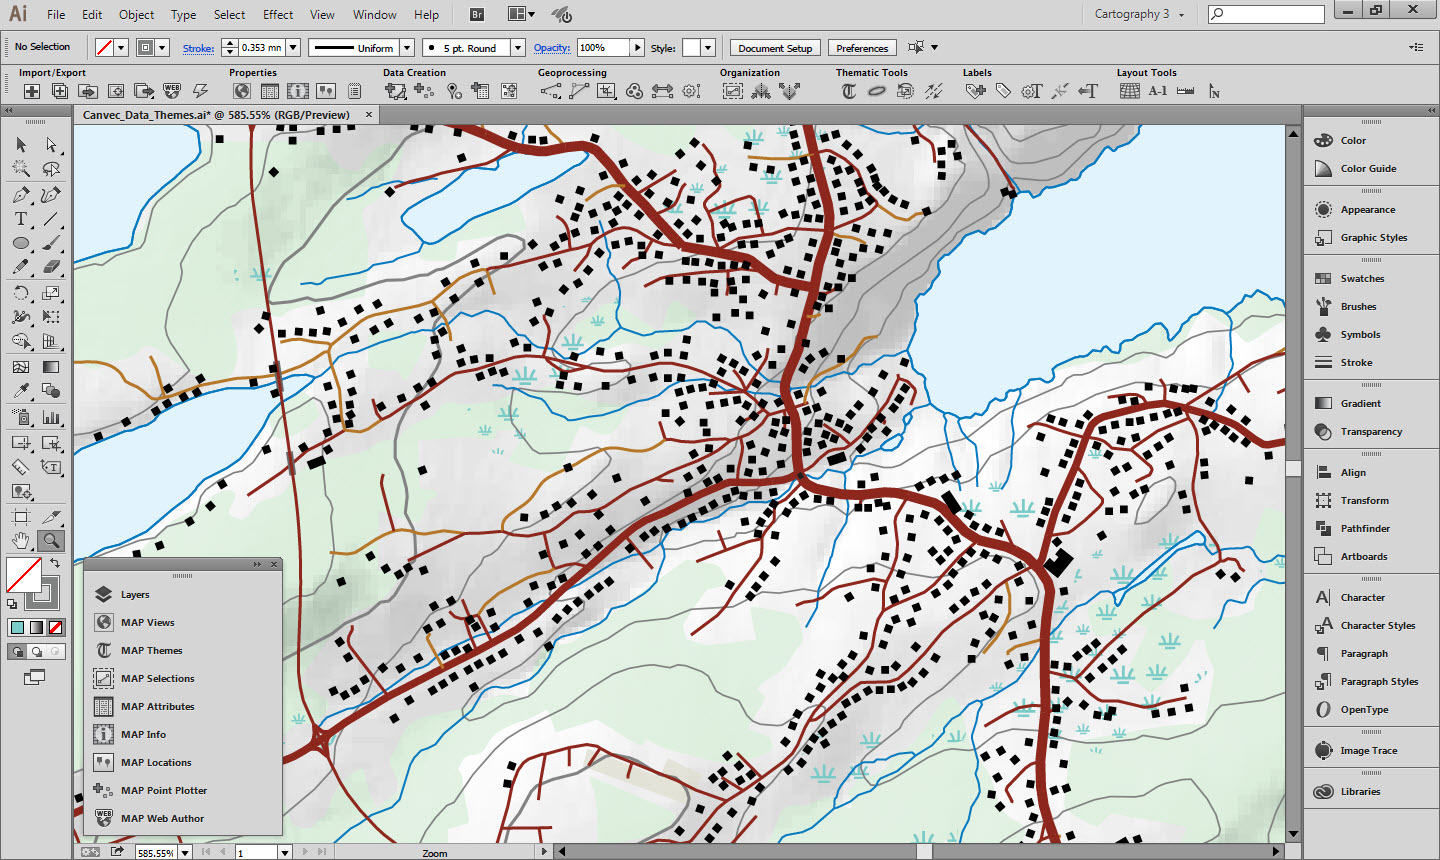
You will see this when importing data to MAPublisher:
1. Data Source
The data used in this guide comes from the publically available CanVec+ topographic database. CanVec+ contains a comprehensive set of layers optimized for display at 1:50,000 that are perfect for topographic mapping. In fact, many of these layers are used in the construction of the CanTopo Topographic mapping series available here.
The layers you receive from the CanVec+ download service will vary depending on what features are present in the extent chosen. The Geogratis Geospatial Data Extraction tool is the most convenient method to retrieve CanVec+ data. This guide uses a selection of CanVec+ layers styled similarly to the CanTopo maps.
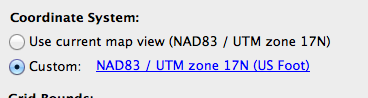
All vector data was downloaded in an unprojected geodetic coordinate system and projected into a UTM projection MAP View.
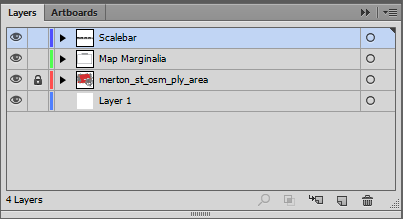
The map shown above contains 12 vector layers and one raster layer, but we will only discuss the styling and configuration of three layers as the process is similar for the rest. You can download the Adobe Illustrator file at the bottom of the page if you want to examine the different layers, their graphic styles and MAP Themes.
MAP Themes are the primary method for applying attribute based cartographic symbology. A powerful feature is the ability to automatically do this on layer import based on geometry type or file name. By defining one or many graphic styles and a MAP Theme for each layer the layers can be automatically styled on import.
CanVec+ themes have a consistent naming scheme that makes them especially suitable for this sort of automated styling. Because each style is always named the same, it is simple to set up the MAP Themes to automatically apply when the layers are imported. The theme names are consistent but somewhat obscure, as are some of the attribute names and values. Luckily there is a specifications document that provides a guide to the various themes, datasets and attributes that are available. A link is provided in the useful resources section below. While the style guide is helpful, it can be difficult to navigate, so it has also been translated into a more easily readable Excel spreadsheet, which also available in the useful resources.
A CanTopo symbology guide is available for download and was used to help define the styles for the different layers used in this map. A link is available in the useful resources section at the bottom. The University of Toronto also hosts an old specifications guide, but as it is almost 14 years old it should not be assumed to be accurate. If you are looking for inspiration though, it is useful.
2. Example A: Building point locations
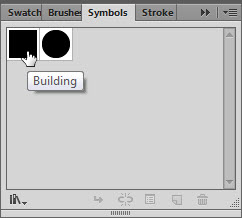
2a. Building Point Symbol
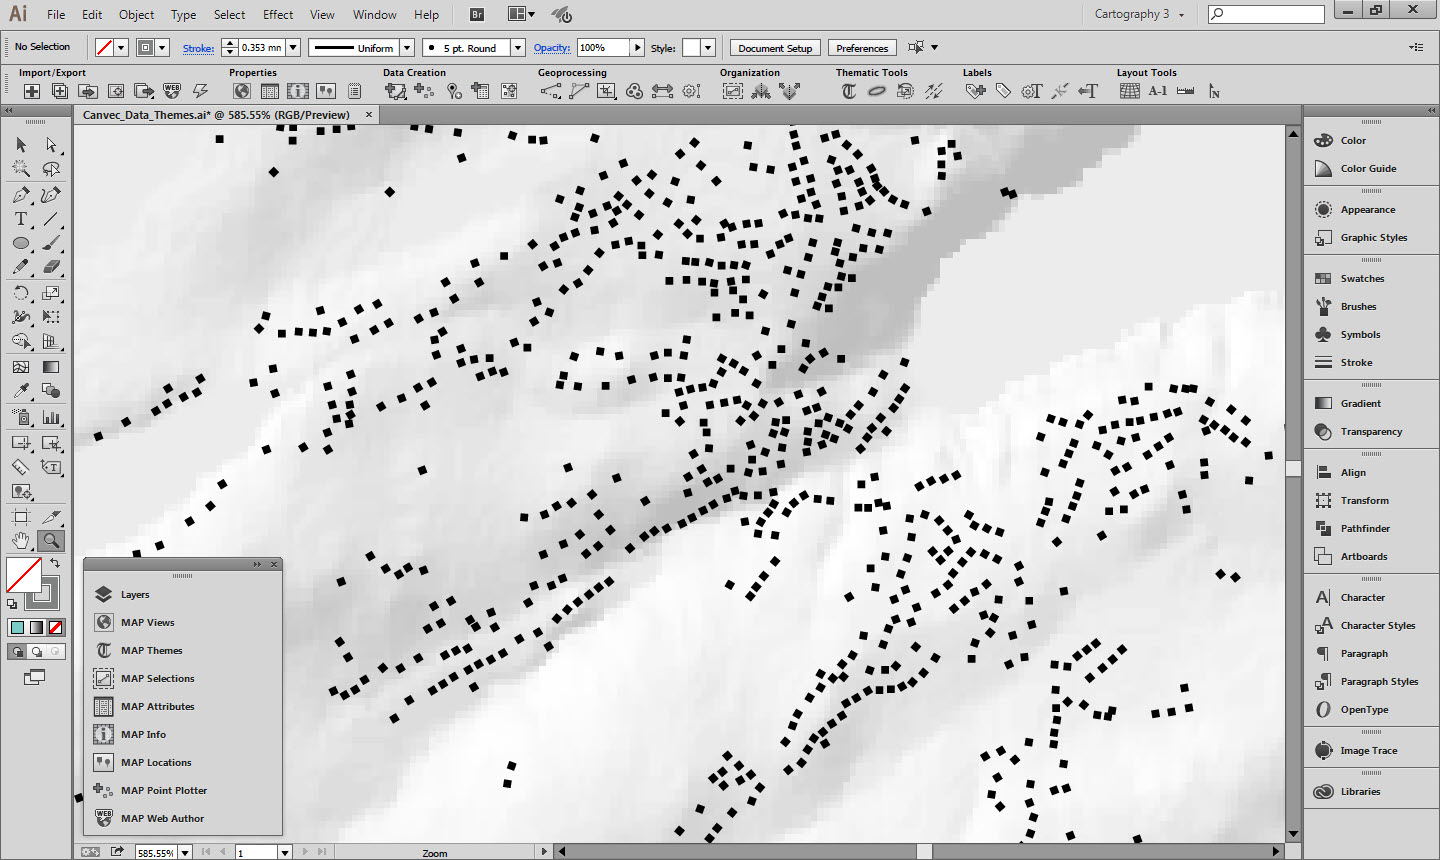
The Graphic style for the building symbols is a black square rotated to match the value in an orientation attribute. Using the CanTopo symbology guide a correctly sized square was created and then added to the symbol library.
2b. MAP Theme
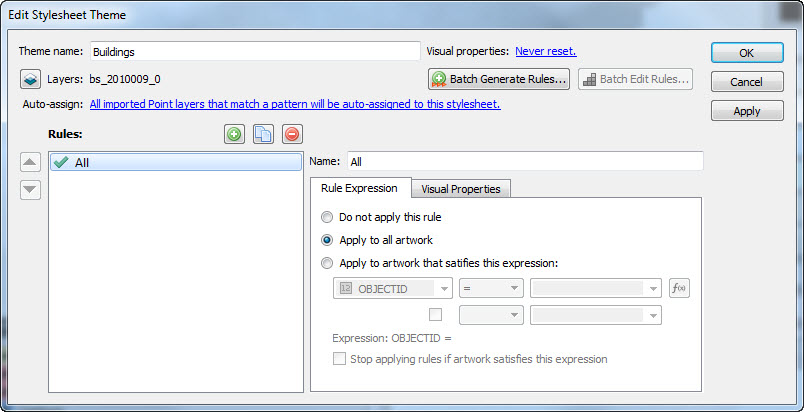
A new Point Stylesheet MAP Theme was created called Buildings. The appropriate layer “bs_2010009_0” was added to the Theme and a rule was created named “All” as it will apply to all the building point locations. The Rule Expression is set to apply the Theme to all artwork as we want all the building points to look the same.
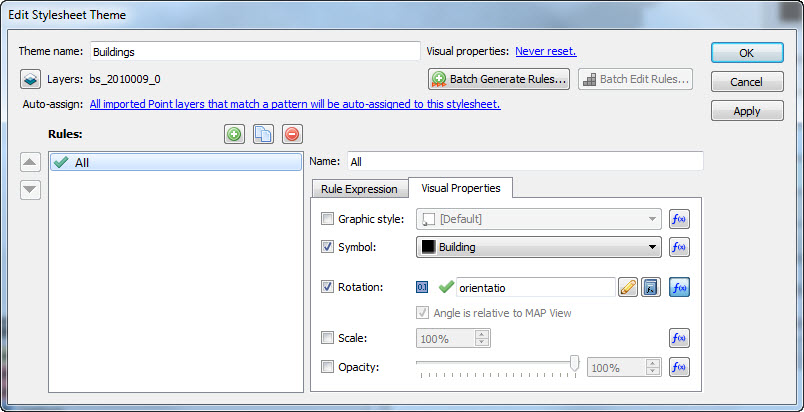
The Visual Properties tab was used to determine how the buildings would appear. The Symbol property was set to use the Building black square symbol created and added to the Symbol library earlier. The Rotation property was set to use the “orientatio” attribute. This ensures the buildings are oriented correctly.
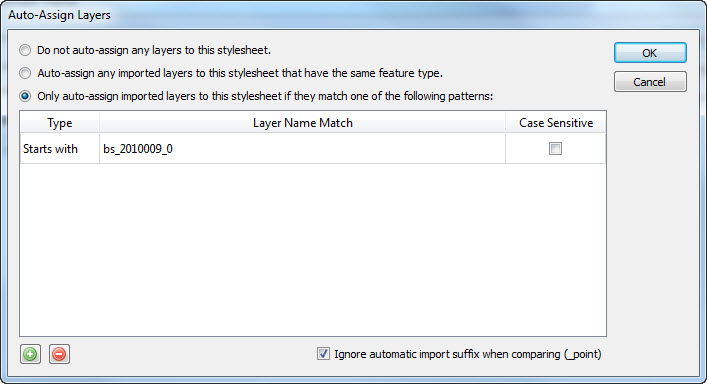
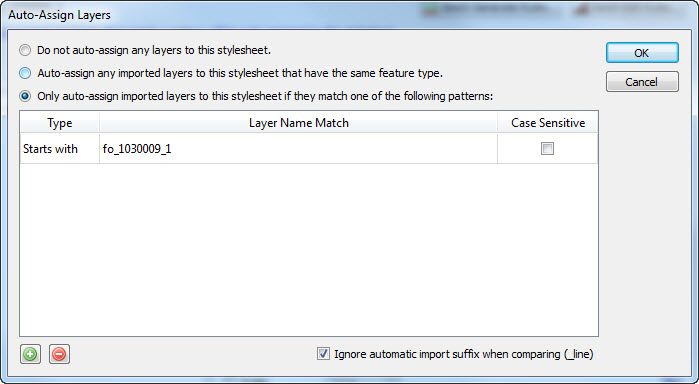
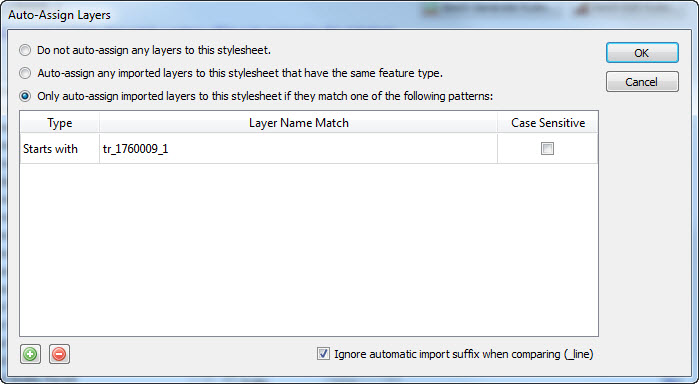
Finally, and most importantly for the MAP Theme automation, the Auto-assign option was set so that any layer that matches the filename of the imported shapefile would automatically be styled using this theme.
3. Example B: Contours
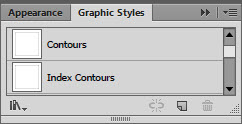
3a. Contours Graphic Style
Two Graphic styles were created for the contours: one for the regular contours and one for the index contours at intervals of 100m. Both are grey, with the index contours slightly thicker (although it is hard to tell in the Graphic Styles panel.)
3b. MAP Theme
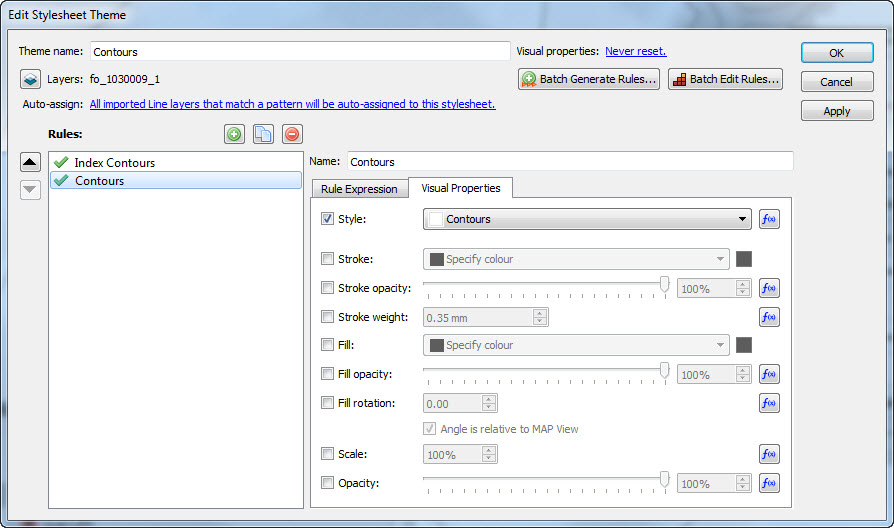
A Line Stylesheet MAP Theme was created called Contours. The layer “fo_1030009_1” was assigned to the MAP Theme. Two rules were created, one for index contours and one for regular contours. For the index contours, the Advanced Rule Expression builder is used to select any contour where the elevation is a multiple of 100, and the converse for the regular contours.
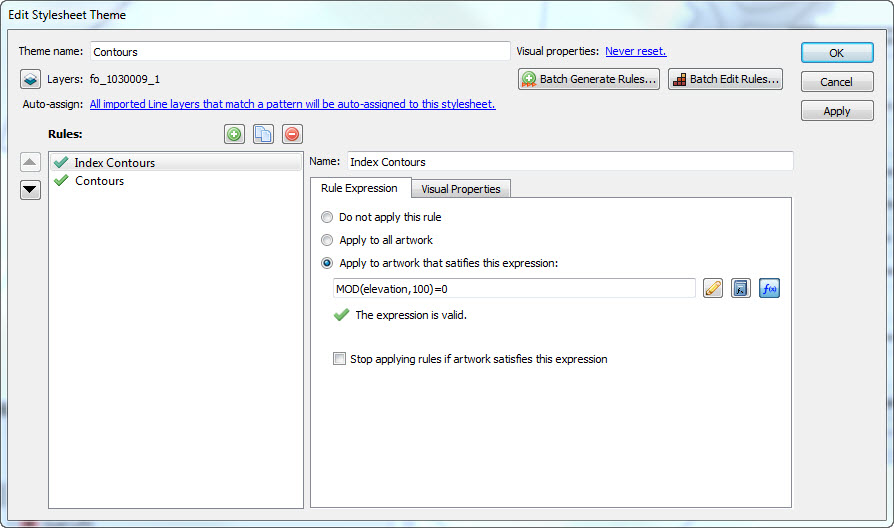
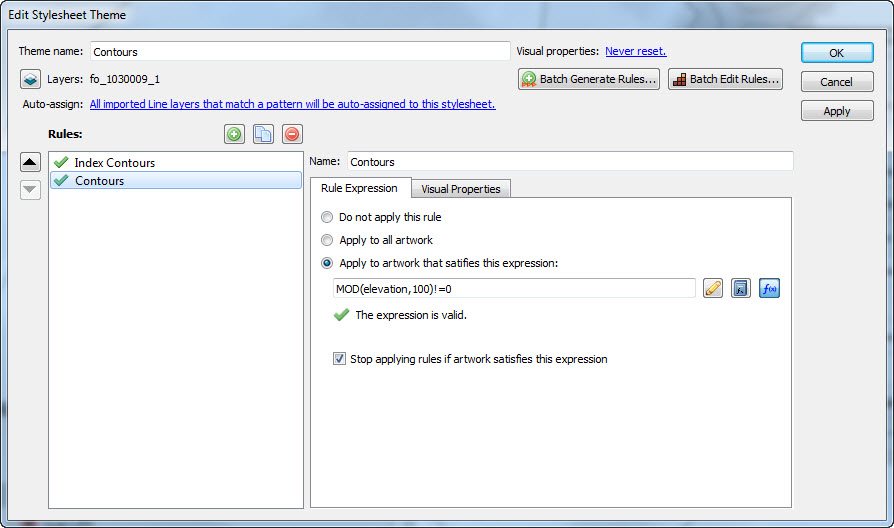
The Modulo (MOD) function makes this simple. For the index contours, the expression built as: “MOD(elevation,100)=0”. For the regular contours, the expression is “MOD(elevation,100)!=0”. The != operator means not equal to.
The Modulo function will be available with a future release of MAPublisher. If you are using an earlier version of MAPublisher, the same result for index contours can be had with this expression:
(elevation/100)-ROUNDDOWN(elevation/100,0)=0
If you do try and apply this MAP Theme with an earlier version of MAPublisher without changing the equations, it will not work and you will get errors.
Each rule is assigned the appropriate graphic style applied in the Visual Properties. Creating Graphic Styles in advance is much easier than trying to remember specific stroke/colour combinations and makes them re-usable.
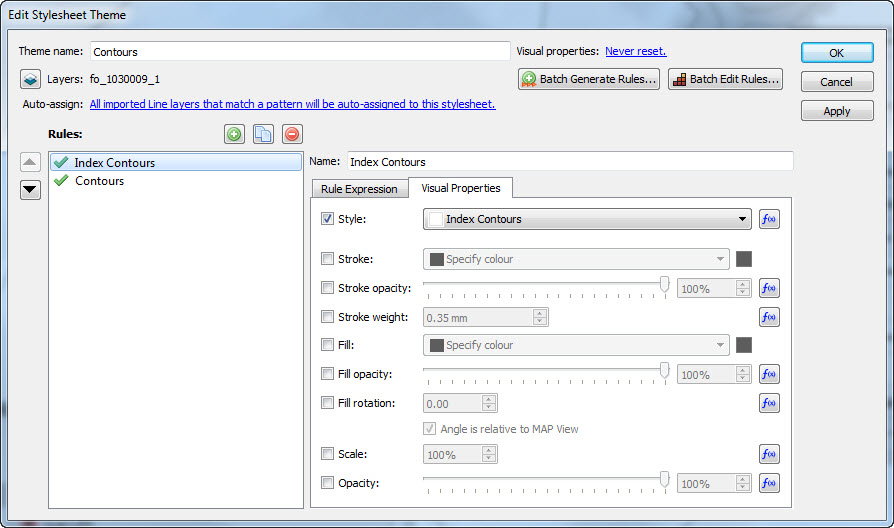
It is worthwhile organizing them in the Graphic Styles panel and naming the Graphic Styles appropriately so you can easily remember which is which later.
The layer is then set as auto-assigned so that when it is imported in the future this MAP Theme will automatically be applied.
4. Example C: Roads
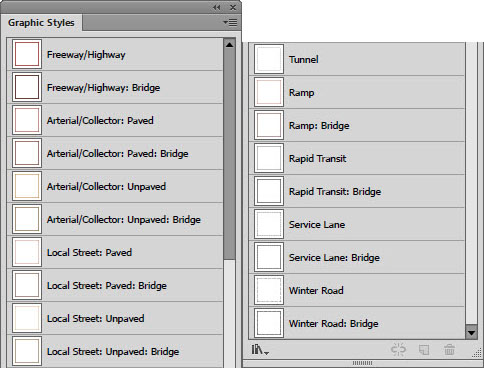
4a. Graphic Style
The Roads layer is the most complex as there are multiple different classes of roads, that are then broken down into sealed and unsealed surfaces, and can be at grade, tunnels or bridges. Several of the road classes are assigned the same Graphic Style, so each style was named after a representative road class and assigned to several MAP Theme Rules.
4b. MAP Theme
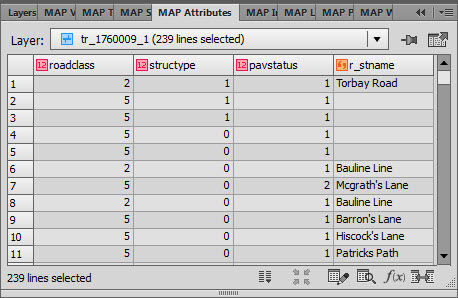
There are defined styles of roads in the CanTopo specifications, but these do not map directly to the attributes that are present in the CanVec roads dataset. There are several attributes that hold information about the composition of the road, but the ones that were used to define the MAP Theme Rules were:
- roadclass: a heirachy of road types
- structype: defines if the road is a road, a bridge or a tunnels
- pavstatus: contains information on the road surface, if it is paved or unpaved.
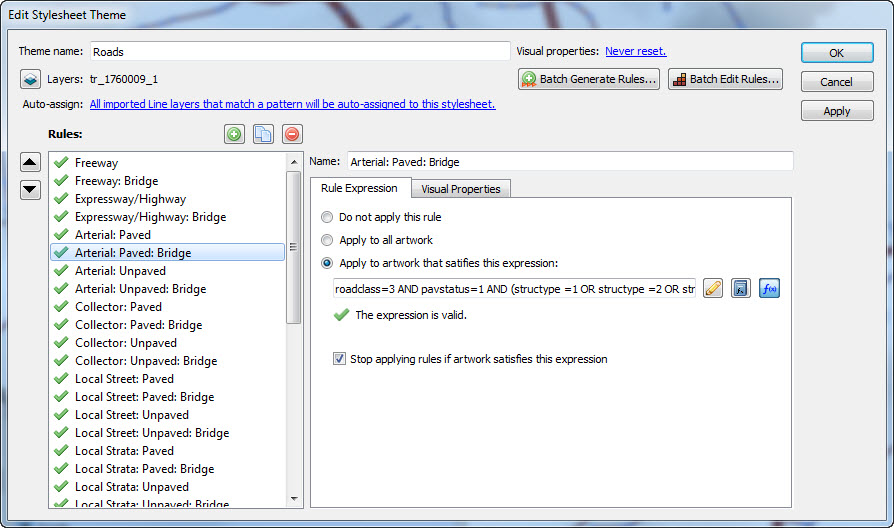
A Line Stylesheet Theme was created called Roads. The layer tr_1760009_1 was assigned to this Theme. Each road class has its own rule. The rule expression determine what class of road it is, if it is a bridge or a tunnel, and if it is paved or unpaved. An example of this is “Arterial: Paved: Bridge” with the expression:
roadclass=3 AND pavstatus=1 AND (structype =1 OR structype =2 OR structype =3 OR structype =4)
which simply says select art that is an Arterial Road (roadclass=3) is paved (pavstatus=1) and one of four different types of bridge (structype 1 through 4).
As in previous examples, each rule is assigned a Graphic Style in the Visual Properties tab.
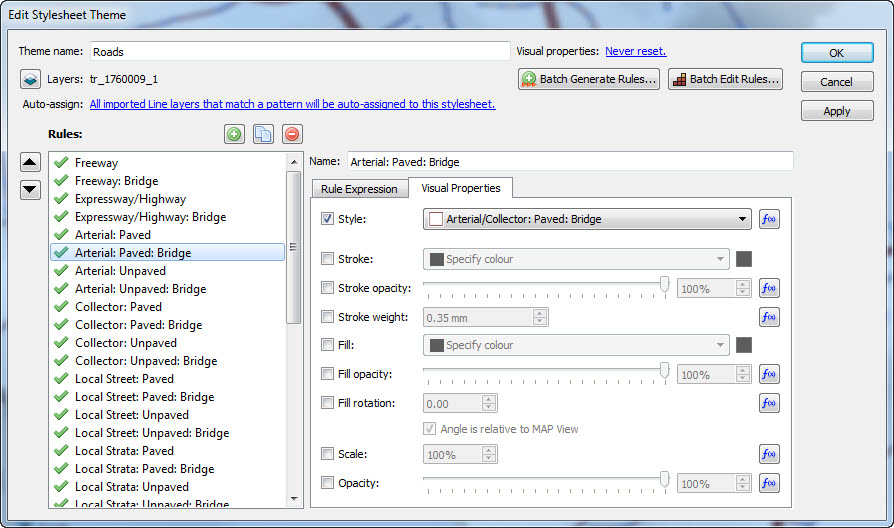
The layer is set to auto apply on import.
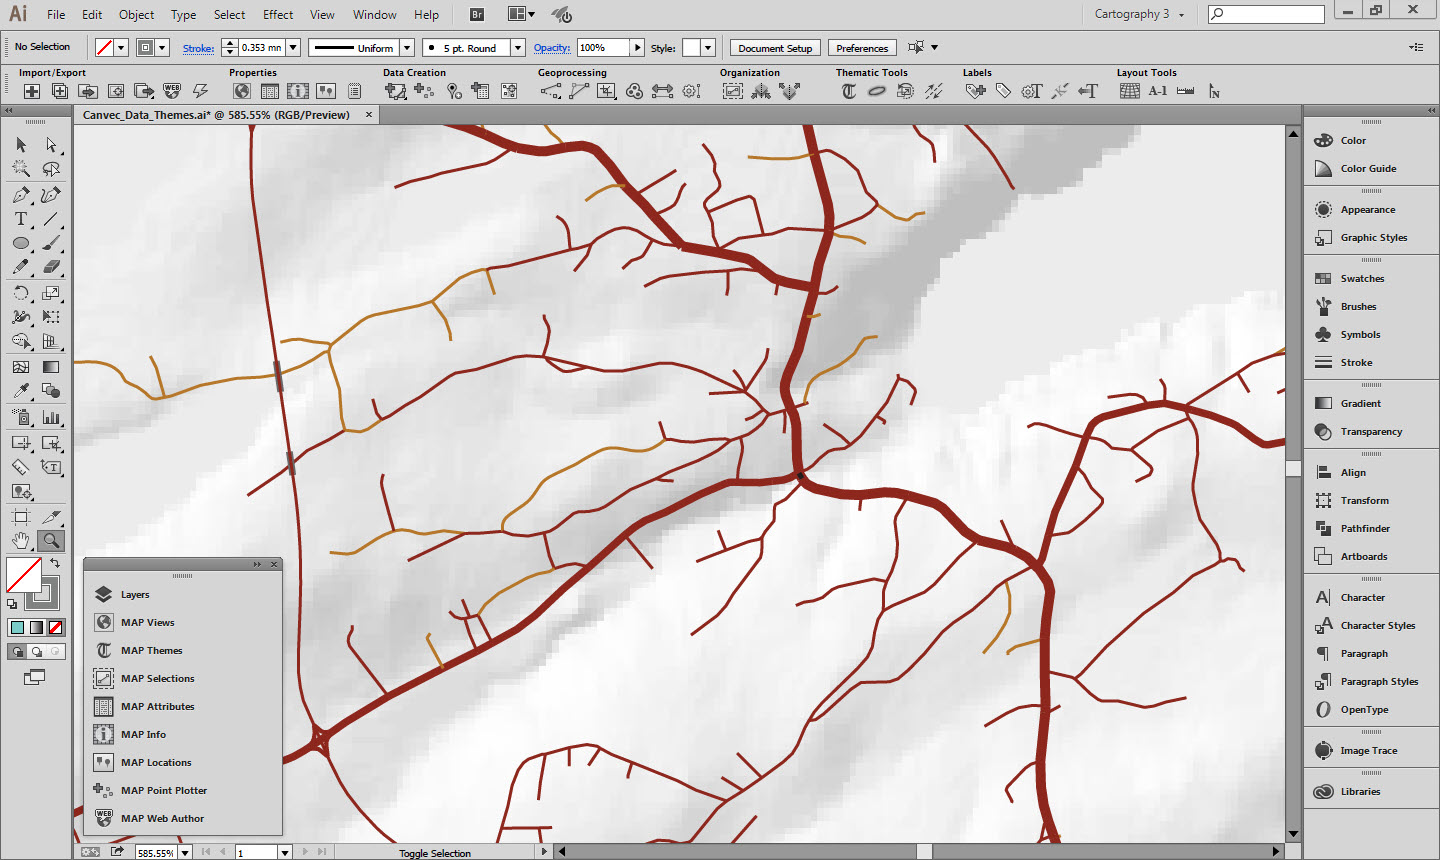
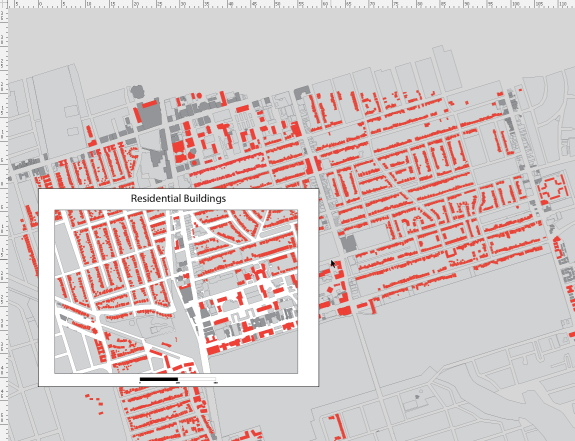
Once rules are created and applied to all the imported layers the end result looks like this:
5. Hillshade
In addition to vector data, the GeoGratis portal has raster terrain data available for download. There are digital elevation models, digital surface models, and a variety of derived products such as slope and aspect. For this map we downloaded a hillshade and adjusted the opacity so it would blend with the map style. The forest cover layer and the built up areas layer also had their blending modes adjusted so the hillshade would show through.
The hillshade was downloaded in an unprojected geodetic coordinate system and Geographic Imager was used to transform it into the UTM projection used for this map.
6. Final words
In order for the defined MAP Themes to be automatically applied to any imported data, the imported layer filenames must match those defined in the MAP Theme Rules as discussed above. If you would like to try it out with your own CanVec data extract, do the following:
- Download the “Canvec_Data_Themes.ai” file linked below for the version of Illustrator you are using. Have a look at the data structure, layer names and MAP View properties of this document.
- Also download the appropriate “Canvec_Data_Themes_Empty.ai” file to use as a template.
- Download an extract of CanVec data as shapefiles.
- Use the Advanced Import functionality to import the shapefiles into the empty document. Reproject the map if desired.
- The imported data have the styles applied automatically. However, you will probably have a few layers that have no style. Use the methods detailed above to create new styles for those layers.
7. Useful resources
CanVec Demo. (Created with MAPublisher 9.5.3, AI CC2014) – File Download
CanVec Demo – No Layers. (Created with MAPublisher 9.5.3, AI CC2014) – File Download
CanVec Demo. (Created with MAPublisher 9.5.3, AI CS6) – File Download
CanVec Demo – No Layers. (Created with MAPublisher 9.5.3, AI CS6) – File Download
GeoGratis Website
GeoGratis FAQ’s
CanVec Style Guide for Adobe Illustrator – File Download
CanVec Feature Catalog
CanVec feature Catalog Spreadsheet (Unofficial, non-maintained. For information only.) – File Download
University of Toronto Topographic Cartographic Symbols Archive


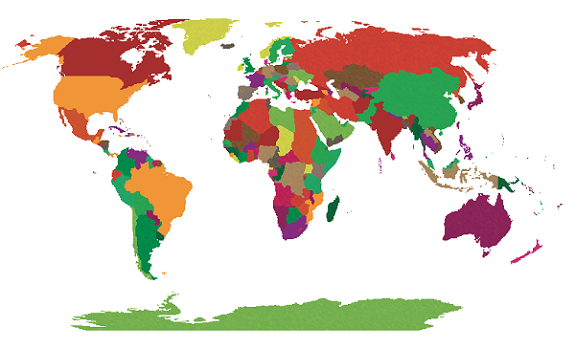 We have a CSV file containing points for large cities that we’d like to add to the map. We know from our data source that the CSV uses the WGS84 coordinate system. After selecting the file for import, the MAPublisher Import dialog box helpfully notifies us that some required settings are missing. We’ll click the blue ‘Required settings are missing’ link to continue.
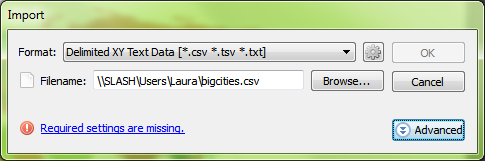 Setting up the import, the coordinate column settings are easy since we have an X_COLUMN and a Y_COLUMN, but we can’t forget to check that the format is correct. The default is Projected units, but we know the file uses WGS84, and can tell by the numbers in the column that the coordinates are in decimal degrees, so we’ll change the format to reflect this information and click OK.
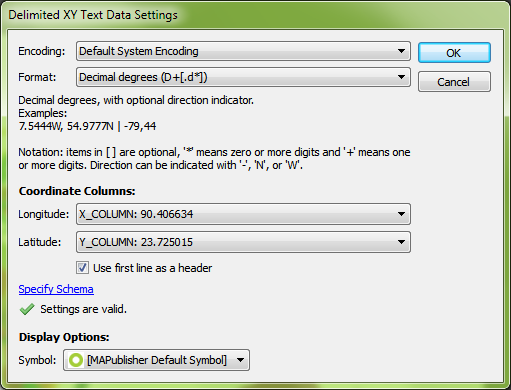 Back at the import window, we see the message ‘Data loaded successfully’. Great! Let’s click OK and add the large cities to the map.
 The data has been imported but the result isn’t what we expected. The new layer has been added to a new MAP View, so let’s try dragging it into the Robinson MAP View with the world map.
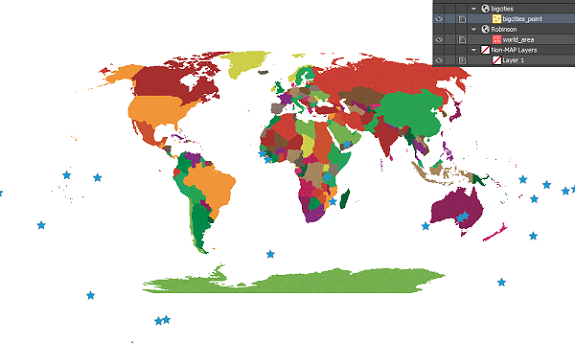 We get a prompt saying that there isn’t any coordinate system information. We want it to be in Robinson like the rest of the map so we’re going to leave the default setting of Same as: Robinson.
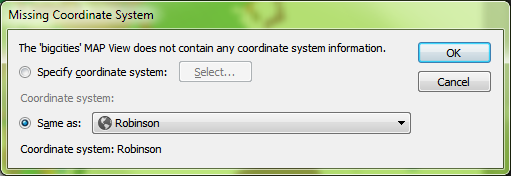 The data has moved, but it still doesn’t look like we were expecting. Where did we go wrong here?
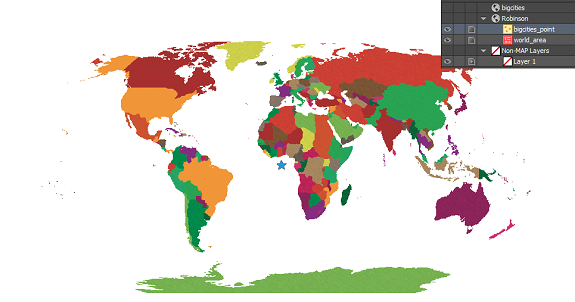 There are actually two places in the workflow where we could have avoided this common mistake. When we dragged the point layer into the Robinson MAP View, the pop-up dialog box prompted that a coordinate system wasn’t specified. We specified Same as: Robinson, thinking this was the correct choice, but we had already determined during import that the CSV was in WGS84. What we should have done here was to specify the coordinate system as WGS84.
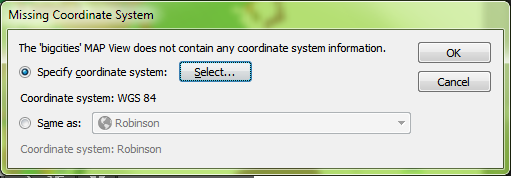 The other place where we could have avoided this error was right after setting up the CSV file for import. In MAPublisher 9.4, there’s a new button on the Import dialog box that allows you to see more detailed information about files being imported. By clicking the Advanced button in the Import dialog box, we would have noticed that there was no coordinate system specified.
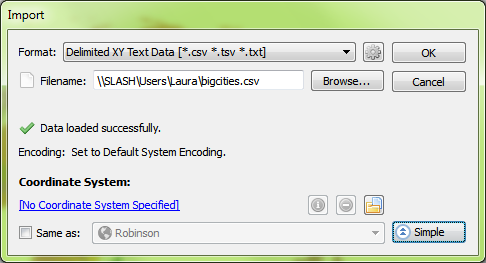 Even here, it might have been tempting to choose Same as: Robinson to add it to the Robinson MAP View, but this would import the points exactly the same as before – all in one location in the middle of the map. Instead, what we want to do is click the blue ‘No Coordinate System Specified’ link and choose WGS84. After this is set up, we’ll click OK to add the data to the map.
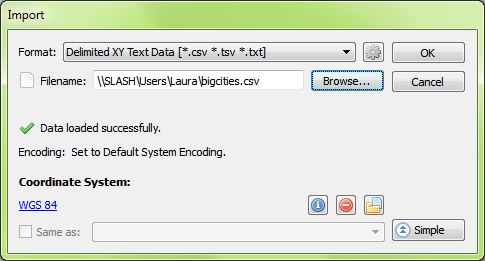 The data still isn’t quite right – it looks the same as when we first imported it. But again we notice that it has been imported into a new MAP View, so we’re going to drag the layer into the Robinson MAP View and see what happens.
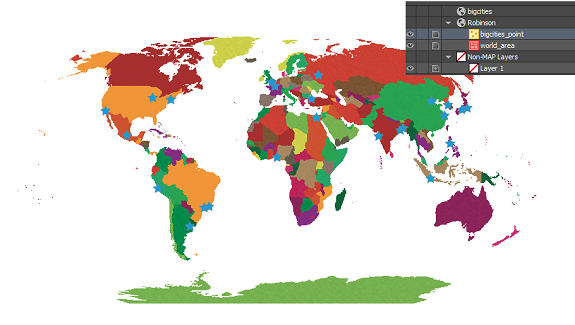 Mistakes during data import are common amongst GIS users, especially those who are just starting out. In the first scenario, when we imported the CSV and added the data directly to the Robinson MAP View, we thought we were telling MAPublisher that we’d like it to match up with the map. What we really did was tell MAPublisher that the data was already in the Robinson projection, even though we knew it was in WGS84. What we should have done first was to define the projection by telling MAPublisher what coordinate system the data is already using. Once MAPublisher knows what system the data is starting in, we can then ask it to project or transform the data into the coordinate system that we’d like to use.