We are proud to announce the start of a new video-focused blog series called Mapping Class. This blog series will curate tutorials and workflows created by cartographers and Avenza software users from around the world. We begin with a mapping workflow from Steve Spindler, a longtime MAPublisher user, and expert cartographer. He has shared with us his own take on creating Orthographic locator maps by applying some neat design tricks and utilizing MAPublisher’s powerful projection tools to create a simple, yet effective map.
Steve has produced a short video walkthrough demonstrating his process and has summarized the technique in the written article below.
***
Creating Orthographic Locator Maps by Steve Spindler
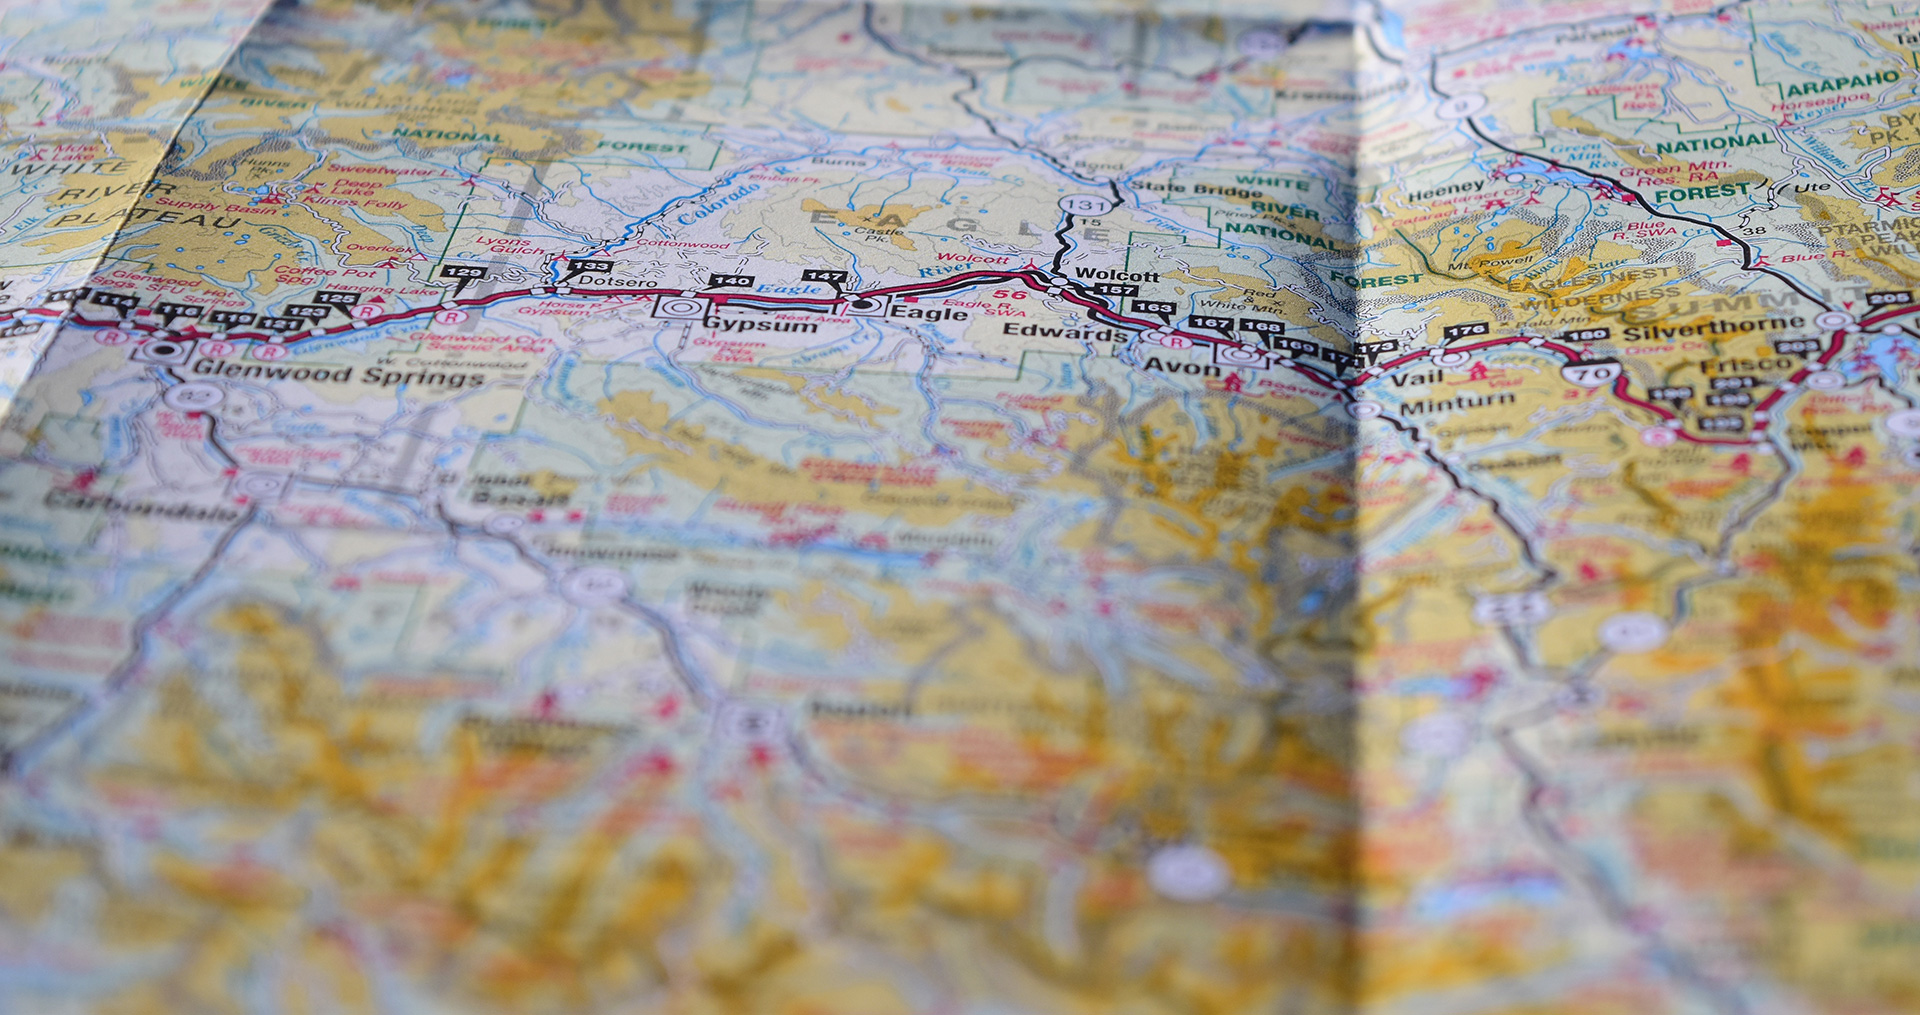
An orthographic map is like a view from space. It’s useful for directing attention to someplace on the planet.
This video shows how an orthographic locator map is made in Illustrator using MAPublisher. The template illustrator file I use in the video is here.
We’ll start off by locating Paris on the map using Find Places. We need the latitude and longitude to create two projections.
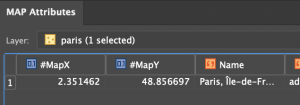
Next, get the Latitude and Longitude from Map Attributes. You’ll have to turn MapX and MapY fields on. MapX is longitude. MapY is Latitude.
In Map Views, click on the projection, (ne_110m_land), and then select “Perform Coordinate System Projection”.
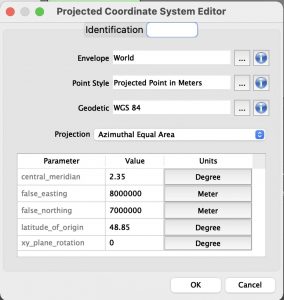
Select Projected Coordinate Systems and search for Azimuthal Equal Area. Duplicate, rename and set the definitions for the central meridian and the latitude of origin. There might be more than one. Pick one.
Select Projected Coordinate Systems and search for Orthographic. Duplicate, rename and set the definitions for the central meridian and the latitude of origin. There might be more than one. Pick one.
Select the new azimuthal projection, the one you created, and click OK to use it.
We use the azimuthal projection to crop data before creating the orthographic projection. Otherwise, there will be overlapping imagery. Next, create a buffer for the Paris point that is 10002.5 km around the point. This will be located on a new layer.
Use the path utilities tool to convert the bezier circle into polylines. Then reproject the map to the orthographic projection. Once completed, crop again with your circular buffer layer and delete the water layer. It will be replaced with a gradient.
Finally, add a radial gradient to the circular buffer layer and move the circle below the other layers.
Now you have an orthographic locator map that you can continue to style and label for your purposes.
***
About the Author
Steve Spindler has been designing compelling cartographic pieces for over 20 years. His company, Steve Spindler Cartography, has developed map products for governments, city planning organizations, and non-profits from across the country. He also manages wikimapping.com, a public engagement tool that allows city-planners to connect and receive input from their community using maps. To learn more about Steve Spindler’s spectacular cartography work, visit his personal website. To see the original tutorial article, or view Steve’s other mapping demonstrations, visit cartographyclass.com
Maps are a fusion of art and science, presenting complex geographical data in a way that is both visually appealing and informative. Cartographers use maps to convey a story, drawing attention to important information using carefully crafted design choices and curated map elements that engage the viewer. Although cartographers employ a variety of specialised techniques to present this meaningful information on a map, one of the simplest, yet most effective methods is through map labels.
Quite simply, map labels are symbols or texts strategically placed at specific locations on a map to identify important geographical features, locations, or areas of interest. To a map viewer, labels are a quick and easy way to know exactly what is shown on a map. To a map maker, however, the task of creating labels is not often quick and generally isn’t easy. This is especially true when there are a large number of labels that need to be placed, or when labels need to follow complex paths such as roadways, rivers, or trails. Map-makers must also consider the issue of label crowding and collisions, ensuring labels are not overlapping each other, covering or distracting from other important features of the map. Combined, these challenges can be a significant time-sink in the map-making process, requiring both time and effort on the part of the cartographer.
Labelling doesn’t have to be difficult though, and in this blog, we will show you how built-in MAPublisher label tools and the MAPublisher LabelPro add-on can make labelling simple.
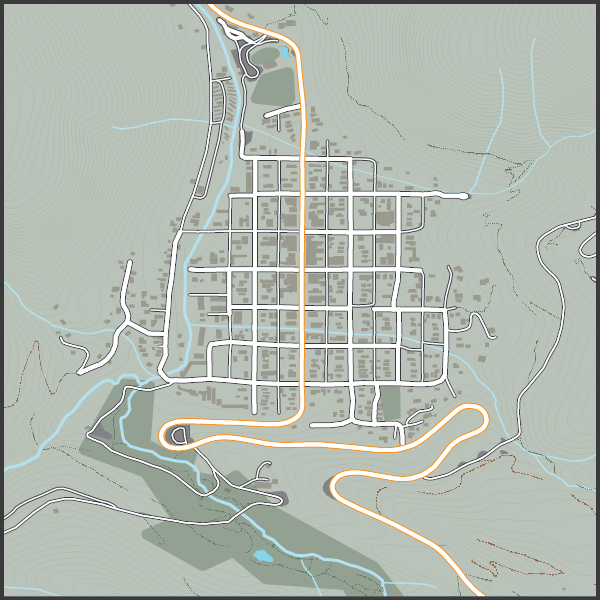
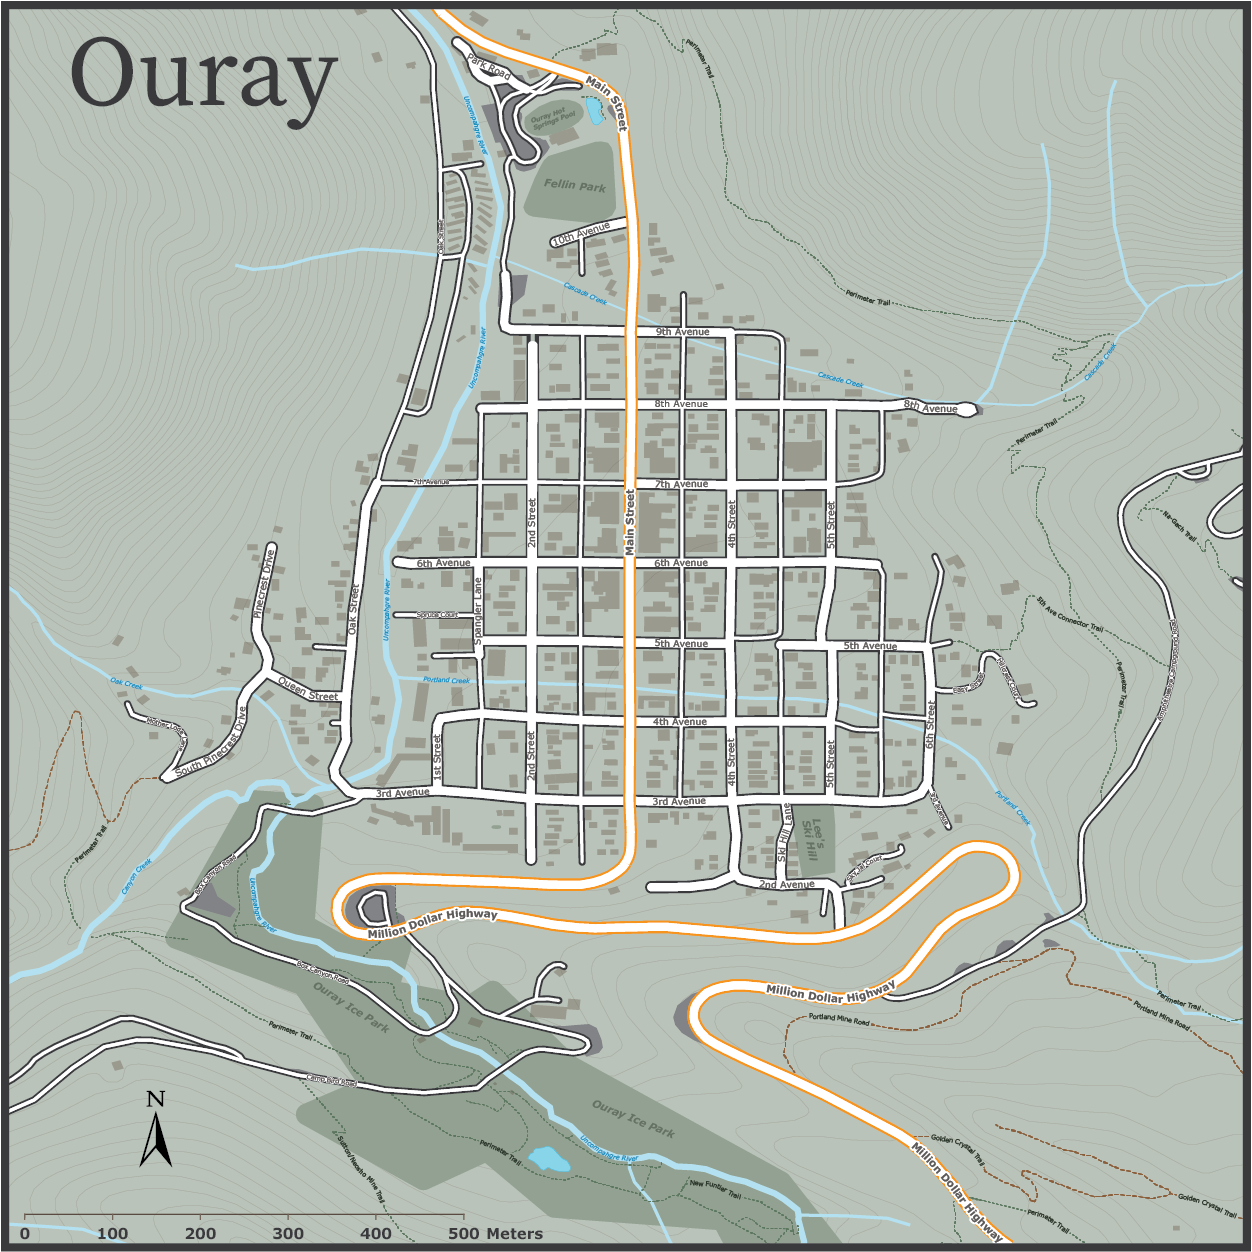
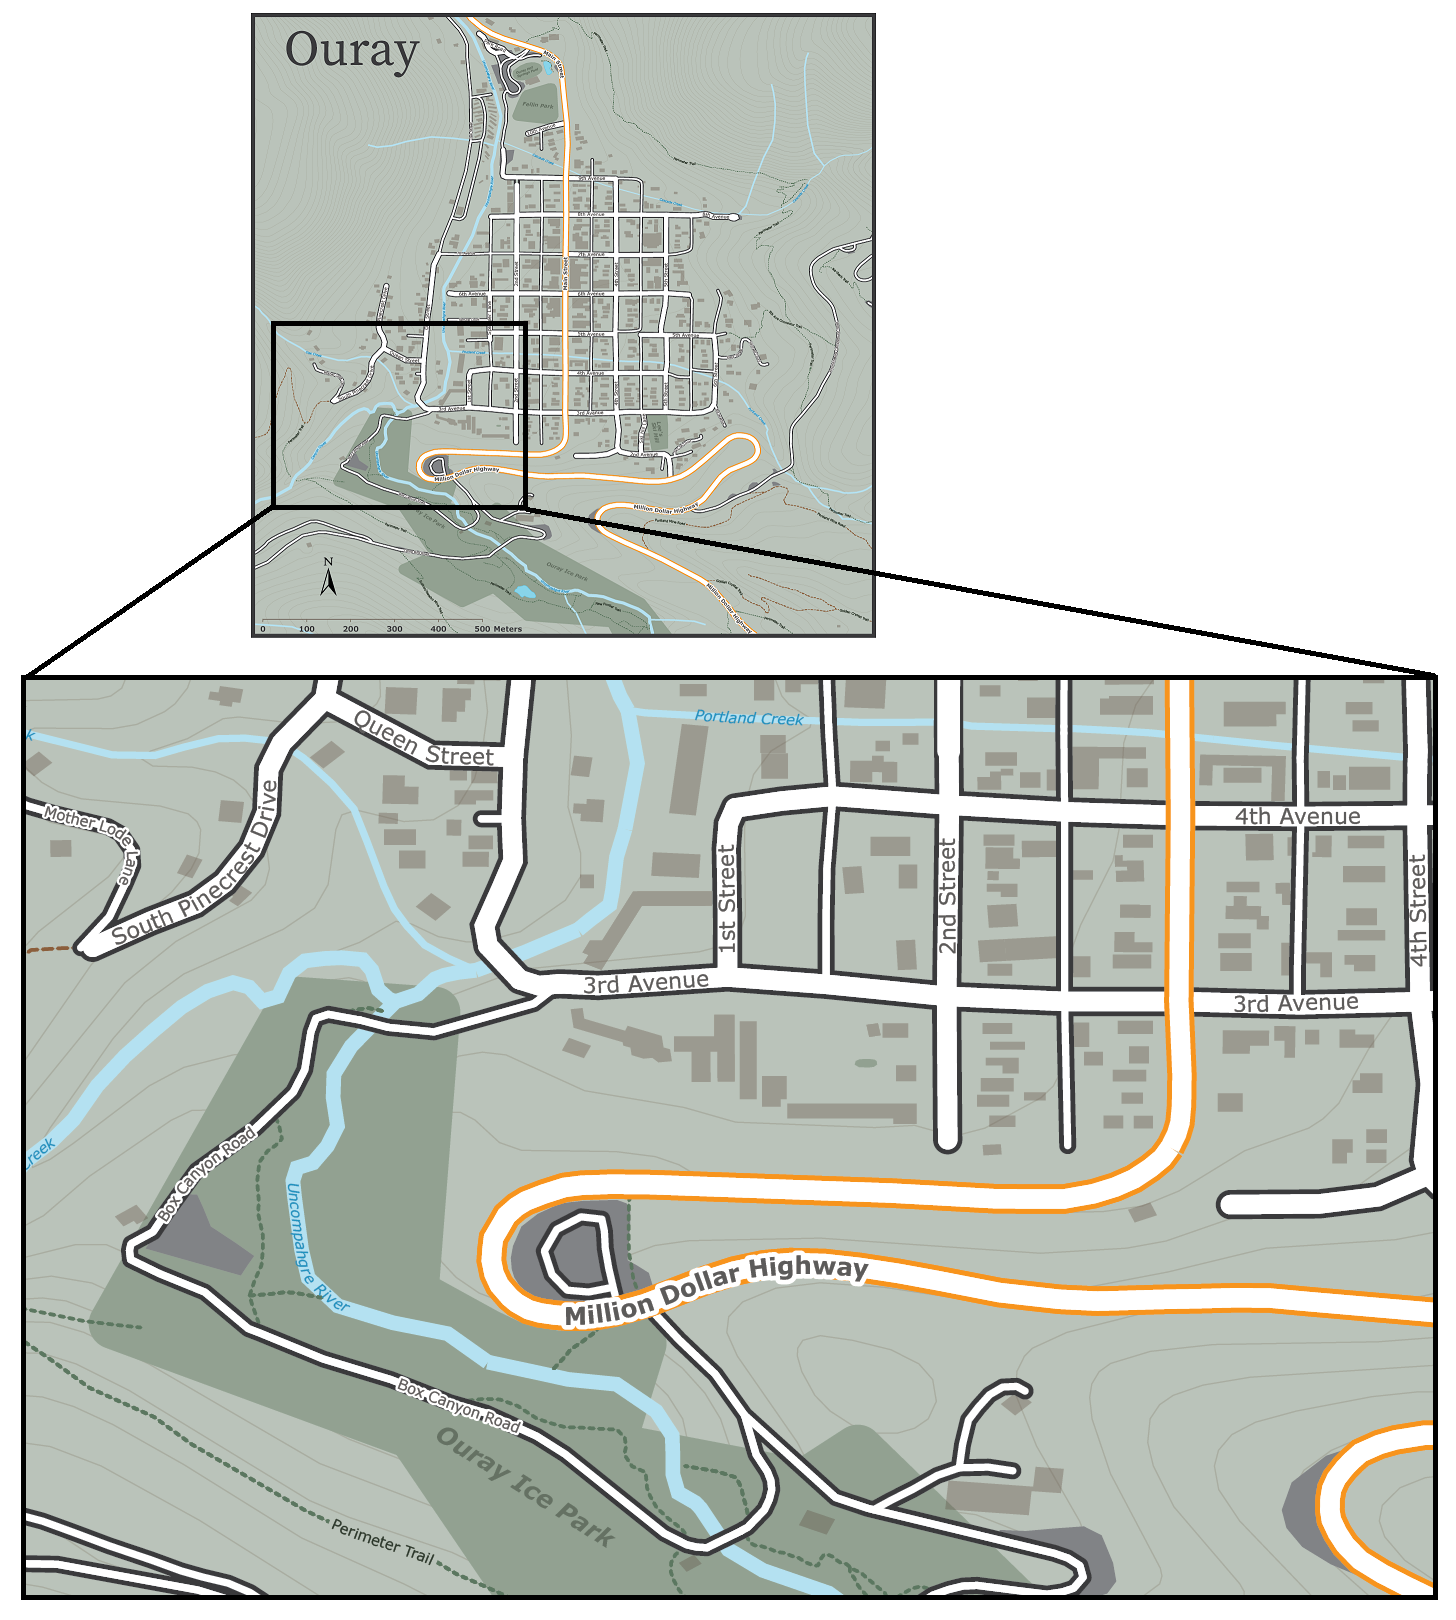
Let’s start with our unlabelled map. We have taken a collection of openly available geo-data depicting the small mountain town of Ouray, Colorado (home of National Geographic Cartographer and last month’s Avenza Cartographer Chronicles feature, Mike Boruta). We have stylized the data to show rivers, parks, streets and trails all throughout the town, but we feel labels would help a user to better understand the information being shown. We are going to approach the labelling process in a few different ways.
Manual Label Placement with the MAP Tagger Tool
For small labelling tasks, where a map maker might need to place only a handful of precisely located labels, the MAP Tagger tool is perfect for the job. MAP Tagger allows us to configure a basic set of options that control the character style of our label as well as general label placement rules. From there, we can simply click on a map feature and have the tool automatically detect and apply a label from attribute information contained in the selected layer. As we have direct control over the placement of every individual label, we can be extremely precise in choosing label placements that work for our map. Best of all, the tool automatically detects and applies text pathing for line features, meaning text labels can follow the form of any road, river, trail in your map!
When working with a small number of map features, the MAP Tagger tool is often just what you need to add well-placed labels to your map. For larger labelling tasks, such as our Ouray map, where there are many layers and several different features to be labelled, a manual approach such as this would be very time-consuming. Instead, we need to implement a more automated, batch labelling technique to speed-up the map-making process.
Batch label placement with the Label Features Tool
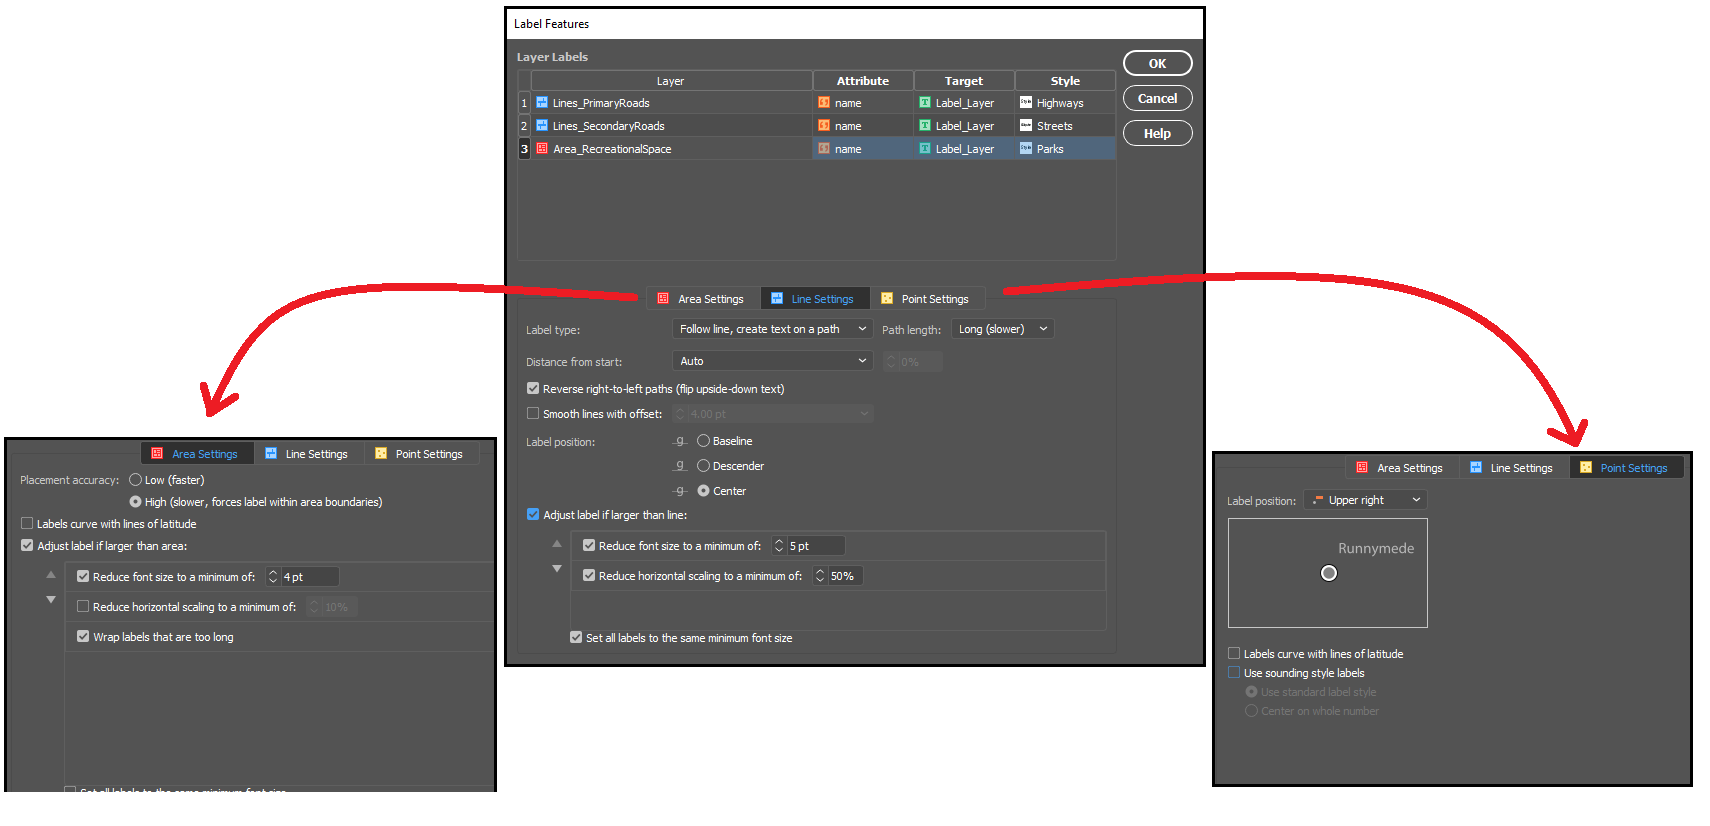
When you are working with several map layers, or have a large number of geographic features that each need to be labelled, it can be more efficient to create your labels all at once. The Label Features tool comes built-in with MAPublisher, and can handle batch labelling of map features with only a few clicks. The tool is designed similarly to MAP tagger, and automatically populates the map with precise, path-aligned labels, while offering the flexibility to define unique character styles for each map layer.
Taking a look at the tool, we were able to quickly generate over a hundred labels, for every road, trail, river, and park layer in our Ouray map. By nature, the tool will present you with a large number of labels for each feature, allowing us to examine and choose the labels we wish to retain and remove those that we don’t. With a little bit of clean-up to remove those extra or unwanted labels (see the animation below), we can already see our labelled map is coming together!
The Label Features tool is great for getting a head start on large labelling projects, but you might notice that the output of the labelling tool still requires some manual intervention to clean-up the output. For example, notice how “4th Street” and “5th Street” labels are repeated several times over the length of the street, with some labels colliding with others to create an overlap. This is a common problem in many labelling tasks and is due to the way our input data is structured. The dataset we obtained presents each road in the town as a line, but rather than present each road as a single continuous feature, it breaks up each street into several linked segments. Although this can be corrected with manual editing, it can still be time-consuming when working with a high number of labelled features. To avoid this, we need a method of achieving smarter batch label placement that can detect and reduce instances of label collision or redundancy.
Fortunately, we have one last trick up our sleeves that makes even the most complex labelling tasks a breeze. We can use MAPublisher LabelPro for collision-free, rules-based label placement.
Better Labelling with MAPublisher LabelPro
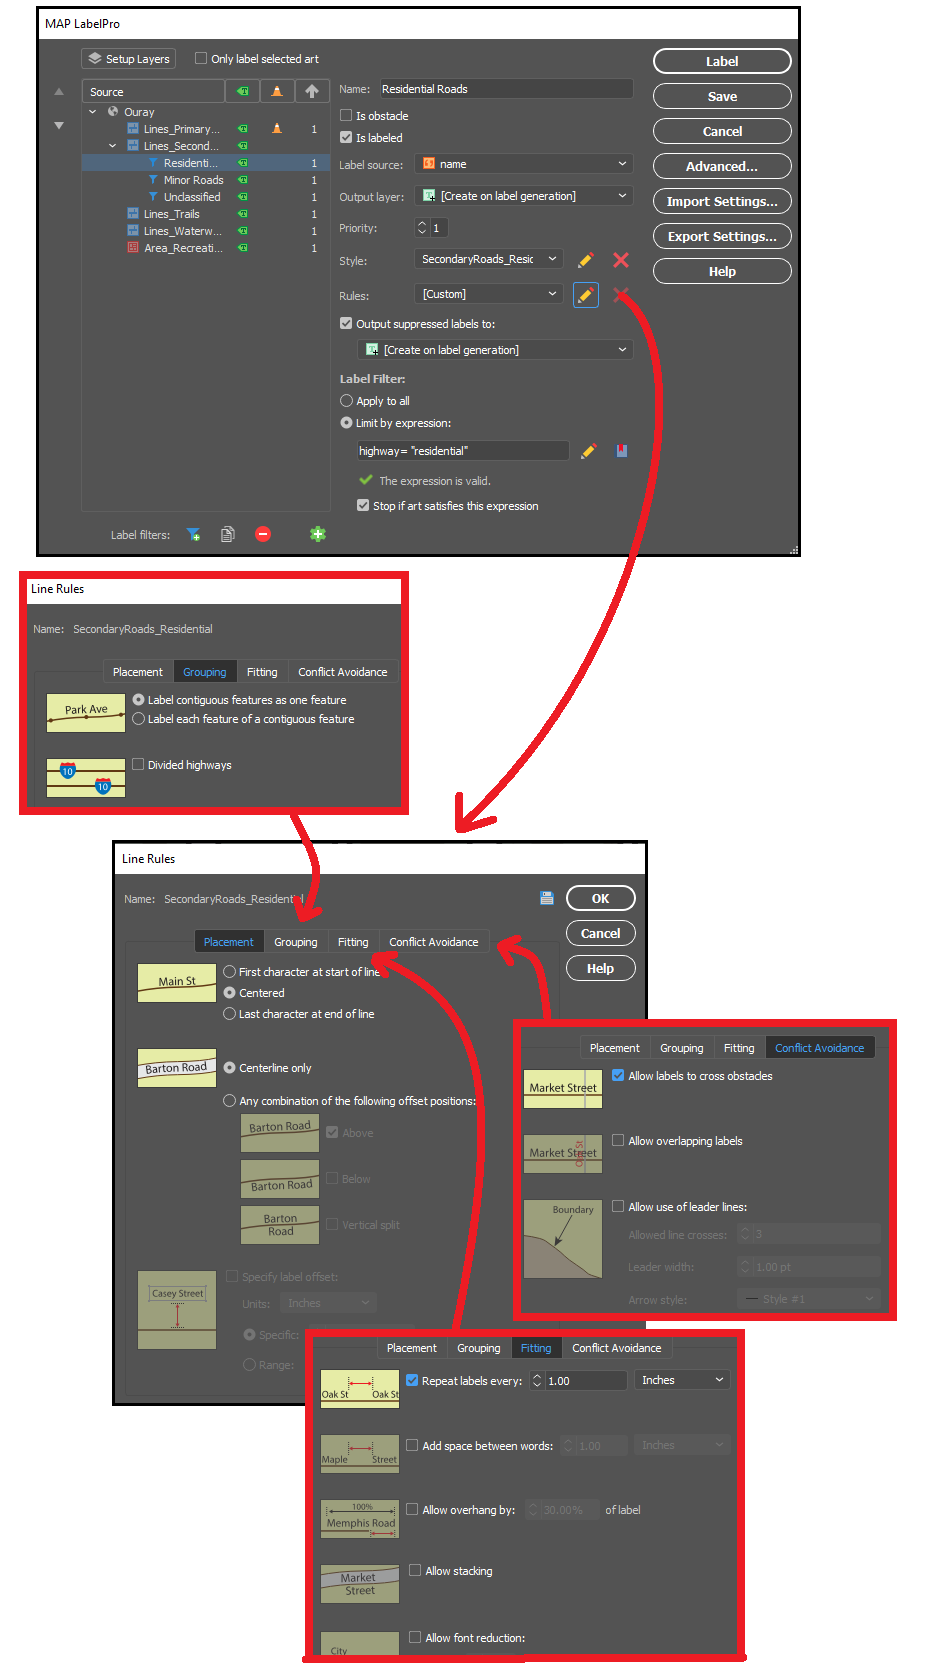
The MAPublisher LabelPro add-on allows the user to customize a wide variety of enhanced labelling options that result in smarter, more efficient label placement. LabelPro comes with a powerful purpose-built labelling engine that handles not only label placement, styling, and pathing, but also optimizes the grouping, fitting, and collision avoidance of labels to reduce crowding, avoid label overlap, and eliminate label redundancies.
Remember those overlapping labels we ran into with the Ouray map? With LabelPro we can set rules that treat street segments as contiguous features in a single line, meaning the labelling engine will efficiently place labels that are representative of the entire street, rather than just for each segment. The intelligent collision and fitting rules mean we can also prevent labels from overlapping each other or crowding the map, saving us time and effort by letting the tool handle precise label placement with minimal clean-up. By setting layer priorities designating certain layers as obstacles we can make sure our important labels are unobstructed, and other labels do not cross other features in a way that would confuse the map viewer.
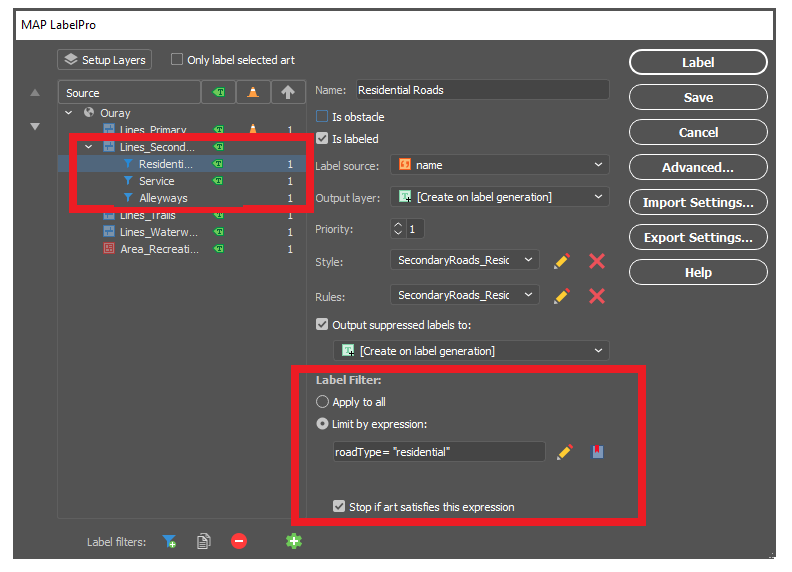
With LabelPro, we can also create expressions to apply conditional character styles and rules based on attribute values in the data. In our map, we created label filters for “Residential Roads”, “Service Roads”, and “Alleyways”, allowing us to label (or not label) certain road types differently, even though they are all contained in the same “secondary roads” map layer. These are only a few examples of the robust collection of configurable rules and smart labelling options available to tackle even the most complex labelling tasks.
With our rules set up and all character styles defined, in very short order we could automatically generate labels for all rivers, roads, highways, parks and trails in our Ouray map. The smart placement with LabelPro means we spend less time manually correcting label placement and allows us to produce maps more efficiently and easily. If you want to read a more in-depth, tutorial style article that shows you the exact steps we used to easily create our simple map of Ouray, check out this great workflow article produced by our support team – Here!
Data sources: All datasets were obtained from OpenStreetMap and the Ouray County Open Data portal.
We are happy to announce that MAPublisher 10.8, the latest update to the MAPublisher plug-in for Adobe Illustrator, is now available. With this release, we are excited to bring forward new usability enhancements for several MAPublisher tools. We are also thrilled to confirm that MAPublisher now supports raster files in the enhanced compression wavelet (ECW) format. Alongside these enhancements, we have also implemented improvements and added expanded support to our coordinate system library.
Here is what you can expect with the latest MAPublisher 10.8 release:
Usability Improvements for MAPublisher Tools
The Avenza team is always working to improve the capabilities of our vast suite of cartography tools. We work with our users to implement improvements to our tool catalog that truly meet the needs of actual mapping professionals. In this release we are introducing several enhancements to some of our existing tools:
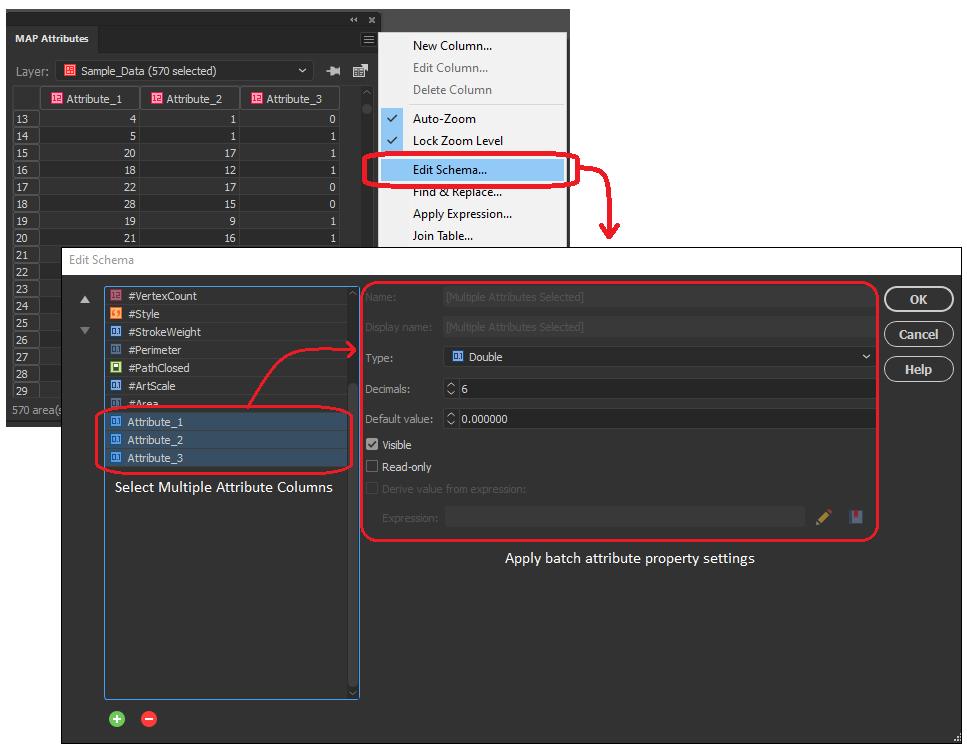
Multi-Column selections in the Attribute Table Editing Schema
In the early versions of MAPublisher 10, we added the ability to select multiple columns within the Edit Schema window of the MAP attributes panel, allowing users to toggle visibility settings on multiple attribute columns at the same time. Now with 10.8, we are delighted to build on this by implementing the ability to configure data properties across multiple selected attribute columns. Users can not only toggle visibility or remove multiple attribute columns at once, but can now also edit default values, attribute size, and read-only settings for all selected values. Additionally, users can now change the data type (i.e string, integer, boolean, etc) for multiple selected attribute columns all at once, as long as each column shares the same starting data type.
Select and add multiple MAP Locations in Line Plotter
We continue to bring improvements to the Line Plotter tool, this time by introducing the ability to select multiple MAP locations and add them to the line vertices (node) list. For users familiar with the Point-by-point plotting method in Line Plotter, this will be especially useful for adding a large collection of sequential MAP locations, as previously each point needed to be entered one at a time.
Document Summary Panel now includes “Last Saved with” Version Info
For users working with MAPublisher projects across different versions of the software, you will be delighted to know that the document summary dialogue now includes information indicating the version of MAPublisher the project was last saved with. This information will help users that frequently share MAPublisher projects with colleagues, allowing them to better establish version standards across collaborative projects.
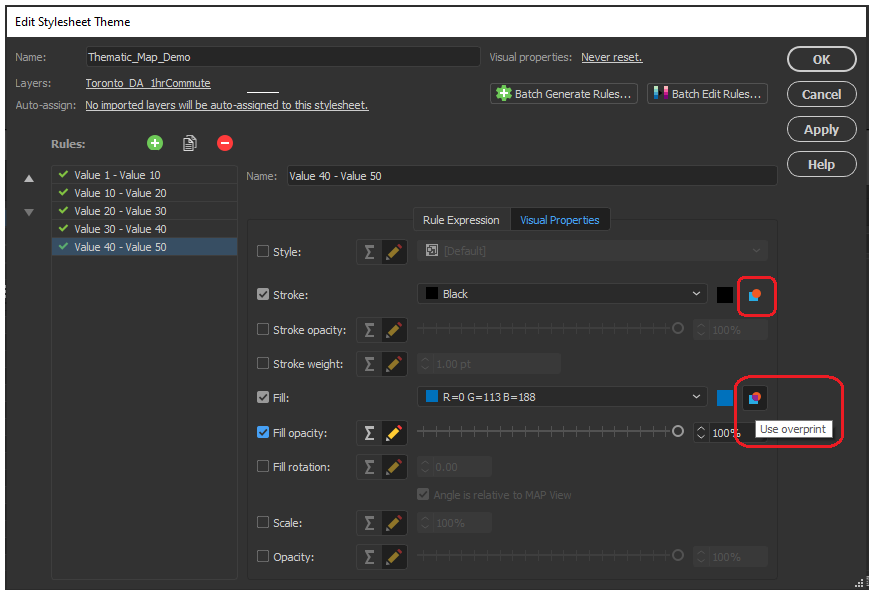
Overprint Options in MAP Themes
Previous versions of MAPublisher required a user to navigate the Illustrator attributes panel to configure overprint options for each map element individually and refer to these options separately using MAP Themes. Now with MAPublisher 10.8, an overprint option has been implemented directly within the MAP Themes panel, allowing users to configure overprint settings for fills and strokes within each stylesheet in the MAP Themes tool.
Scale bar, Create Legend, and Elevation Profile tool previews with Background Colours
We have added a small improvement to the scale bar, create legend, and elevation profile tool panel. The preview window for these tools, which allows users to adjust and edit their visual properties before adding them to the map, now has the option to configure a preview background colour. This option is helpful when configuring light, or white-coloured map elements which were previously difficult to see against the default white preview background.
Support for Raster ECW file formats
New to MAPublisher 10.8, we now include Enhanced Compression Wavelet raster files to our growing lists of supported data formats. Users can now import and work with ECW files directly within the MAPublisher environment of Adobe Illustrator, all while retaining necessary spatial integrity, and without needing to convert your data.
Engine Improvements and Updated Coordinate system catalogue
We are working continuously to improve the back-end MAPublisher engine to ensure our users can continue their work in an optimized, seamless, design-focused cartographic environment. Along with improvements to our engine and bug fixes, we have built on our current coordinate system catalogue with updates to the coordinate system and projection library. This means our list of supported projections has grown, with new additions including the Natural Earth and Natural Earth 2 Projections created by Tom Patterson. For a full list of our expanded coordinate systems library please check the projections guide in the Avenza Support center.
MAPublisher 10.8 is immediately available today, free of charge to all current MAPublisher users with active maintenance subscriptions and as an upgrade for non-maintenance users.
Find out more at the Avenza User Conference!
Want to learn more about MAPublisher? Want to see how industry professionals are using Avenza Products in their organizations? Join us on May 12th, 11am – 5pm (EST) for the first-ever Avenza User Conference. Registration is Free!
The event will feature a full day of speaker presentations from the Mapping and Geospatial communities. The Avenza Product teams will also be on hand to answer questions and give you a sneak peek of upcoming developments to the Avenza Platform. Sign up for free at avenza.com/user-conference
Toronto, ON, February 22, 2021 – Avenza Systems Inc., producers of the Avenza Maps® app for mobile devices and geospatial plugins for Adobe Creative Cloud®, including MAPublisher® for Adobe Illustrator®, is pleased to announce the release of Geographic Imager® 6.3. This latest version provides full compatibility with macOS 11 Big Sur, and introduces a new cloud licensing system to efficiently access and manage floating licenses across an organization without the need to set-up, deploy and manage a local server.
“Geographic Imager has built a reputation for providing a powerful suite of tools that seamlessly integrate into spatial imagery workflows built around Adobe Photoshop,” said Ted Florence, President of Avenza Systems. “By offering improved cloud licensing features and full compatibility with the latest macOS 11 release, Geographic imager continues to provide the productive, reliable user experience our customers have come to trust and rely upon”
Powering the Geospatial Imagery Editing Process
Geographic Imager for Adobe Photoshop® delivers an all-encompassing solution to import, edit, and export geospatial images such as aerial and satellite imagery. Work with digital elevation models, GeoTIFFs, and other popular GIS image formats while using Adobe Photoshop® features such as transparencies, filters, cropping, and image adjustments; all while maintaining georeferencing and support for hundreds of coordinate systems and projections.
New features of the Geographic Imager 6.3 plugin for Adobe Photoshop® include:
macOS 11 compatibility: Fully compatible with macOS 11 Big Sur
Cloud-based floating licenses: Access floating licenses easily with RLM Cloud
Chinese UXP update: Geographic imager 6.3 (Chinese Version) now uses Adobe’s new Unified Extensibility Platform (UXP)
Geographic Imager 6.3 is immediately available and free of charge to all current Geographic Imager Maintenance Program members and starts at US$349 for non-maintenance upgrades. New fixed licenses start at US$749. Geographic Imager Basic Edition licenses start at US$99. Academic, floating, and volume license pricing is also available. For more information, visit www.avenza.com/geographic-imager.
More about Avenza Systems Inc.
Avenza Systems Inc. is an award-winning, privately held corporation that provides cartographers and GIS professionals with powerful software tools to make better maps. In addition to desktop mapping software, Avenza offers the mobile Avenza Maps app to sell, purchase, distribute, and use maps on iOS and Android devices. For more information, visit www.avenza.com.
As part of GeoIgnite 2021, this workshop will offer a deep-dive into the Avenza Maps app, a mobile app where users can upload or access custom maps for offline navigation, way-finding, and data collection. The workshop will be composed of five modules covering the fundamentals of the app’s usage, as well as more advanced industry-relevant features. We will also provide a walk through of using the Avenza Map Store to share your maps, and a sneak peak at upcoming features to be released this year.
Module 1: An Introduction to Avenza Maps (15min)
Module 2: Avenza Maps for Professional Use (25 Min)
Module 3: Avenza Maps for Recreational Use (25 Min)
Module 4: Sharing maps with the Public: Hosting Custom maps on the Avenza Map Store (25min)
Module 5: New Horizona: A preview of upcoming features and new tools (25min)
Key Learning Points
Learn about the offline capabilities of Avenza Maps
Learn how the Avenza Maps platform is used by many organizations as a mobile mapping solution
Learn directly from the Avenza Maps team about the latest and upcoming product features and updates
Presenters
Spencer Elford, Product Marketing Coordinator
Justin Baradi, QA Specialist, Mobile
Felipe Gonzalez-Macqueen, Map Store Business Development
We are happy to announce that Geographic Imager 6.3 is now available. This release brings continued improvements to compatibility with Adobe Photoshop 2021, and now offers full compatibility with the latest Mac OS 11 Big Sur release. We are also excited to introduce a brand new and easy way to access floating licenses directly from the cloud!
Here is what you can expect with the latest Geographic Imager 6.3 release:
macOS 11 Big Sur Compatibility
Users will be delighted to see that Geographic Imager 6.3 is now fully compatible with macOS 11 Big Sur. This means new and existing users can transition to the latest macOS without any interruption in their Geographic Imager capabilities.
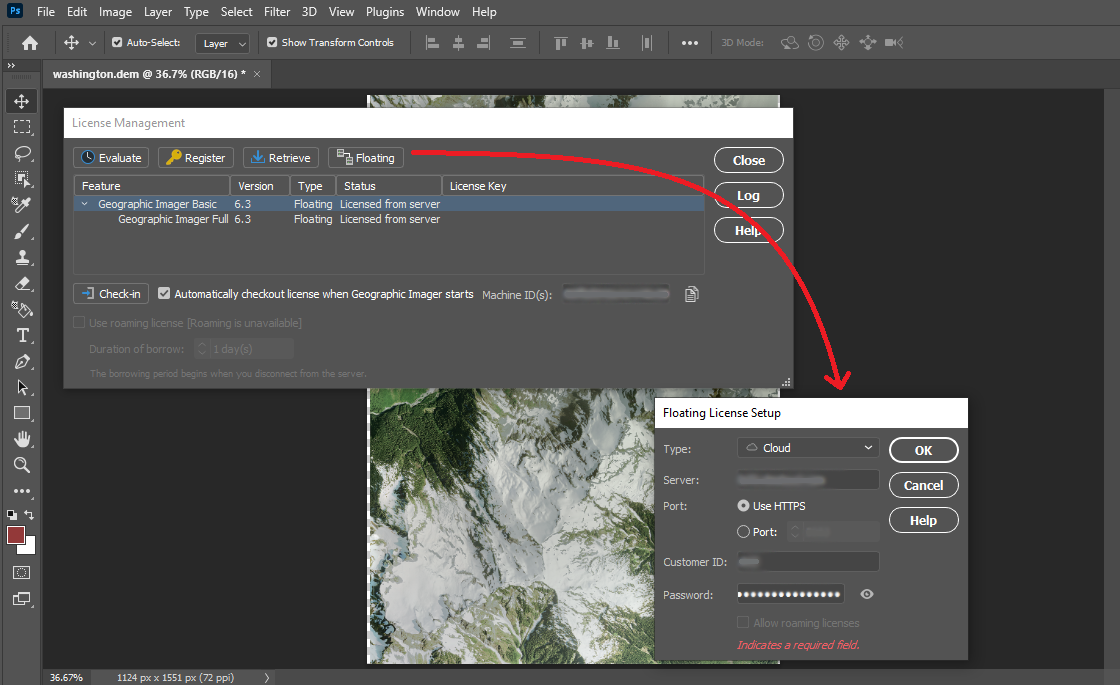
Cloud Floating Licenses: A Better Way to Manage and Checkout Licenses
We have worked hard to deliver a newly improved floating license management system as part of Geographic Imager 6.3. This new license management system greatly improves on previous versions and allows users and administrators within an organization to efficiently and seamlessly access floating licenses directly from the cloud. The new licensing system is built on the RLM Cloud platform and means floating licenses can be implemented without the challenges of setting up, deploying, and managing a local server. Contact our Sales team to learn how you can set up your cloud floating licensing.
See the new cloud licensing options by accessing the license management panel within Geographic Imager 6.3
UXP Implementation for Chinese Versions of Geographic Imager 6.3
The Chinese version of Geographic Imager 6.3 now implements Adobe’s new powerful Unified Extensibility Platform. Which provides user interface improvements and flexibility to develop new tools in the future.
Geographic Imager Available Now
All active maintenance subscribers can upgrade to Geographic Imager 6.3 today for free. Users without an active maintenance subscription or on a previous Geographic Imager version can still upgrade.
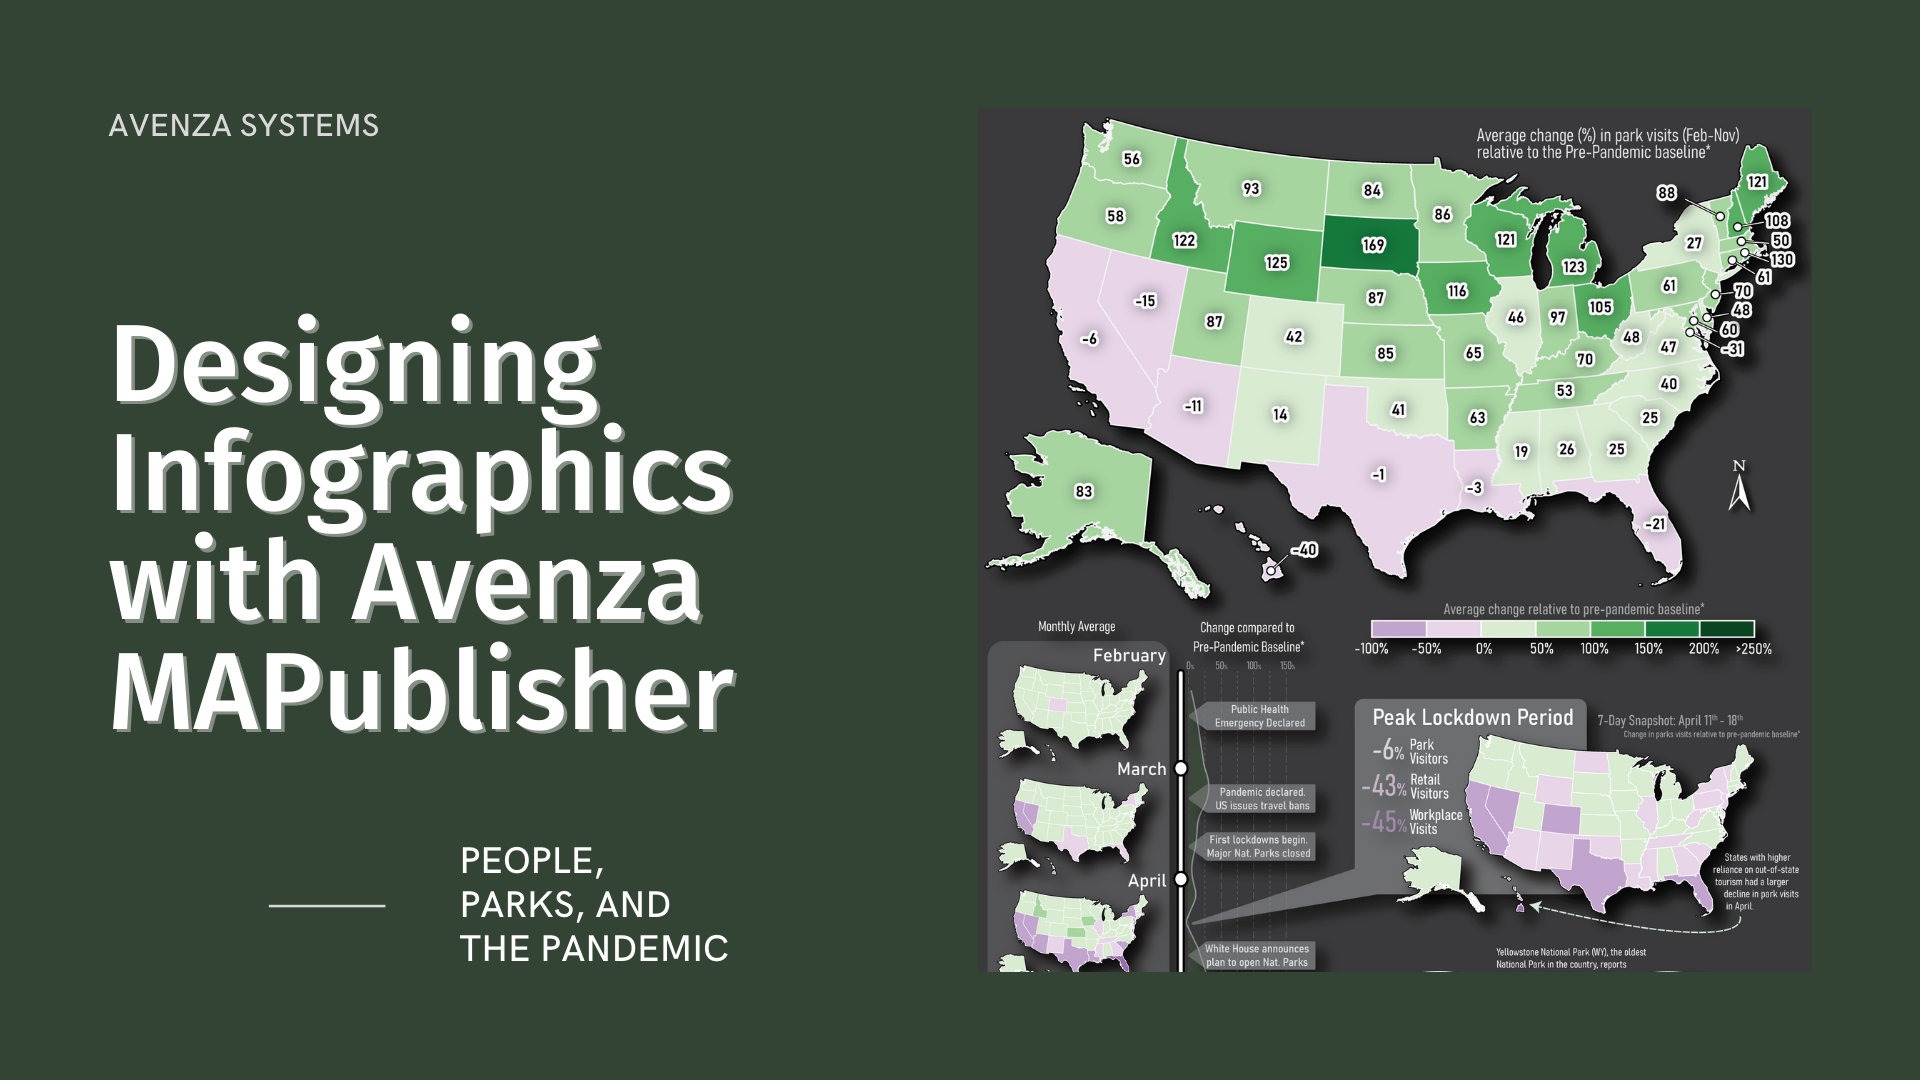
Here at Avenza, we love finding interesting data and using it to create engaging maps. In this blog, we show you how we used the powerful spatial data manipulation and cartographic styling tools found in MAPublisher for Adobe Illustrator to create an infographic exploring how park visitor patterns changed in the United States in 2020 using a truly interesting openly available dataset.
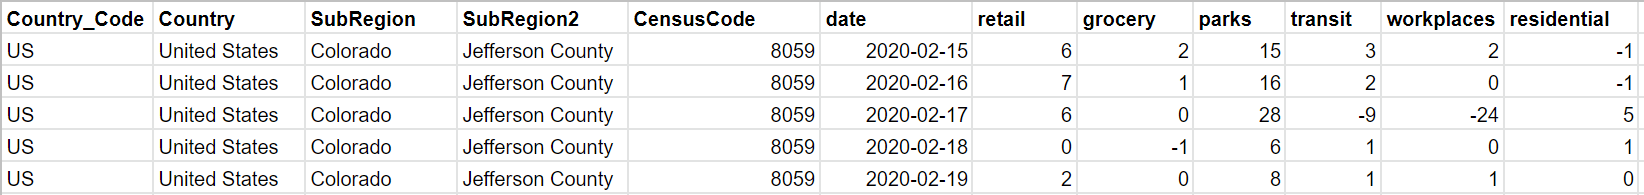
Recently, Google made its COVID-19 Community Mobility Reports public. These reports use aggregated anonymous mobile GPS data to explore how global human activity patterns in specific location categories (parks, retail, transit, residential, workplaces, and grocery) changed as a result of the ongoing pandemic. The U.S. dataset is massive, containing estimates of daily visitor activity for each location category in every county. Each data point provides an estimate of that day’s percentage increase or decrease in visitors relative to a pre-pandemic baseline period, meaning the data reflects how pandemic restrictions on that day may have impacted park space usage in that specific location. Below shows a sample of the raw dataset, listing five data points covering Feb 15-19th activity patterns in a single Colorado county.
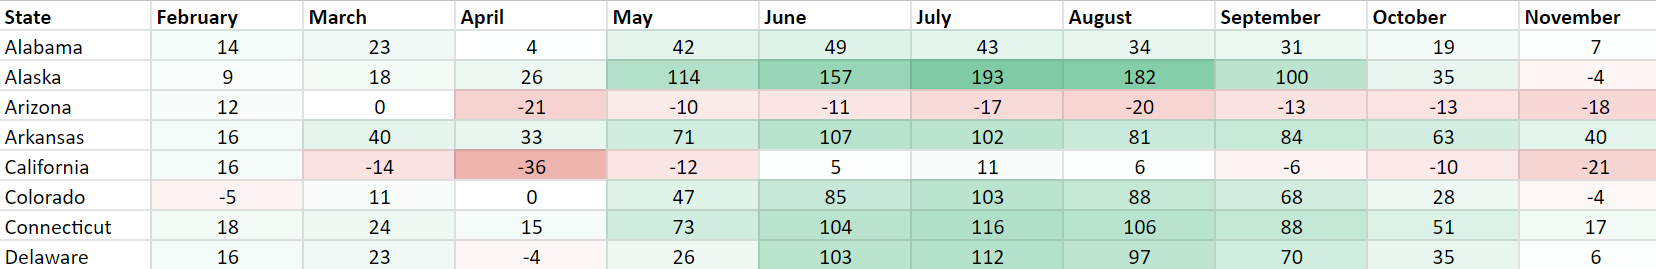
We downloaded the complete dataset (February to November 2020) from Google’s mobility reports data portal. The dataset contains nearly 900,000 records of all 3,143 counties in the U.S. We wanted our infographic to focus on the parks category, which includes every national, state, and local park, as well as public forests, campgrounds, beaches, marinas, dog parks, and gardens. Using the open-source statistical programming language R, we were able to aggregate the dataset into a more manageable size. Below, you can see how some basic filtering of these “cleaned” datasets already shows evidence of some interesting patterns, but we felt that mapping the dataset would be much more engaging.
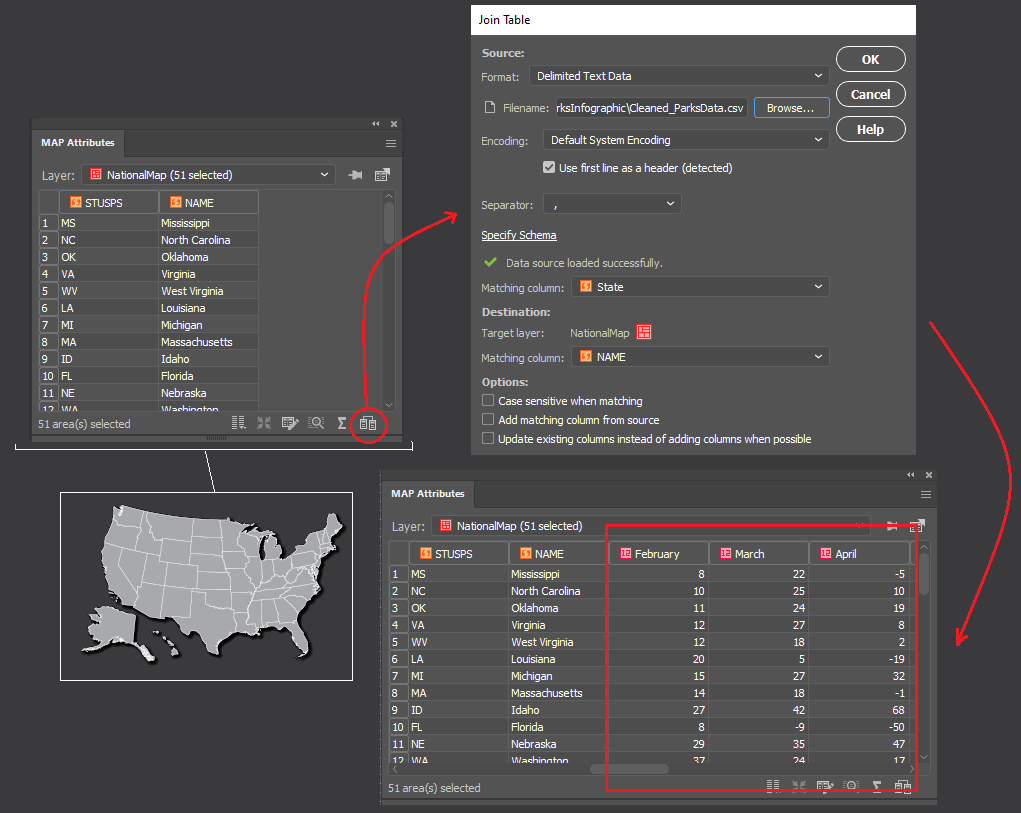
Maps are powerful story-telling tools, and we felt this data would be more interesting if you could see how park visitor patterns changed not only with time but also with geography. To make working with map data in Adobe Illustrator easier, we used the MAPublisher Import tool to load in a shapefile of U.S. state boundaries. The tool allows us to treat our dataset as a fully functional graphic element in Illustrator while still retaining all geographic properties integral to spatial data (attributes, topology, and coordinate systems).
To visualize the data as a map, we needed a way to associate each record in our tabular dataset to a specific location (in this case, a State). To do this, we used the Join tool, which takes our “cleaned” tabular parks dataset (stored as a CSV file), and links it to our mapped states shapefile using the shared State names column.
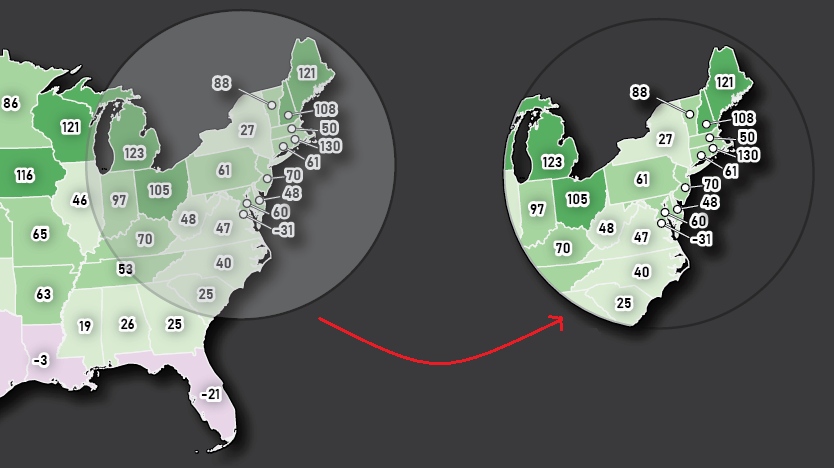
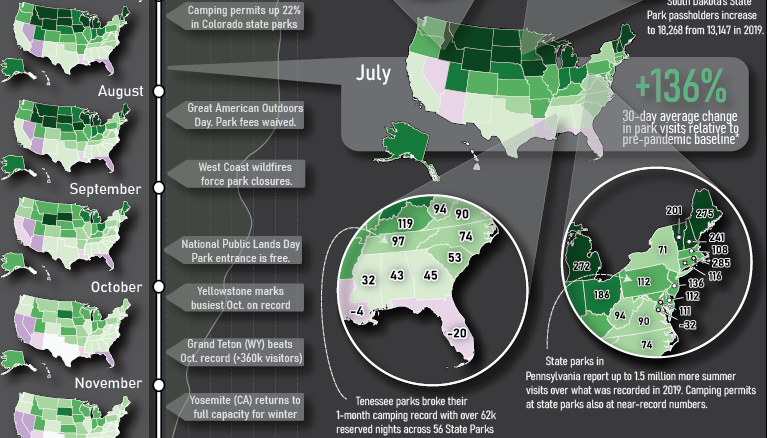
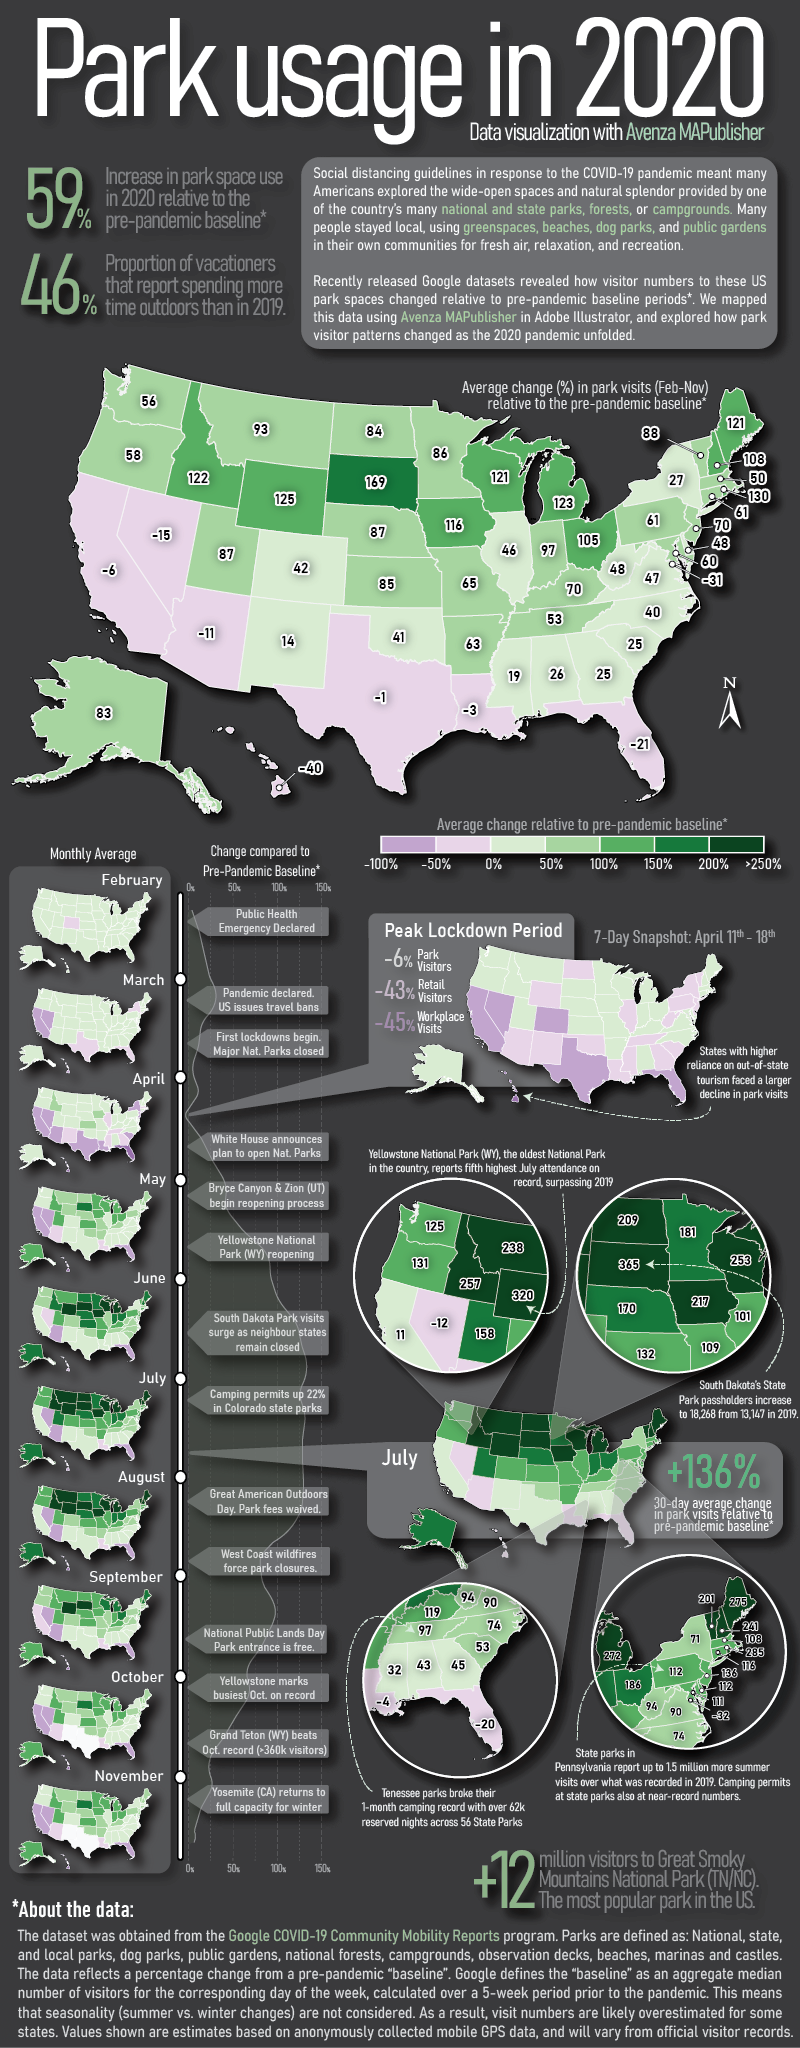
We started to think about how to design the layout of the infographic (this is where having a mapping environment in Illustrator really shines). We wanted it to consist of three main parts: a large labelled map showing the average change in park visits over the entire year; a vertical series of maps showing how park visits varied month to month; and a handful of pop-out maps with insets highlighting specific points in the year and specific regions of the country.
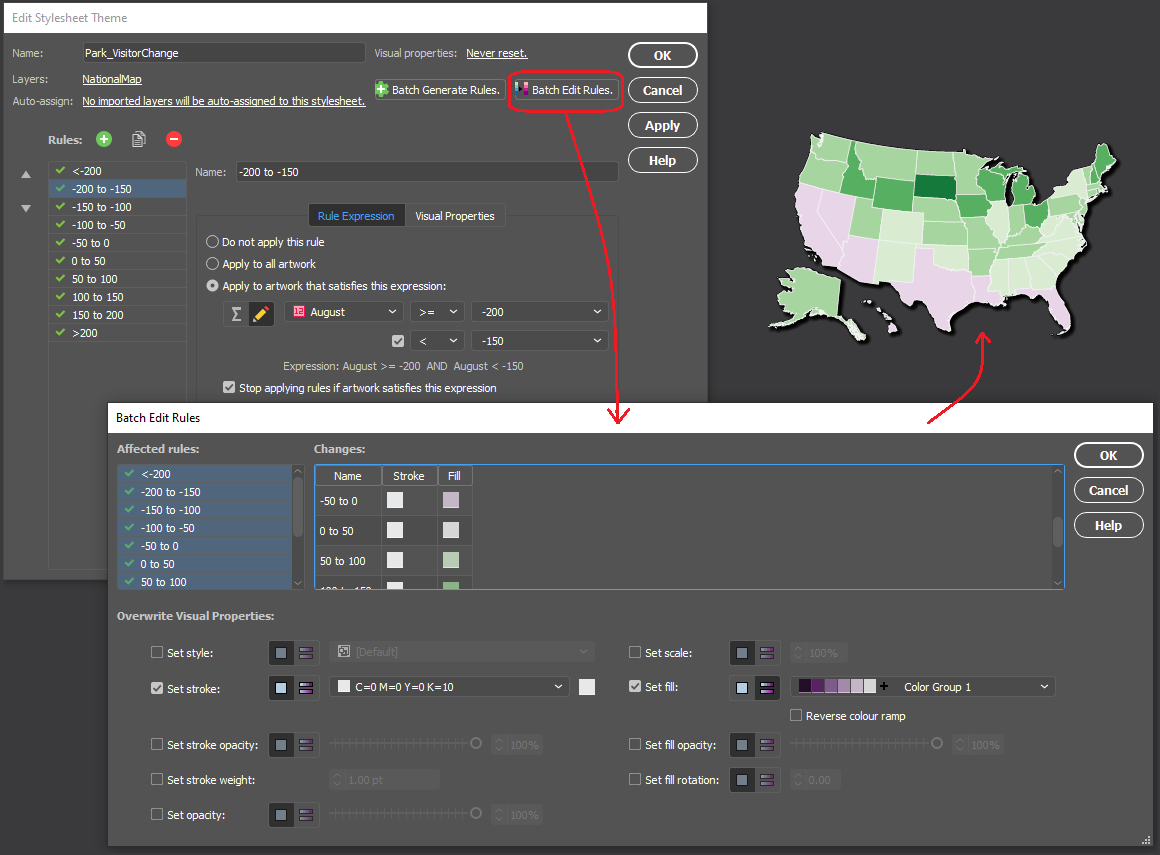
We chose to stylize the data into thematic maps, which use colour to represent specific values in the data at different locations. Instead of tediously configuring individual colour fills, we used MAP Themes to establish a rules-based stylesheet that applies a colour automatically to each State based on the monthly park visitor columns stored in the map layer’s attribute table. We chose a “thematic map” colour group from the included ColorBrewer 2 swatch library to best show positive and negative changes in park usage.
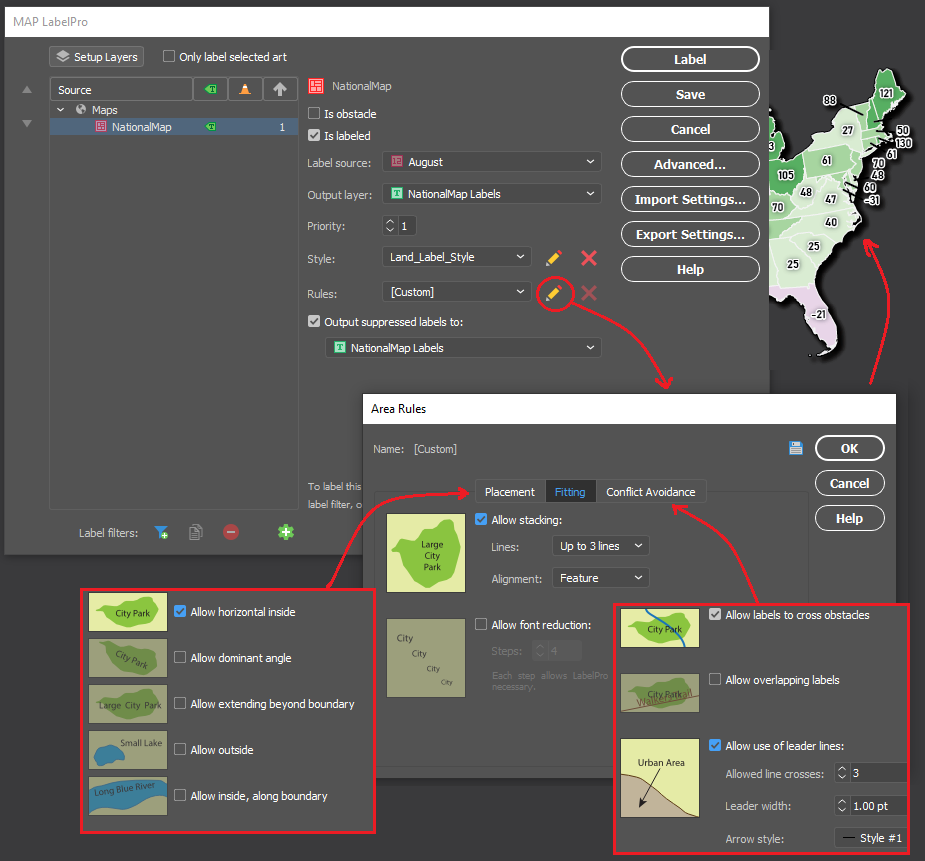
Next, we populated our main map with labels showing the percentage change in park use for each state. As many cartographers know, placing and configuring labels can be a significant time sink. Fortunately, we could use the MAPublisher LabelPro add-on to provide collision-free, rules-based label placement. We could configure the label rules to automatically handle collisions, alignment, and placement of labels for each state. Using the leader lines option in the LabelPro Rules panel, we were even able to create offset labels that prevent crowding the map.
Finally, we decided that to create some insets to highlight specific parts of the country. From a “master” map, we used the Crop to Shape tool to crop the map data to our desired inset extents. Using Crop to Shape is quick, and also retains the styling elements (colours, labels, strokes), topology, and attribute integrity of the cropped map layers.
With most of the maps completed, all that was left was to populate the infographic with text and graphics. Using the MAPublisher layout tools, we added a functional North Arrow and customized the automatically generated legend layer to suit our infographic’s design. Lastly, we used an Illustrator graph tool to create a vertical line graph of park activity along the left side of the infographic.
Presenting the dataset in this way makes it much easier to extract insights and craft a story from the data. Some patterns are immediately noticeable, such as the overall increase in park space usage that is observed for most of the US during the pandemic period. This isn’t exactly unexpected, as parks were one of the most accessible forms of leisure activity and recreation amid widespread social distancing and retail/entertainment closures. We also see how state-specific factors may have affected park usage in different regions of the country at different times. Some states, such as South Dakota, had eased restrictions on out-of-state visitors to their park systems, resulting in a spring season surge in park usage earlier than their neighbours. Conversely, states which typically draw a high proportion of international tourists, such as California, Hawaii, and Florida, saw more of a decrease in average park usage as a result of global air travel decline. These patterns and stories are one of many that can be identified, providing compelling examples of why maps are such powerful tools for visualizing data.
The beauty of working with MAPublisher to create this map-heavy infographic is that we were able to implement the powerful mapping and data manipulation tools of a dedicated GIS while seamlessly integrating the advanced art and design tools offered by the Adobe Illustrator graphical environment. Together, these tools turned what would have been a complex workflow of importing and exporting data between different software, and allowed us to create the entire infographic in a single mapping and design-focused fully integrated workspace.
Toronto, ON, December 14, 2020 – Avenza Systems Inc., producers of the Avenza Maps® app for mobile devices and geospatial plug-ins for Adobe Creative Cloud, including Geographic Imager® for Adobe Photoshop®, is pleased to announce the release of MAPublisher® 10.7 for Adobe Illustrator®.
This MAPublisher release improves on continued compatibility with Adobe Illustrator 2021 and macOS Big Sur. Product licensing improvements include a new Cloud floating license for easier setup for both admin and end-users. “Over the past several quarters, we have geared ourselves up for some major enhancements and have been working closely with our product partners at Adobe,” said Ted Florence, President of Avenza. “We’ve learned a lot and are continuously exploring more product features in the latest Adobe releases to bring them to our community of mapping professionals.”
Enhancements and new features of MAPublisher 10.7
Compatible with Adobe Illustrator 2021 on Mac and Windows
Compatible with macOS 11 Big Sur
Access Floating licenses from the Cloud
User interface and usability enhancements
MAPublisher 10.7 is immediately available free of charge to all current MAPublisher users with active maintenance and as an upgrade for non-maintenance users starting at US$599. New licenses are available from US$1399. MAPublisher FME Auto and MAPublisher LabelPro are also available as add-ons starting at US$399. Academic, floating, and volume licences are also available. Prices include one year of full maintenance. Visit www.avenza.com/mapublisher for more details.
More about Avenza Systems Inc.
Avenza Systems Inc. is an award-winning, privately held corporation that provides cartographers and GIS professionals with powerful software tools to make better maps. In addition to desktop mapping software, Avenza offers the mobile Avenza Maps app to sell, purchase, distribute, and use maps on iOS and Android devices. For more information, visit www.avenza.com.
Plan to attend the 34th WLIA Annual Conference, which will now take place virtually during the week of February 15-19, 2021.
The WLIA is planning an exceptional annual conference experience — an event that will provide workshop learning opportunities, exceptional educational content, networking opportunities, a focus on sponsors and exhibitors, special interest group gatherings, the map contest, words from expert keynote speakers, and much more.
Avenza is representing Canada with its mapping solutions to help in forest fire fighting and prevention in Brazil and will be connecting with experts on how to best use Avenza technology for firefighting and forestry. This event is organized by Global Affairs Canada