


Here at Avenza, we love finding interesting data and using it to create engaging maps. In this blog, we show you how we used the powerful spatial data manipulation and cartographic styling tools found in MAPublisher for Adobe Illustrator to create an infographic exploring how park visitor patterns changed in the United States in 2020 using a truly interesting openly available dataset.
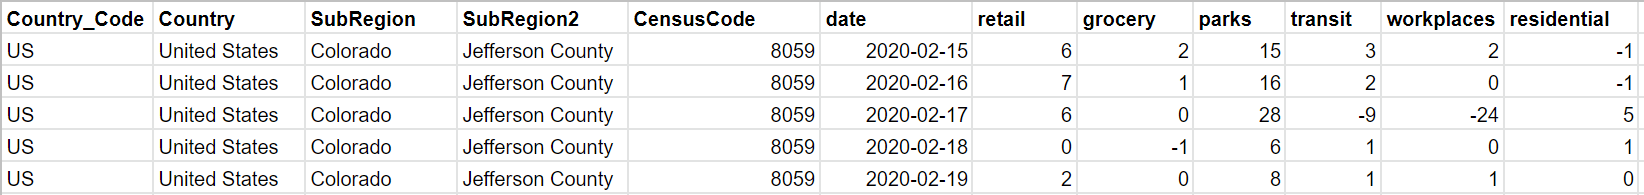
Recently, Google made its COVID-19 Community Mobility Reports public. These reports use aggregated anonymous mobile GPS data to explore how global human activity patterns in specific location categories (parks, retail, transit, residential, workplaces, and grocery) changed as a result of the ongoing pandemic. The U.S. dataset is massive, containing estimates of daily visitor activity for each location category in every county. Each data point provides an estimate of that day’s percentage increase or decrease in visitors relative to a pre-pandemic baseline period, meaning the data reflects how pandemic restrictions on that day may have impacted park space usage in that specific location. Below shows a sample of the raw dataset, listing five data points covering Feb 15-19th activity patterns in a single Colorado county.
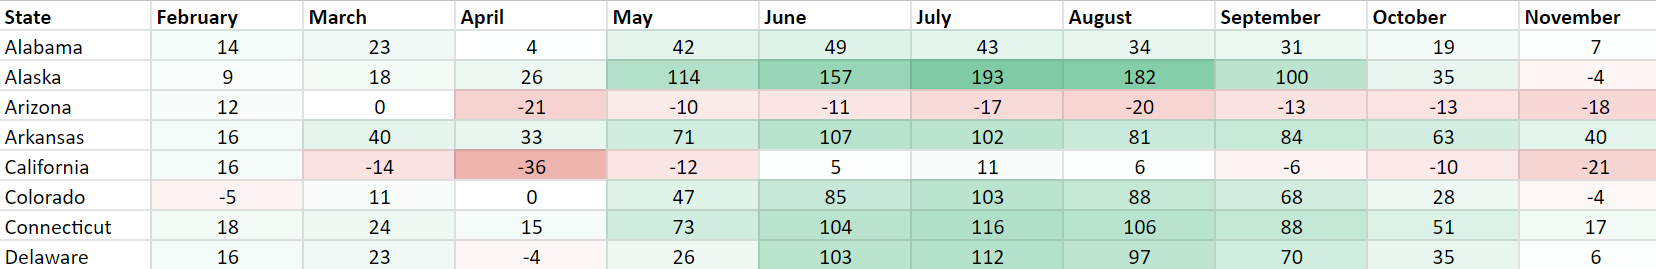
We downloaded the complete dataset (February to November 2020) from Google’s mobility reports data portal. The dataset contains nearly 900,000 records of all 3,143 counties in the U.S. We wanted our infographic to focus on the parks category, which includes every national, state, and local park, as well as public forests, campgrounds, beaches, marinas, dog parks, and gardens. Using the open-source statistical programming language R, we were able to aggregate the dataset into a more manageable size. Below, you can see how some basic filtering of these “cleaned” datasets already shows evidence of some interesting patterns, but we felt that mapping the dataset would be much more engaging.
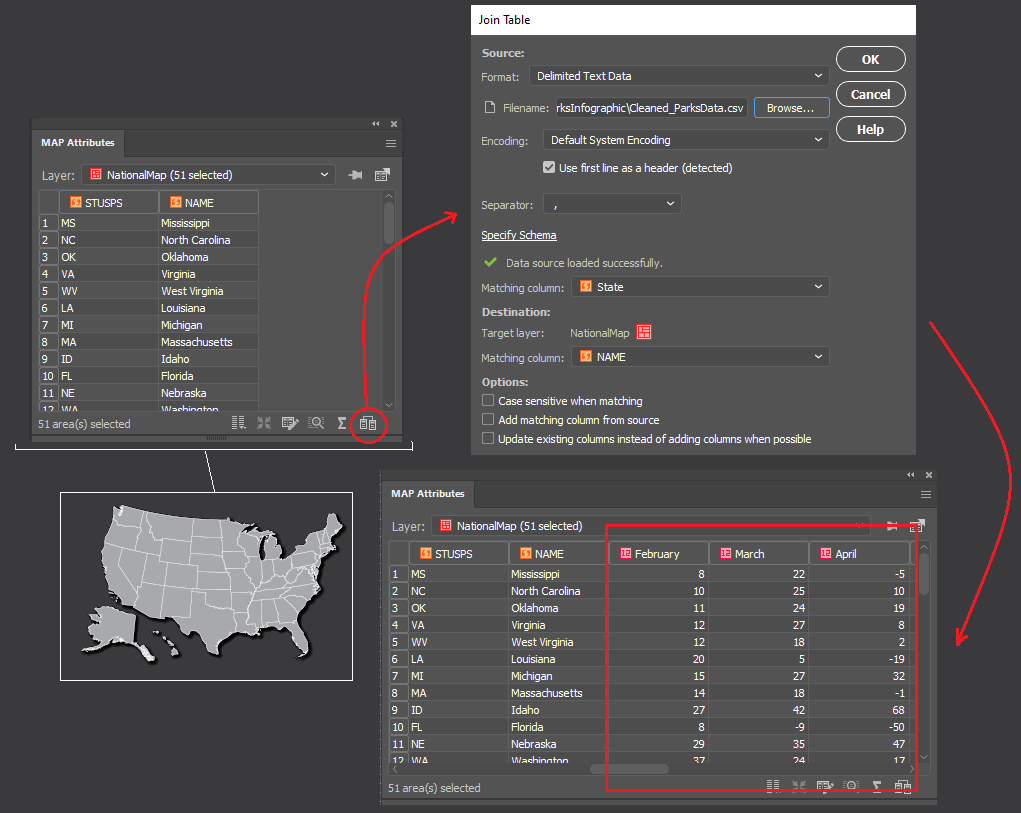
Maps are powerful story-telling tools, and we felt this data would be more interesting if you could see how park visitor patterns changed not only with time but also with geography. To make working with map data in Adobe Illustrator easier, we used the MAPublisher Import tool to load in a shapefile of U.S. state boundaries. The tool allows us to treat our dataset as a fully functional graphic element in Illustrator while still retaining all geographic properties integral to spatial data (attributes, topology, and coordinate systems).
To visualize the data as a map, we needed a way to associate each record in our tabular dataset to a specific location (in this case, a State). To do this, we used the Join tool, which takes our “cleaned” tabular parks dataset (stored as a CSV file), and links it to our mapped states shapefile using the shared State names column.
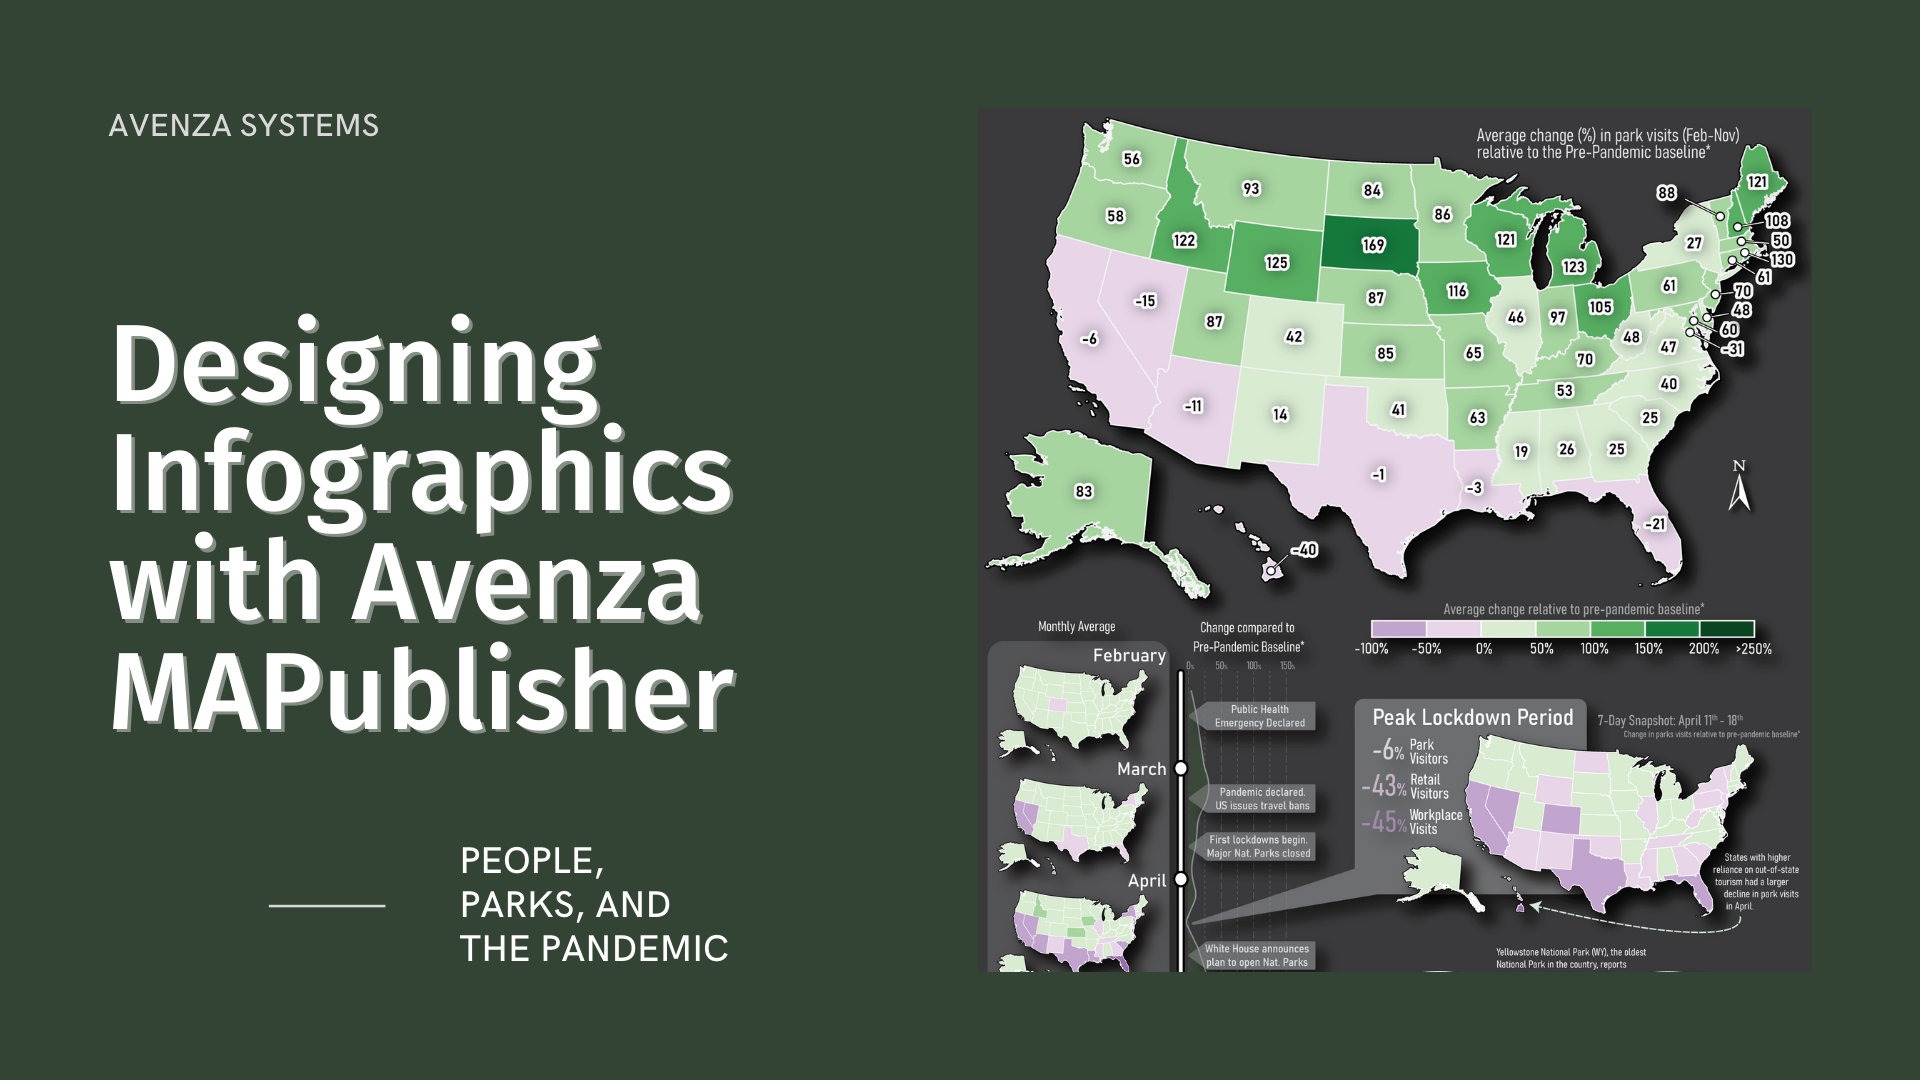
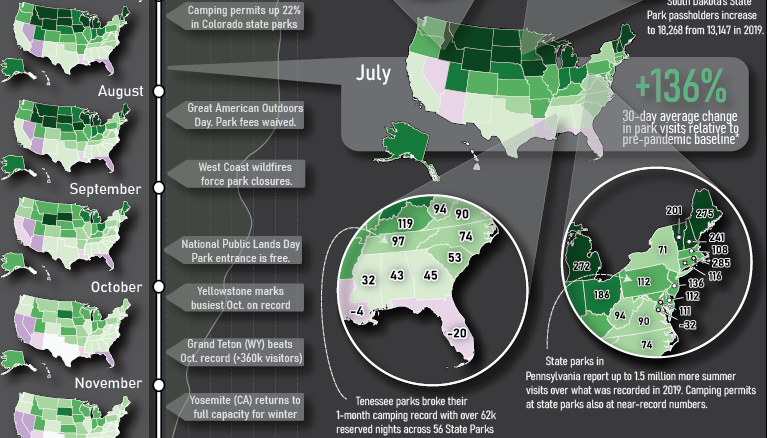
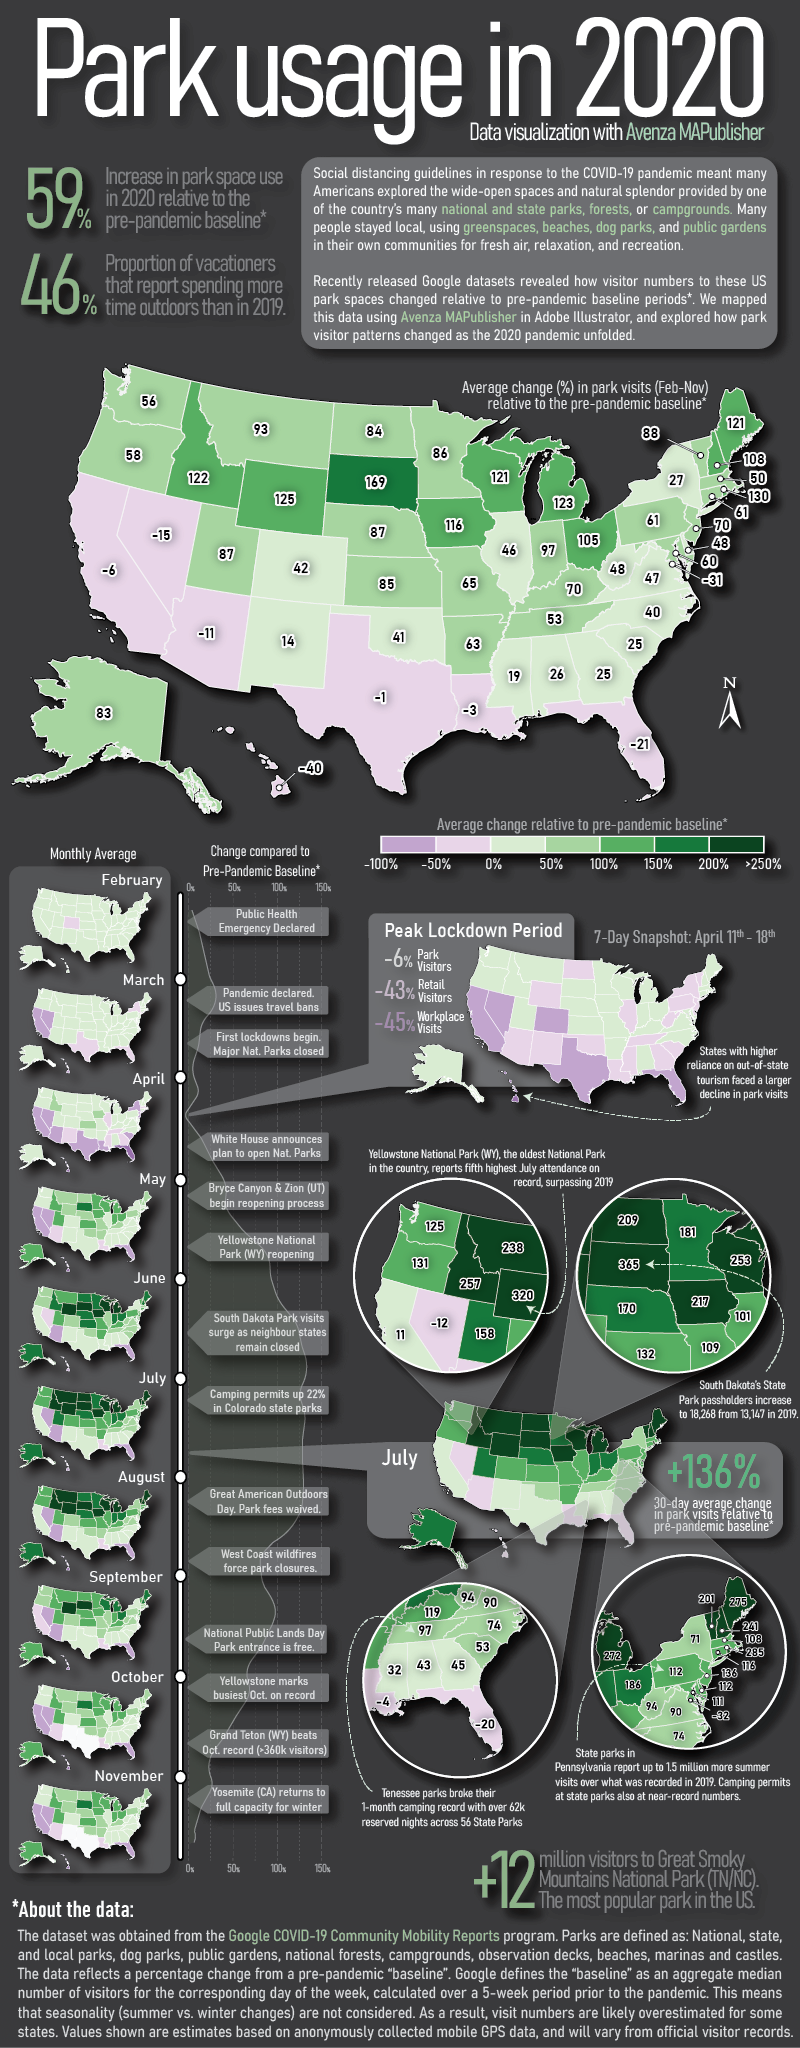
We started to think about how to design the layout of the infographic (this is where having a mapping environment in Illustrator really shines). We wanted it to consist of three main parts: a large labelled map showing the average change in park visits over the entire year; a vertical series of maps showing how park visits varied month to month; and a handful of pop-out maps with insets highlighting specific points in the year and specific regions of the country.
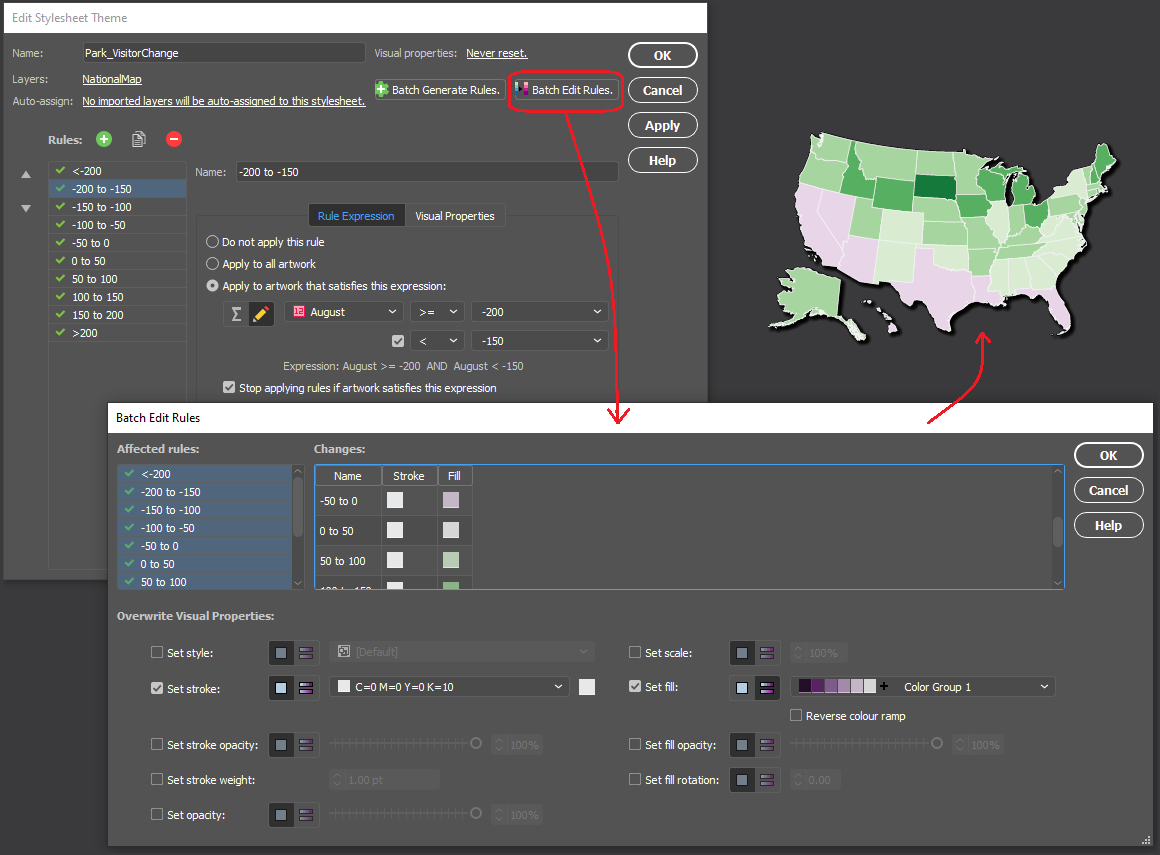
We chose to stylize the data into thematic maps, which use colour to represent specific values in the data at different locations. Instead of tediously configuring individual colour fills, we used MAP Themes to establish a rules-based stylesheet that applies a colour automatically to each State based on the monthly park visitor columns stored in the map layer’s attribute table. We chose a “thematic map” colour group from the included ColorBrewer 2 swatch library to best show positive and negative changes in park usage.
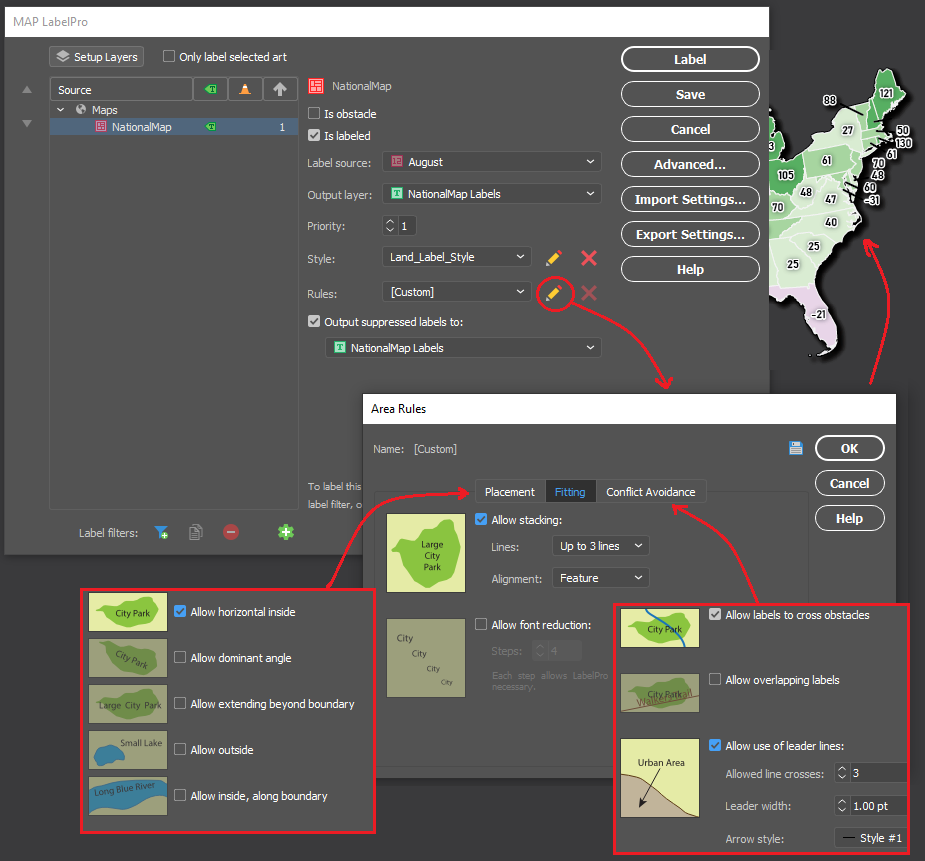
Next, we populated our main map with labels showing the percentage change in park use for each state. As many cartographers know, placing and configuring labels can be a significant time sink. Fortunately, we could use the MAPublisher LabelPro add-on to provide collision-free, rules-based label placement. We could configure the label rules to automatically handle collisions, alignment, and placement of labels for each state. Using the leader lines option in the LabelPro Rules panel, we were even able to create offset labels that prevent crowding the map.
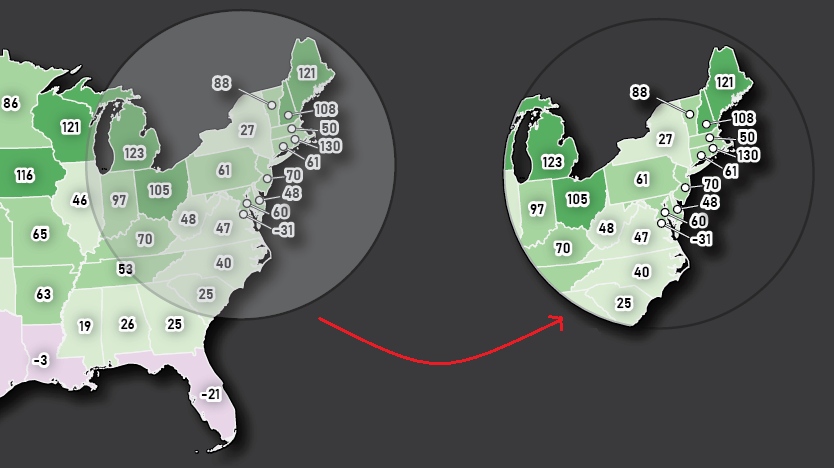
Finally, we decided that to create some insets to highlight specific parts of the country. From a “master” map, we used the Crop to Shape tool to crop the map data to our desired inset extents. Using Crop to Shape is quick, and also retains the styling elements (colours, labels, strokes), topology, and attribute integrity of the cropped map layers.
With most of the maps completed, all that was left was to populate the infographic with text and graphics. Using the MAPublisher layout tools, we added a functional North Arrow and customized the automatically generated legend layer to suit our infographic’s design. Lastly, we used an Illustrator graph tool to create a vertical line graph of park activity along the left side of the infographic.
Presenting the dataset in this way makes it much easier to extract insights and craft a story from the data. Some patterns are immediately noticeable, such as the overall increase in park space usage that is observed for most of the US during the pandemic period. This isn’t exactly unexpected, as parks were one of the most accessible forms of leisure activity and recreation amid widespread social distancing and retail/entertainment closures. We also see how state-specific factors may have affected park usage in different regions of the country at different times. Some states, such as South Dakota, had eased restrictions on out-of-state visitors to their park systems, resulting in a spring season surge in park usage earlier than their neighbours. Conversely, states which typically draw a high proportion of international tourists, such as California, Hawaii, and Florida, saw more of a decrease in average park usage as a result of global air travel decline. These patterns and stories are one of many that can be identified, providing compelling examples of why maps are such powerful tools for visualizing data.
The beauty of working with MAPublisher to create this map-heavy infographic is that we were able to implement the powerful mapping and data manipulation tools of a dedicated GIS while seamlessly integrating the advanced art and design tools offered by the Adobe Illustrator graphical environment. Together, these tools turned what would have been a complex workflow of importing and exporting data between different software, and allowed us to create the entire infographic in a single mapping and design-focused fully integrated workspace.
See the Full infographic below:
References:
Data – https://www.google.com/covid19/mobility/
Pandemic Timeline – https://www.ajmc.com/view/a-timeline-of-covid19-developments-in-2020
Raw Park Visitor Stats – https://irma.nps.gov/STATS/
Camping Stats – https://koa.com/north-american-camping-report/
News Reports and Park/State-Specific Articles
“Camping in Tennessee’s State Parks Increase during Pandemic.” Wreg, AP, 9 Dec. 2020, wreg.com/news/camping-in-tennessees-state-parks-increase-during-pandemic.
Marcus Schneck. “Camping at Pennsylvania State Parks ‘Going through the Roof’ as Coronavirus Restrictions Ease.” Pennlive, 1 July 2020, www.pennlive.com/coronavirus/2020/07/camping-at-pennsylvania-state-parks-going-through-the-roof-as-coronavirus-restrictions-ease.html.
Anderson, Patrick. “National Parks in South Dakota Remain Open as Others Close across the Country.” Argus Leader, 17 Apr. 2020, eu.argusleader.com/story/news/business-journal/2020/04/17/coronavirus-south-dakota-national-parks-remain-open-others-close/2981675001.
Henderson, Catherine. “Having a Hard Time Finding a Campsite in Colorado This Summer? You’re Not Alone.” The Know Outdoors, 15 July 2020, theknow.denverpost.com/2020/07/15/colorado-camping-covid-national-parks-state-parks/241704.
Wiley, Melissa. “What the 10 Most Visited National Parks in the US Have Said about Their Plans to Reopen, from Opening in Phases to Implementing Social Distancing Guidelines.” Business Insider, 21 May 2020, www.businessinsider.nl/are-national-parks-open-covid-19-coronavirus-united-states-nps-2020-5?international=true&r=US.