Welcome back to another edition of Mapping Class! The Mapping Class tutorial series curates demonstrations and workflows created by professional cartographers and expert Avenza software users. Today we have Steve Spindler, a longtime MAPublisher user, and expert cartographer. Steve has put together a 15-minute masterclass on creating maps from start to finish using templates and stylesheets. This video is jam-packed with useful tips and tricks that show how Steve uses templates, stylesheets, and a host of MAPublisher tools to design a beautiful map in minutes.
Steve has produced a video to show the complete, un-cut, map-making process. The Avenza team has produced video notes (below) to help you follow along.
***
Efficient Map-making using Templates and Stylesheets by Steve Spindler (video notes by the Avenza team)
Today, Steve is doing something a little different. Instead of focusing on a specific tool or technique, he has put together a complete 15-minute masterclass showing how he creates a map from start to finish. In this uncut demonstration, Steve discusses his tips for importing data, using MAP views, applying stylesheets, and even labelling. Steve shows how using templates and preconfigured MAP themes can make map creation a breeze.
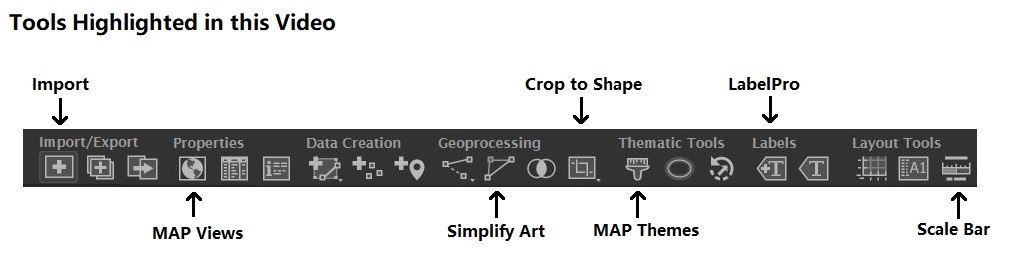
Using a Template
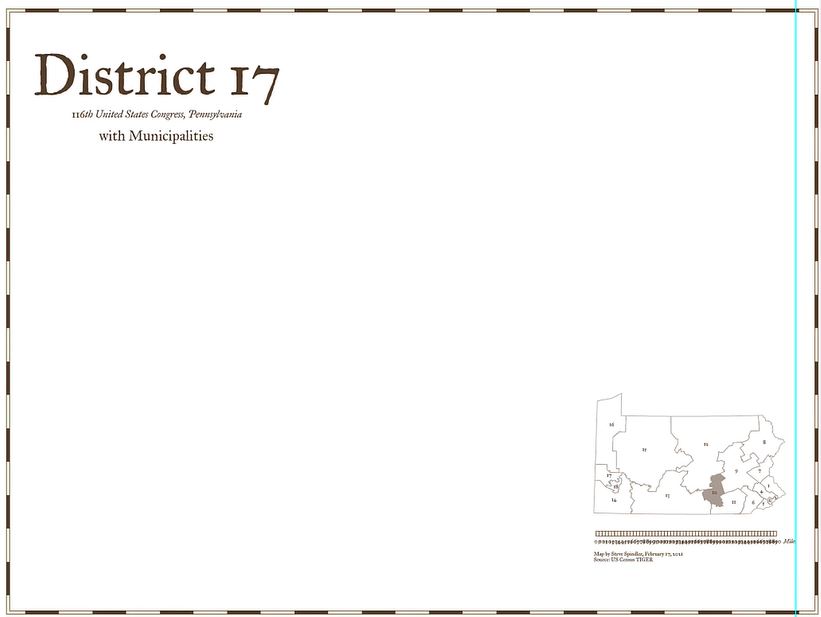
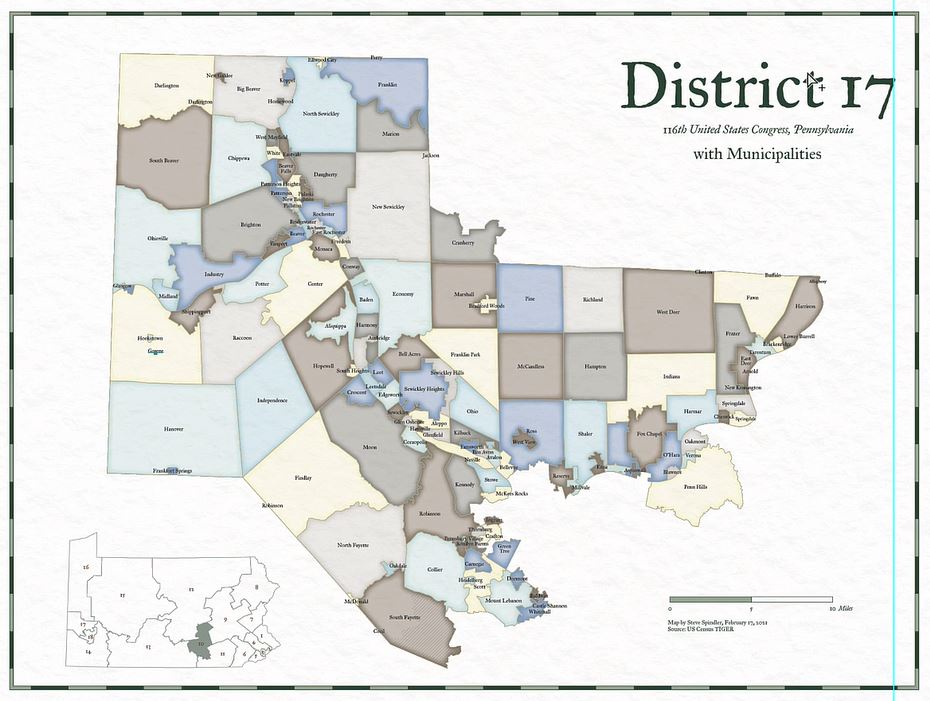
In this demonstration, Steve will be creating a congressional district map showing the municipalities of Pennsylvania District 17. Steve discusses how using a template to create your map can significantly improve the speed of map creation. Templates can be used to configure standardized design elements that can be recycled across several different map projects. Templates are especially useful in situations where different maps form part of a series with shared design components and colour schemes.
For this tutorial, Steve uses a template that includes some basic stylistic elements he typically includes in all his congressional district maps. The template comes preloaded with custom borders, Titles, subtitles, an inset map, and a scale bar. His template is already configured with custom fonts and colours that will give some uniformity across his different map projects.
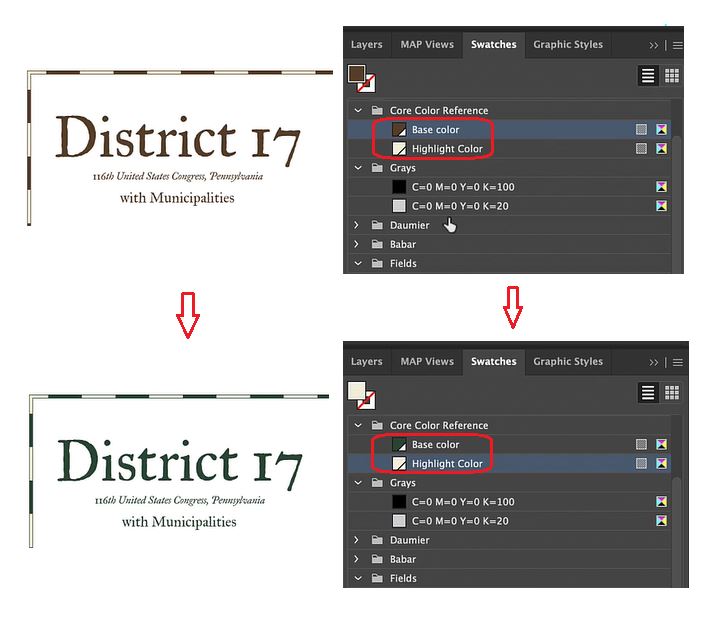
Steve has also set up swatch groups for his template. This ensures each map created with the template uses the same colour groups. Setting up swatches in the template also makes it easy to swap out or change the colour of different map elements. As an example, Steve uses the drag and drop functionality of the swatch panel to automatically adjust the “core colours” of his map template (text, border, and scale bar colours) from brown to green.
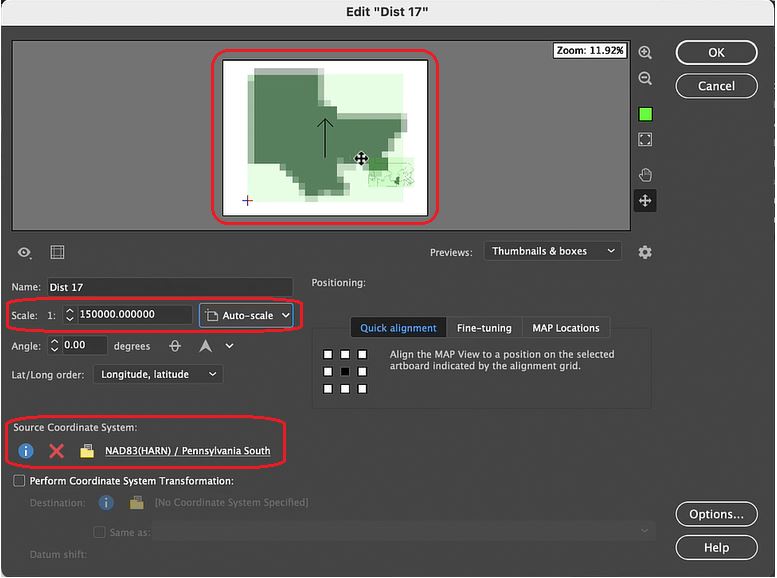
Steve’s template comes preloaded with an inset map containing all the congressional district boundaries for Pennsylvania. Using the drag-and-drop functionality of MAP Views, he can place a “District 17” data layer into a new MAP View that will contain the main body of his map project. Using the MAP View editor, Steve can assign a custom scale and choose an appropriate projection. This will ensure any new data layers he brings into the MAP view will be correctly aligned and accurately projected.
Import and Prepare the Map Data
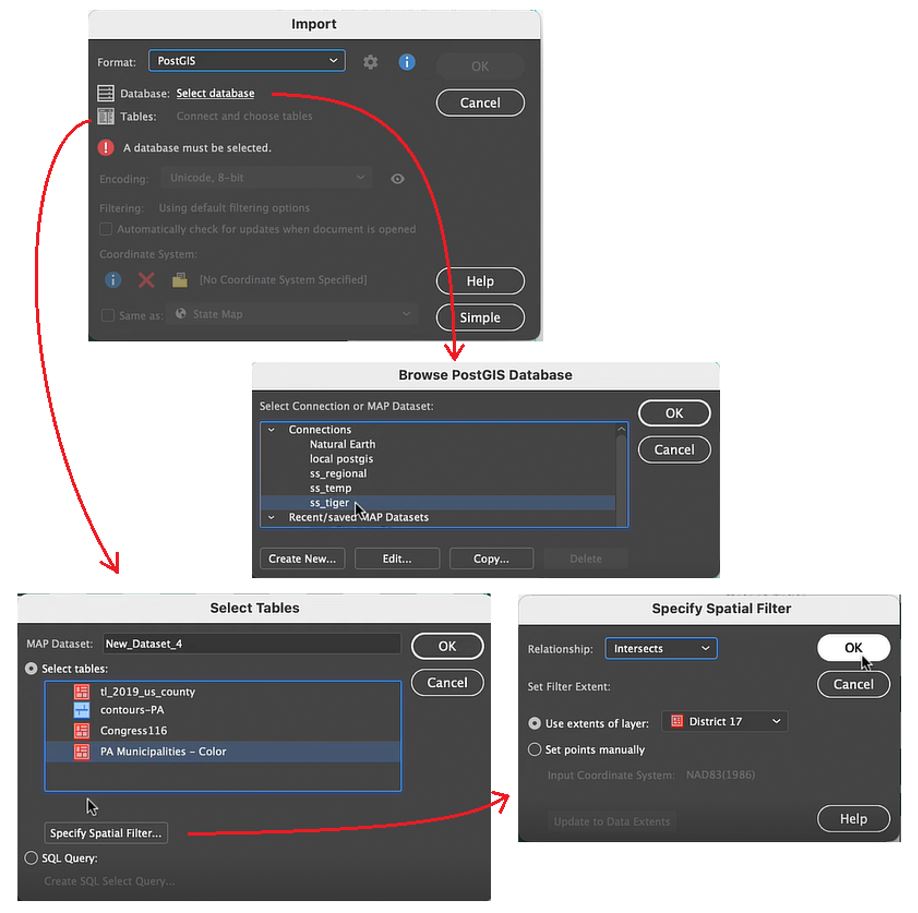
With his template configured, Steve now brings in some new data. He wants to access municipal boundary polygon data found on a PostGIS database stored locally. You can specify the specific data table within the database he wishes to add using the Import tool. More importantly, shows how he uses spatial filtering options to specify the region of interest. The spatial filter means that only the data relevant to the map extent is loaded in (very useful when using large datasets).
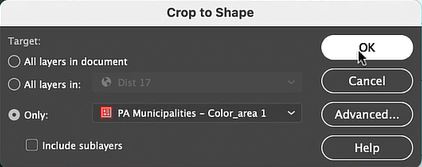
Using the Crop to Shape tool, Steve cleans up the imported data layer by removing any polygons that fall outside his district boundaries. Next, he uses the Simplify tool to remove extraneous vertices, with that his data is ready for stylization!
Apply Styles with MAP Themes
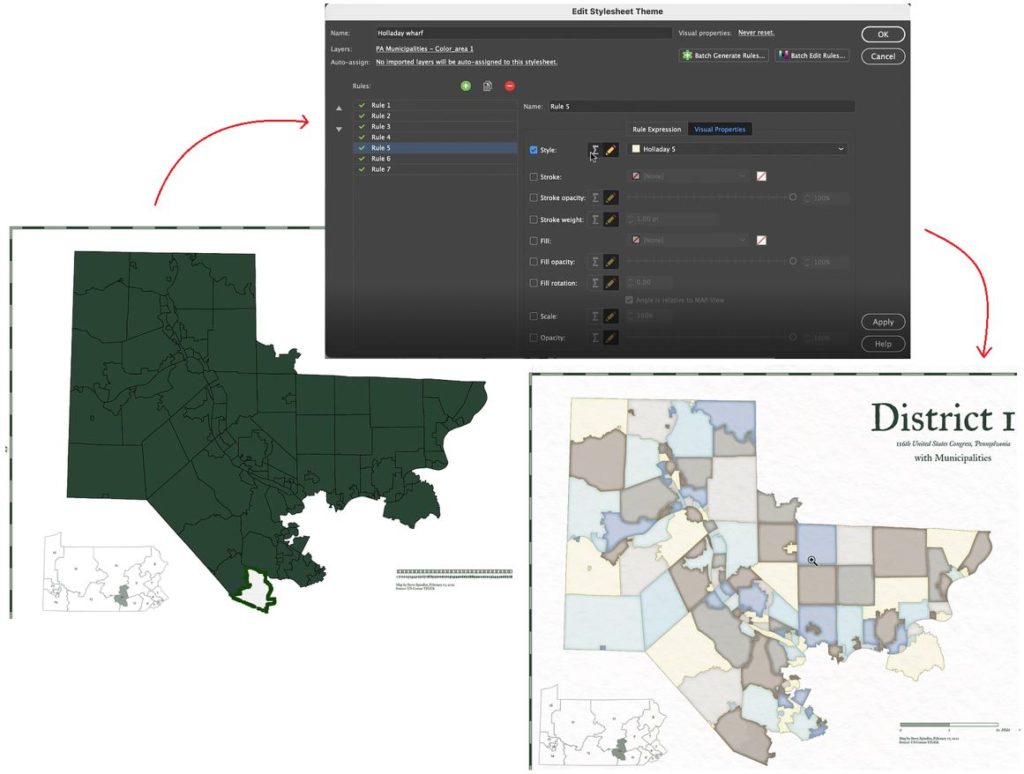
MAP themes are one of the most powerful tools in the MAPublisher toolset. MAP Themes allow you to configure rules-based stylesheets that work with attribute information stored in map data layers. Using pre-coded attribute values in his municipal boundary layer, Steve can assign colour fills to each municipality. Using colour in this way is a bit more eye-catching than using generic boundary lines, and makes it easy to see the shapes of each municipality.
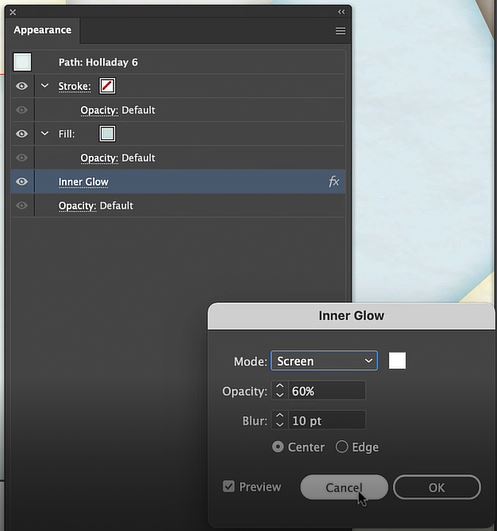
MAP Themes can not only set the stroke and fill for each polygon, but also apply graphic style effects such as “inner glow” to give each shape a more defined appearance. Since MAP Themes are entirely rules-based, it’s easy to modify and apply styles across the entire map without needing to adjust appearance settings for each vector layer individually.
Labels and Details
With his MAP Themes applied, Steve needs to finalize the scale bar that appears in the bottom right corner of the map. Since the template he uses comes pre-configured with a MAPublisher cale bar, it’s only a matter of dragging and dropping the scale bar layer into the appropriate MAP View. If you recall from earlier, Steve set up this new map-view with its own map scale and projection, meaning the scale bar will automatically be adjusted to fit the map data once it is placed in the new MAP view, creating an accurate and informative scale for viewers.
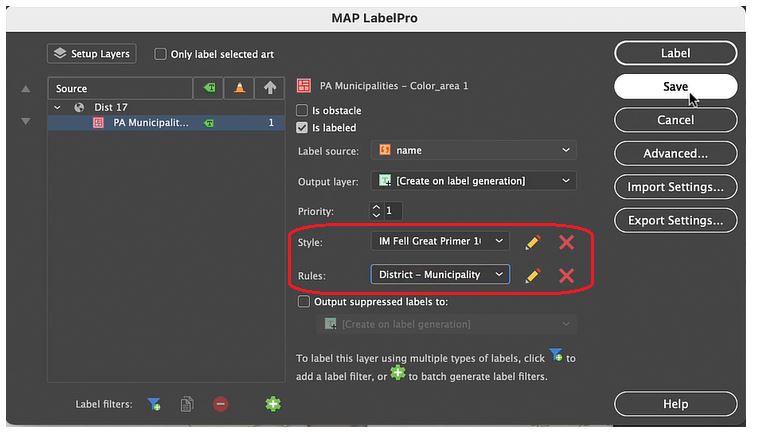
Lastly, Steve uses the MAPublisher LabelPro add-on to apply labels to each of the municipalities in his map. Similar to MAP Themes, the LabelPro tool allows Steve to configure rules-based label layers that manage label placement and style. The labelling engine ensures that labels are placed to avoid collisions, eliminate label overlap, and reduce label clutter. Finishing the map with a few minor touch-ups and voila!, Steve has finished his Pennsylvania District 17 Map in less than 15 minutes!
***
About the Author
Steve Spindler has been designing compelling cartographic pieces for over 20 years. His company, Steve Spindler Cartography, has developed map products for governments, city planning organizations, and non-profits from across the country. He also manages wikimapping.com, a public engagement tool that allows city planners to connect and receive input from their community using maps. To learn more about Steve Spindler’s spectacular cartography work, visit his personal website. To view Steve’s other mapping demonstrations, visit cartographyclass.com
Welcome back to this month’s edition of Mapping Class. The Mapping Class tutorial series curates video tutorials and workflows created by experienced cartographers and Avenza software users. Joining us once again is Steve Spindler, a longtime MAPublisher user, and expert cartographer. Steve is here to show you a quick tip for using the attribute expression builder within MAPublisher to quickly perform batch edits of labels.
Steve has produced a short video to demonstrate how he uses the expression builder to quickly edit street names. The Avenza team has produced video notes (below) to help you follow along.
***
Label efficiently using Attribute Expression Builder by Steve Spindler (video notes by the Avenza team)
With MAPublisher, labeling your maps is a breeze. With powerful tools such as LabelPro, labeling is only a matter of selecting the data you want to label, and configuring a robust set of rules that control how each label is placed and styled. But before you can start labeling, you must have high-quality, accurate attribute information for your map data. Since labels are typically generated by displaying text values contained in an attribute column, it is important that attributes are not only accurate but are also formatted in a way that is optimized for display on a map. In many cases, cartographers need to spend time reformatting or editing attribute information before they can generate labels, a process that can become quite time-consuming. Nowhere else is this problem more common than when dealing with street names and road network data.
When labeling streets, cartographers often spend time correcting, or even generating brand new attribute information that can be used to create more concise, effective street labels. This typically involves changing street prefixes and suffixes to a condensed short form (i.e “North Cherry Boulevard” becomes “N Cherry Blvd”). For smaller projects, this can be done by manually editing the individual attribute values directly within the MAP Attribute panel. For large projects, especially those dealing with hundreds or even thousands of map features, manual editing would be very time-consuming.
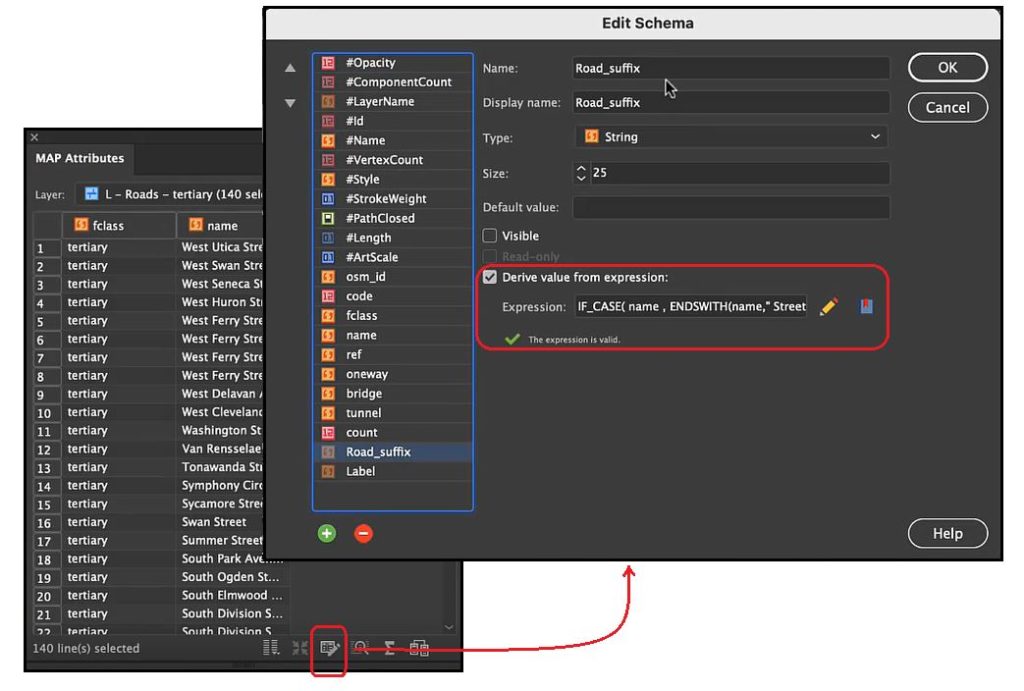
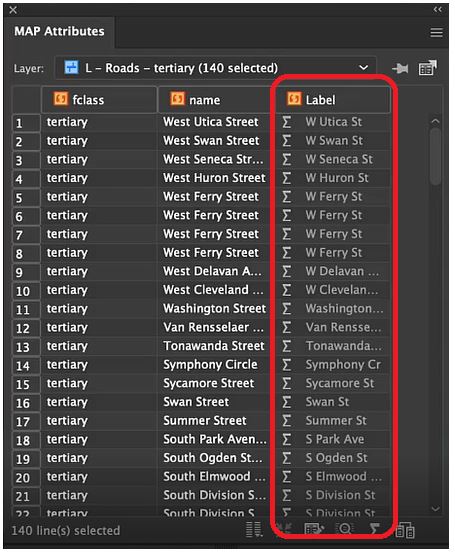
For a more efficient approach, Steve shows how you can use the Expression Builder to easily modify large selections of attribute values. The first step is to open the MAP attribute table, which displays all the attribute information contained within a specific map layer. Steve identifies the attribute column that contains the text street names and will use this to build out a new attribute column to create his labels.
Next, Steve opens the Edit Schema window of the attribute table. Here, you can access column information such as the data type, default value, field visibility, and most importantly; the expression builder.
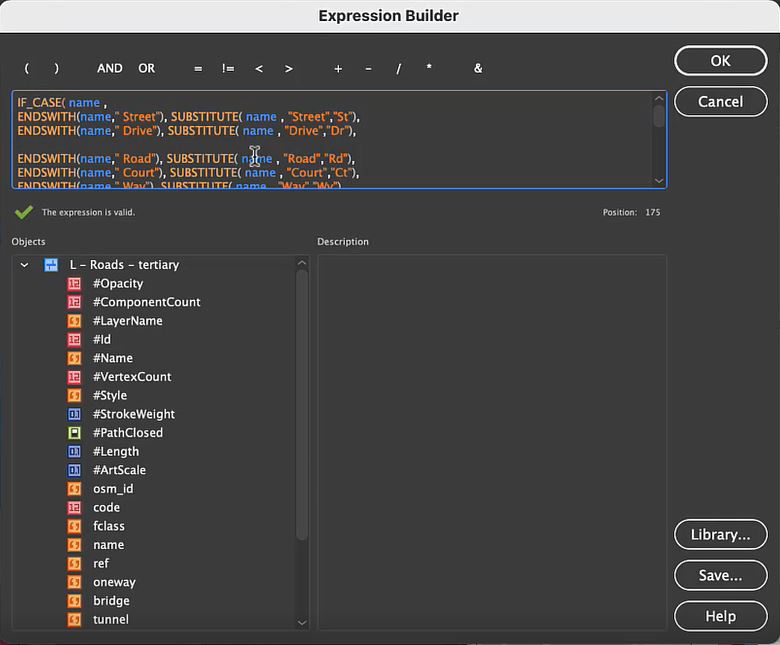
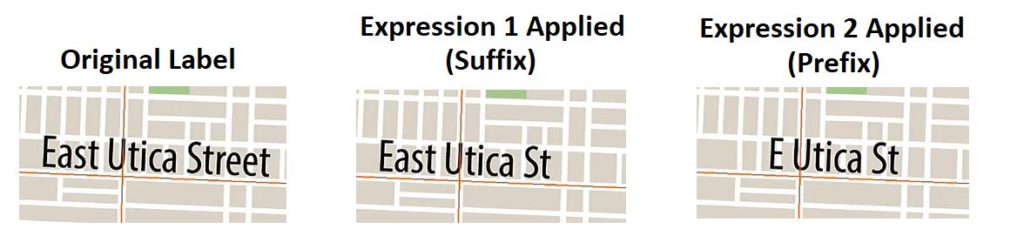
The expression builder may seem intimidating at first, but with a little bit of effort, it can be an incredibly powerful tool for calculating attribute values and performing batch-edits on your data. The tool uses built-in operators and items in the objects list (attribute names and values, constants, functions) to calculate custom attribute information based on a specified set of expressions. In this case, Steve first creates an expression set that modifies the suffix values in the Street name field (i.e “Boulevard”) and substitutes them with the appropriate short form (“Blvd”). The expression is used to populate a new attribute column called “Road_suffix”. The end result means attribute values such as “East Utica Street” will be passed to a new attribute value of “East Utica St”.
IF_CASE(name,
ENDSWITH(name, “ Street“),SUBSTITUTE( name , “Street”, “St”),
ENDSWITH(name, “ Drive“),SUBSTITUTE( name , “Drive”, “Dr”),
ENDSWITH(name, “ Road“),SUBSTITUTE( name , “Road”, “Rd”),
ENDSWITH(name, “ Court“),SUBSTITUTE( name , “Court”, “Ct”),
ENDSWITH(name, “ Way“),SUBSTITUTE( name , “Way”, “Wy”),
ENDSWITH(name, “ Lane“),SUBSTITUTE( name , “Lane”, “La”),
ENDSWITH(name, “ Route“),SUBSTITUTE( name , “Route”, “Rt”),
ENDSWITH(name, “ Boulevard“),SUBSTITUTE( name , “Boulevard”, “Blvd”),
ENDSWITH(name, “ Turnpike“),SUBSTITUTE( name , “Turnpike”, “Tpke”),
ENDSWITH(name, “ Avenue“),SUBSTITUTE( name , “Avenue”, “Ave”),
ENDSWITH(name, “ Place“),SUBSTITUTE( name , “Place”, “Pl”),
ENDSWITH(name, “ Circle“),SUBSTITUTE( name , “Court”, “Cr”),
ENDSWITH(name, “ Highway“),SUBSTITUTE( name , “Highway”, “Hwy”),
ENDSWITH(name, “ Expressway“),SUBSTITUTE( name , “Expressway”, “Exp”)
)
Next, Steve creates a second set of expressions that will further adjust his Road_suffix attribute column to substitute any street name prefixes (North, East, South, West) with their corresponding short-form (N, E, S, W). This second expression (see code block below) is used to populate another new attribute column called “Label”, which will ultimately be used to generate the final formatted label layer.
Note that these expressions are specific to the dataset and map area Steve is using for his project. When using expression builders for your own maps, pay careful attention to the attribute values specific to your area of interest. The best part about expression sets is that they are highly flexible, meaning you can build upon and modify existing expressions, save them to your library, and even use them across multiple different mapping projects!
With his newly created “Label” attribute column, it’s simply a matter of configuring the LabelPro tool to display these formatted label values. With a bit of configuration, the end result is a clean, uncluttered, collision-free label layer. The labels now use all the correct prefixes and suffixes Steve required. By saving his expression sets to his library folder, Steve can now quickly and easily repeat the exact same batch-editing process for new maps with only a few clicks!
***
About the Author
Steve Spindler has been designing compelling cartographic pieces for over 20 years. His company, Steve Spindler Cartography, has developed map products for governments, city planning organizations, and non-profits from across the country. He also manages wikimapping.com, a public engagement tool that allows city planners to connect and receive input from their community using maps. To learn more about Steve Spindler’s spectacular cartography work, visit his personal website. To view Steve’s other mapping demonstrations, visit cartographyclass.com
Hans van der Maarel has been a passionate cartographer for over 20 years. He works out of Zevenbergen, Netherlands where he operates his company, Red Geographics. To Hans, cartography is a passion that extends beyond the office, becoming more than just a career path. Through this passion, Hans has developed a level of expertise found only in the most dedicated of map-making professionals. As an expert MAPublisher user, Hans has been a frequent contributor to the Avenza Resources Blog. You can see some of his latest work through his Georeferencing Techniques Video tutorials released as part of Avenza’s Mapping Class blog series. To read more about Red Geographics, and see more of Hans’s work, visit redgeographics.com.
From a young age, Hans always had a keen interest in maps. His found himself drawn to old atlasses, spending hours looking at old maps, and geography was always his favourite subject in school. This interest persisted into high school, where at a job fair he found out you could actually study map-making as a career.
Continuing his studies, Hans pursued a program in Geo-Informatics at Hogeschool Utrecht (a four-year bachelor’s level course offering a mix of geodesy, GIS, and cartography). There he was introduced to various kinds of mapping and surveying, learning the techniques necessary to plan and design meaningful effective maps. During an internship at the National Spatial Planning Agency, he was first introduced to the MAPublisher plug-in for Adobe Illustrator. After graduation he started working for his local Avenza partner, doing tech support, training, consultancy, and commercial map production processes. This is also where he was introduced to Safe Software and their product for data transformation, also known as Feature Manipulation Engine (FME).
Hans developed a niche within the Dutch cartographic community that leveraged FME to prepare raw source data before using MAPublisher to visualize and create the final high-quality map products. This type of workflow, combining a mix of both FME and MAPublisher functionalities is now fully realized by the FME Auto add-on for MAPublisher.
“I was doing my first internship and was tasked to produce a poster-sized map of The Netherlands in Adobe Illustrator, but all the base data was in Shapefiles or ArcInfo coverages. Gathering base data and generalizing it was done in a traditional GIS, but getting that data into Illustrator and making a finished map required MAPublisher.”
In September 2004, Hans decided to continue on his own and founded Red Geographics. Working largely with Avenza products, two years later, he became an official Avenza partner and reseller. As his customer base expanded and more projects came in, Red Geographics developed a reputation of being “the one for the difficult projects”. Reflecting on the early years of Red Geographic’s operation, Hans mentioned some of his more memorable, fun, and eye-catching projects.
“There was the Oolaalaa Globe, a 5 ft diameter “beanbag” globe with beautiful maps printed on spandex. We received several custom orders of the globe map from other clients, including ones for Air France-KLM with the complete route networks of all their partners, and another from National Geographic Benelux and the City of Amsterdam, with a map of the city projected onto the globe.”
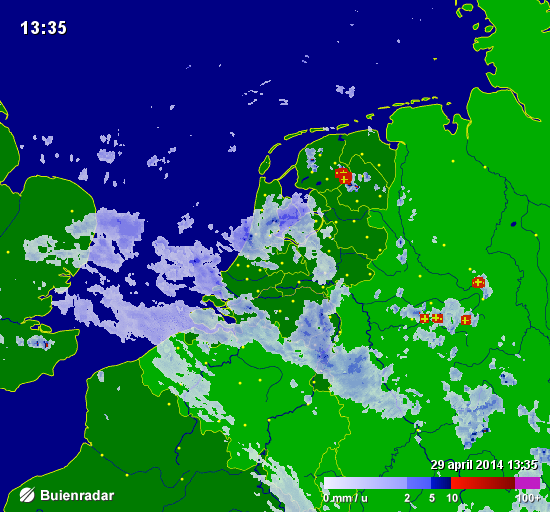
Also eye-catching, but for a completely different reason, were a series of simple basemaps created for Buienradar, the most popular Dutch weather website, and app. Millions of people have seen Hans’s maps when they checked the weather.
In the early years of Red Geographics, Hans became involved with the Cartotalk forum, first as an enthusiastic user, later on as a moderator, and finally an admin. Through Cartotalk, he also got involved with NACIS, the North American Cartographic Information Society. He attended their meeting in Salt Lake City in 2005 and he’s been to every meeting since. When NACIS took over Cartotalk, Hans became an ex-officio board member for several years before being formally elected a board member at large. He still serves on the board to this day and is currently in his 2nd term as secretary. Through NACIS, Hans was able to expand his network of international contacts, allowing him to contribute to several large-scale mapping and atlas projects. He created island maps that can be found in the Millennium House “Earth” atlas and more recently, several full-page maps for the 11th Edition National Geographic World Atlas released in 2019.
Building on the success of his earlier globe projects, Hans then created a new map whose design is displayed prominently on a new product called BalancePlanet, a globe-themed, fully functional yoga-ball that Hans considers a spiritual successor to the Oolaalaa globe bean bag chair.
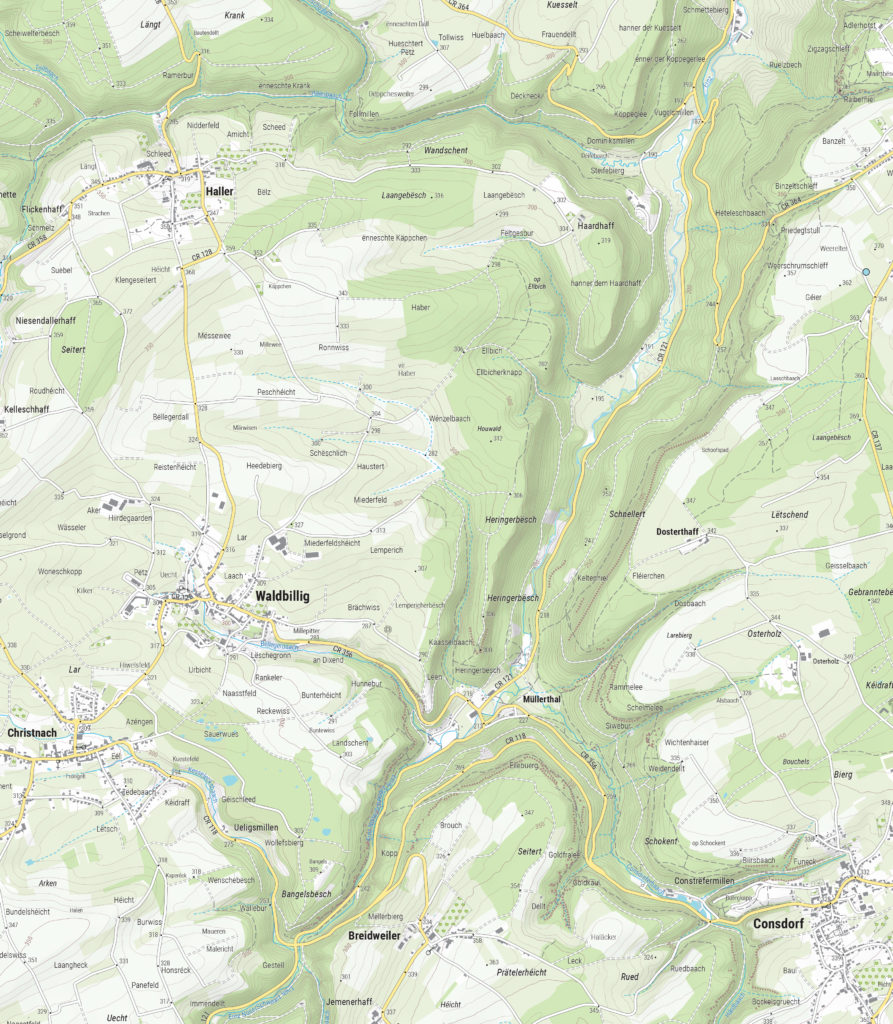
In 2019, Hans expanded his team, adding two members to become a team of three. With more resources now available, Hans and his team can now tackle larger, more complex (mapping) projects. His team took on the momentous task of producing a nationwide 1:20,000 scale topographic base map of the entire country of Luxembourg. The finished results were used as a cartographic base for tourist maps showing hiking and cycling routes all over the country.
“The Avenza products have been a major factor in my development as a cartographer, as well as the development of my company,” says Hans. Many of his projects use a combination of FME and MAPublisher, and Hans has utilized the interoperability between these two programs to implement significant workflow automation. With a single base dataset, multiple maps can be made with the same style, and automating this process means he can produce a high volume of maps in just seconds, without needing to manually configure shared thematic elements.
“With automating some of the map production processes, I now only have to focus on the parts where my cartographic skills are most needed. MAPublisher allows me to do that. I want to find the right balance between quality and speed when it comes to producing maps, and with automating the data processes I have found just that.”
Aside from the traditional mapping products Hans has become known for, he enjoys working on smaller projects with interesting stories around them. “The maps I get the most joy out of these days are, interestingly enough, not those big ones. Over the past ten years or so I’ve been asked to produce greyscale maps for several academic publications, a lot of them focusing on the Arctic and Antarctic regions. Limited in terms of visual variables and often a need to show a lot of information on a small surface area, these kinds of maps are a very interesting challenge. One thing led to another, word-of-mouth is a great promotion tool, and we now find ourselves in the middle of producing about 30 maps for an upcoming publication by Cambridge University Press, chronicling the state of research in those areas. Wonderfully esoteric subjects which often lead me down a Wikipedia rabbit hole!”
Hans continues to use his cartography skill set to explore new ways of making maps more prominent in everyday life. Hans began introducing his colleague, Inge van Daelen, to the concepts of satellite imagery and Photoshop (using Tom Patterson’s great tutorial on how to process Landsat data). Branching off of this, they founded Blue Geographics, which originally started as a fun side-project but quickly grew into a full-fledged business. Through Blue Geographics, Hans designs and produces a range of sportswear and lifestyle items displaying beautiful satellite images derived from Landsat and Sentinel data.
“Looking ahead, I just want to make beautiful things,” says Hans, “One of my hobbies is photography, specifically cycling and cosplay. A few years ago, when I did a photoshoot with two cosplayers, I saw a sticker with that text in their workshop and it struck a chord with me. I’ve long had ‘doing awesome work for people I like’ as one of my goals and I want to keep on doing that. I also want to keep on challenging myself by trying out new techniques and new ways to map things. There’s still a lot to learn and I am very happy to know a lot of people in the cartographic community who are happy to share their knowledge and experiences.”
Welcome back to another exciting edition of Mapping Class, a video-blog series where we curate tutorials and workflows created by expert cartographers and Avenza power users from around the world. Today we release Part Two of our Georeferencing Techniques tutorial with Hans van der Maarel, owner of Red Geographics. In Part Two, Hans demonstrates some techniques he has developed for working with more challenging georeferencing tasks, including dealing with unknown projection information and working with scanned maps. If you missed Part One, in which Hans covers the basics of Georeferencing in MAPublisher, check it out here.
Hans has produced a jam-packed video walkthrough detailing his georeferencing process. The Avenza team has produced video notes (below) to help you follow along.
***
Georeferencing Techniques Part Two: Working with Scanned Maps by Hans van der Maarel (video notes by the Avenza team)
As we discussed in last month’s Mapping Class, georeferencing is the process of taking imagery or map data that lacks geographic location information and associating it with specific coordinates on Earth. Previously, Hans showed us how MAPublisher provides a few tools that make georeferencing simple vector map data a painless process (Check out part one here!). Best of all, using the built-in georeferencing tools, this can be done entirely within the Adobe Illustrator environment.
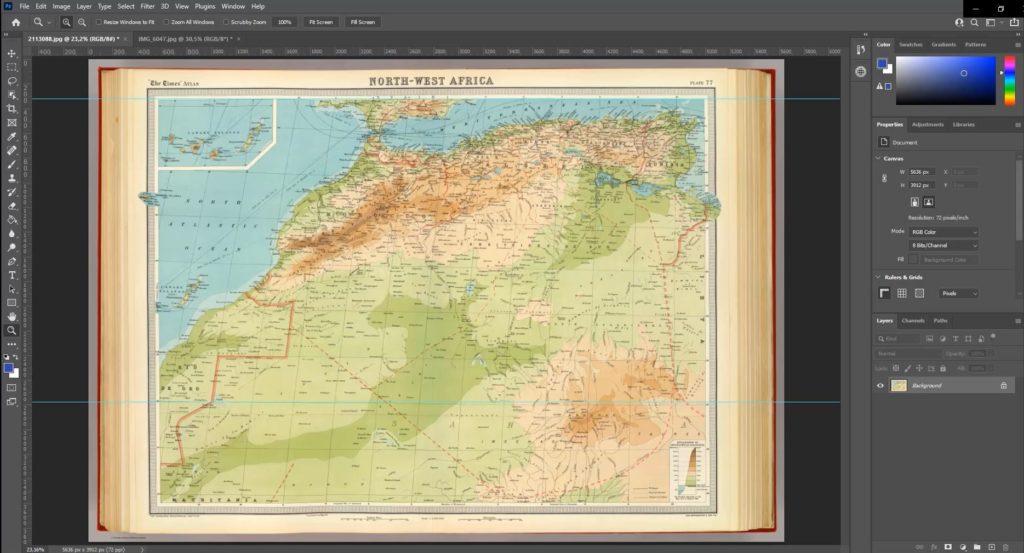
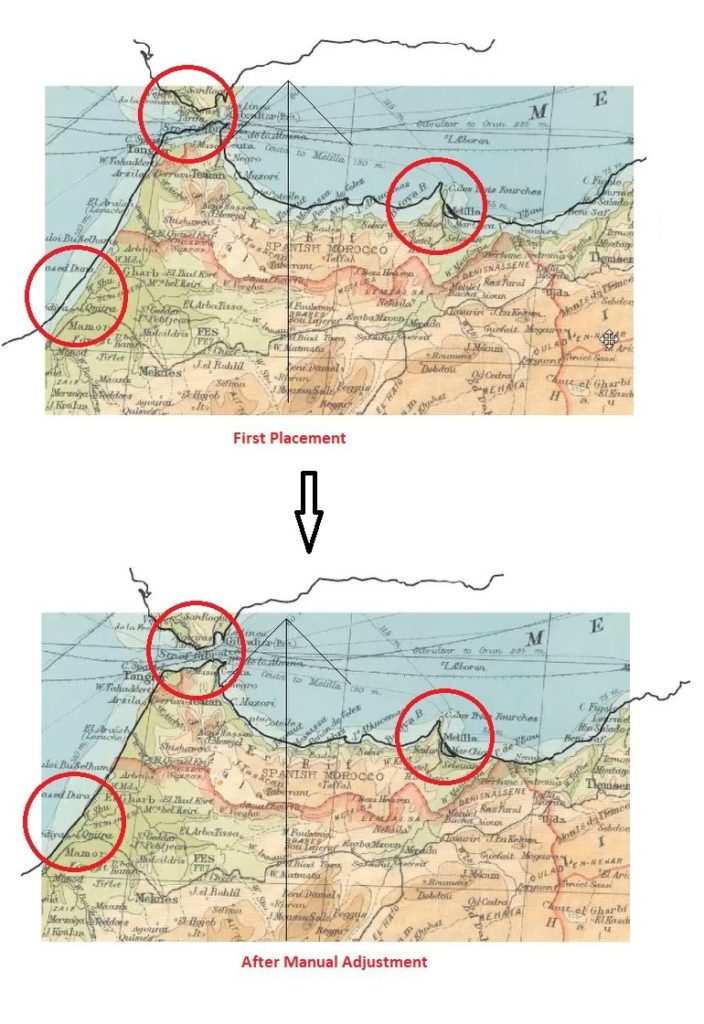
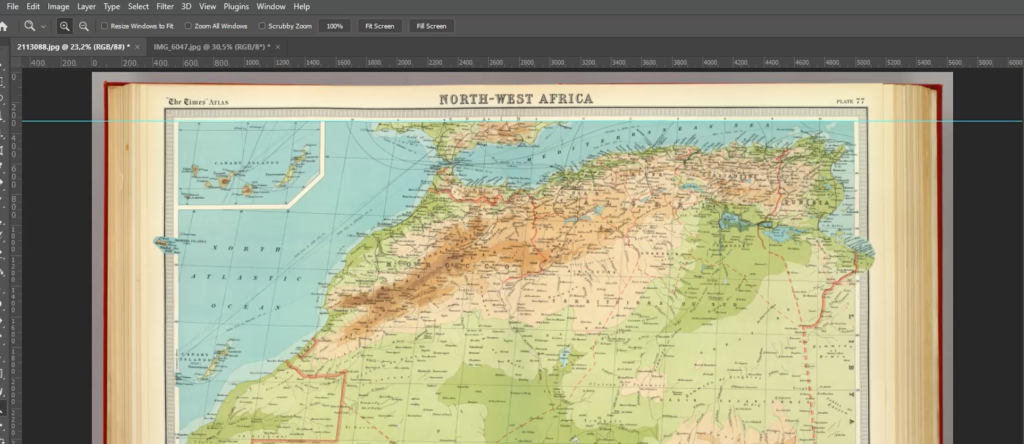
However, what can you do if you are working with historical maps or scanned images that lack spatial referencing or detailed projection information? This can present a challenge for many cartographers, as the projection information is necessary to create an effective cartographic product that will minimize distortion and maximize the spatial accuracy of the final result. To tackle this problem, Hans shares a series of tips and tricks that he uses for working with scanned historical maps. He uses a beautiful historical map of Northwest Africa to demonstrate his approach.
Right away, Hans identifies a few obstacles. First, he notices that the scan is not a perfect copy of the original map. Due to natural curves and bends in the physical paper version of the map, there is minor distortion in the digital image that arose when the map was scanned. This could create problems for georeferencing the image, as the “fitting” process can be susceptible to image distortions, even when a suitable projection is determined. Thus it is always a good idea to examine your scanned map prior to beginning the georeferencing process. Becoming aware of potential issues with the scanned map data can help inform decisions on the data’s suitability for a particular mapping task. Acknowledging that the distortion is relatively minor in this scanned map, Hans chooses to proceed with the georeferencing process.
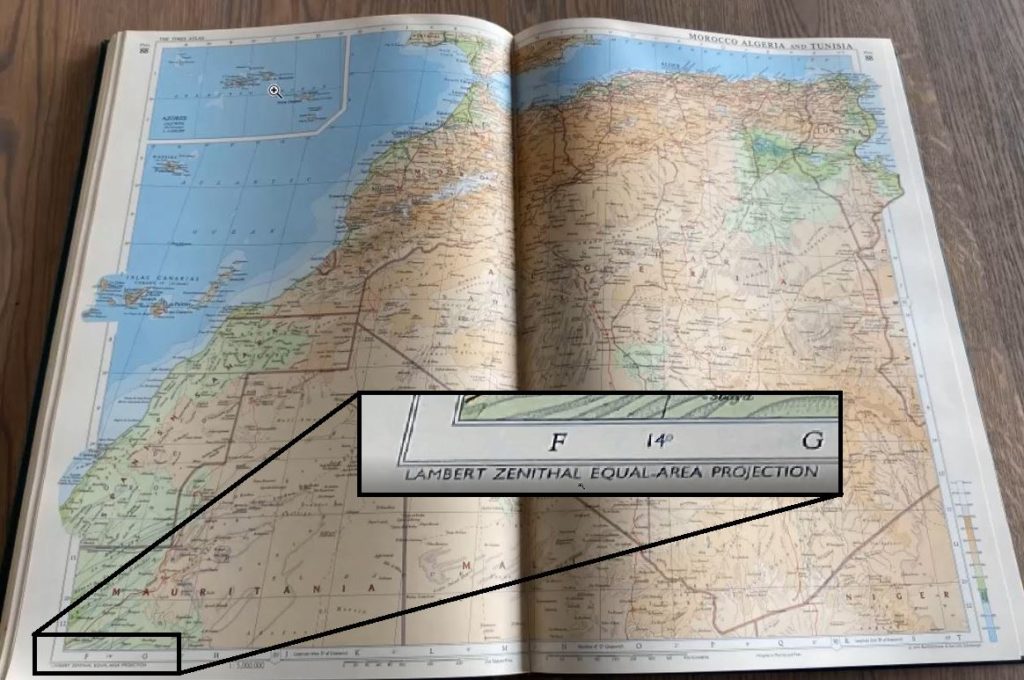
Hans notices that the scanned map image does not provide any details on the original projection information. Instead, Hans must make an “educated guess” on which projection was being used. With a bit of research, he discovers another map from roughly the same era and displaying a similar region. Recognizing the similarities between this map, and his scanned map, Hans decides to implement a Lambert Zenithal (Azimuthal) Equal Area Projection.
Hans discovered this map from 1968, which displays approximately the same area. He chooses to use the projection information from this map to help with the georeferencing process of his scanned map.
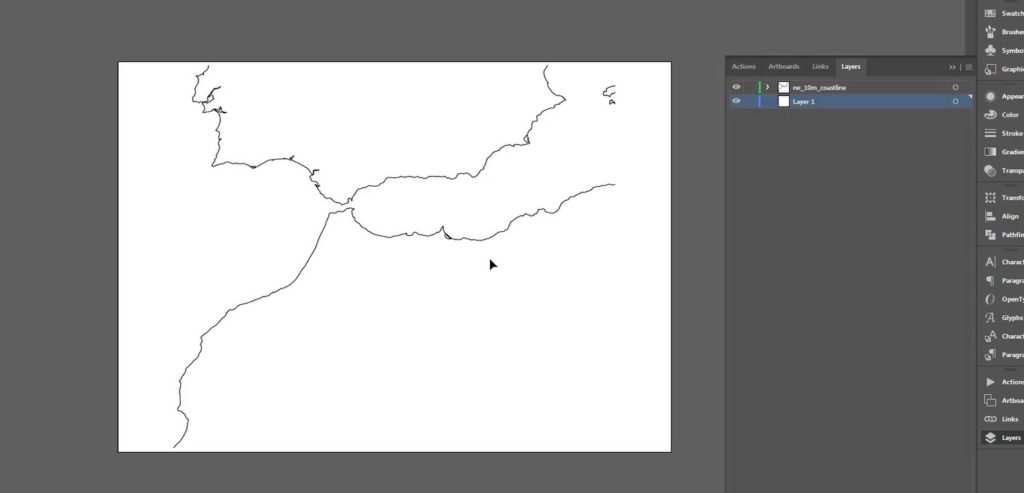
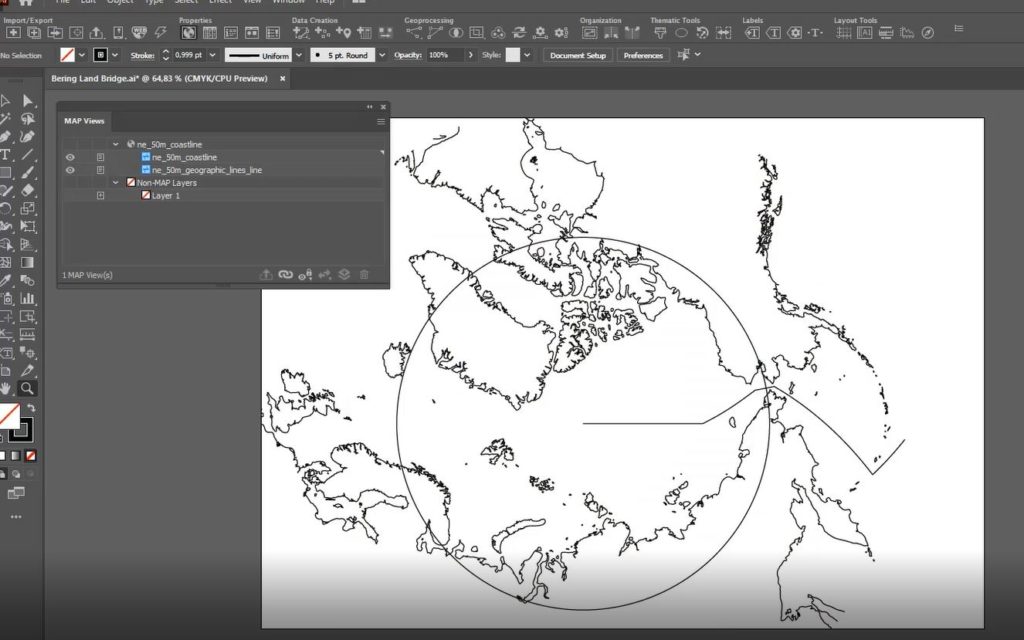
Hans can begin his georeferencing process by first setting up a new MAP View with the Lambert Azimuthal Equal Area Projection, a conical projection used in many atlas-style maps. To help with the georeferencing process, Hans has used the Import tool to display a vector line layer of coastlines using Natural Earth Data. He can use this coastline data as a guide to help align his scanned map during the georeferencing process.
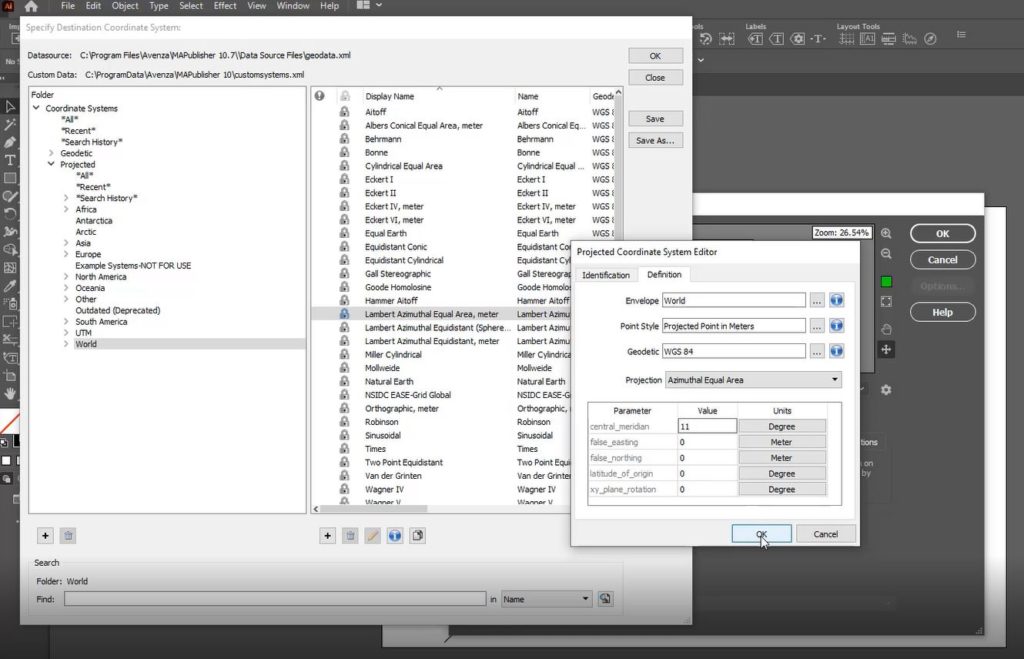
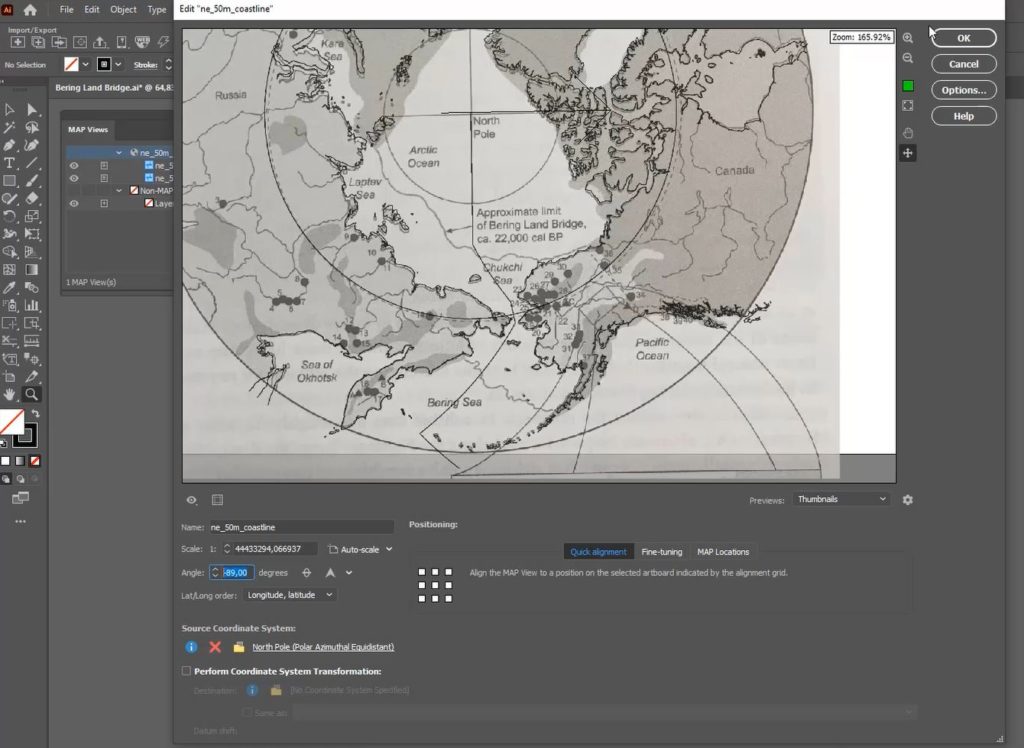
Before moving on, Hans brings up two important things one must consider when working with conical projections: the central meridian and the latitude of origin. When working with scanned maps that include graticule lines, a quick and easy way to help identify the central meridian is to look for the meridian line that closest approximates a straight line. Using the graticules on the scanned map, Hans can approximate a central meridian of about 11 Degrees. In the MAP View Editor, a user can open the projected Coordinate System Editor and modify the definition for the lambert azimuthal equal-area projection to have a central meridian that matches his estimation.
Placing the scanned map layer onto his newly modified MAP view, Hans can then begin the process of manually aligning the map image to match his projected coastline data. One of the easiest ways to support this process is to configure the MAP View editor panel to display layer thumbnails. With this configured, a user can begin manually adjusting the MAP layers until they are suitably aligned.
Hans reiterates that this process is not an exact science. He has made several assumptions on the projection parameters, and the overall accuracy of the original map. He indicates that a user should spend some time trying to get the best possible result, however it will be difficult to achieve a perfect match (especially given the distortions that can occur when a map is scanned from a physical copy). This process can take anywhere from minutes to hours, and requires a lot of manual adjustment, trial and error, and most importantly, patience! The result, however, is that the finalized scanned map layer is correctly projected and georeferenced into a MAP view. From here, adding data layers, annotations, labels, or tracing vector layers from the scanned map can all be completed in a spatially aware mapping environment.
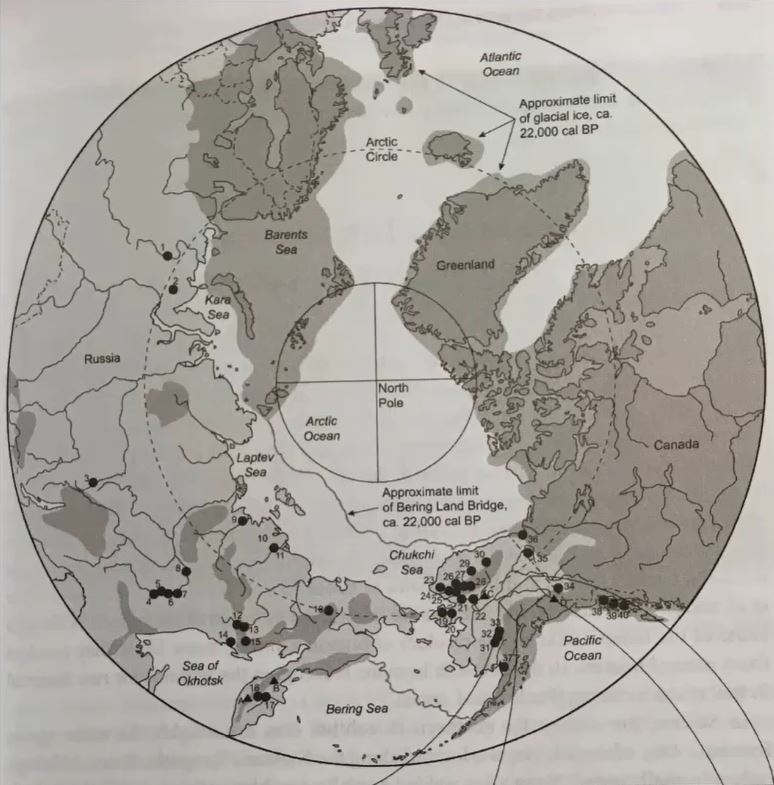
Providing a second example using a slightly different approach, this time Hans uses a map of the Arctic Region. He indicates that although he has been provided with a map of the entire polar region, the client is only interested in the area surrounding the Bering Strait (between Russia and Alaska). As with the previous example, the first step is to identify the best projection to use. Hans correctly guesses that the map provided likely uses the Polar Azimuthal Equidistant Projection based on visual inspection. However, it should be noted that there is room for trial and error here, and users should not be afraid to explore the large coordinate system and projections library included with MAPublisher to try out and test different projections to help narrow down one that fits best.
The first thing Hans notices is that the scanned map image is rotated about -90 Degrees from what is displayed in his reference coastline data. Once again, by visiting the MAP View Editor, Hans can rotate his Map layers without breaking the spatial referencing information of his original map data. By doing this, Hans assures that his map layers are aligned on the same rotational angle, and can then begin to focus on scaling the layers.
Hans uses the MAP view editor panel to apply manual adjustments to the map layers. He notes that a cartographer should always consider the area of the map they are most interested in. For example, although his map covers the entire polar region, Hans indicates the final product will only display the regions surrounding the Bering Strait. Given this, the georeferencing process should be primarily concerned with accurate alignment in the Bering Strait area, while distortion in other areas is seen as acceptable. In the example below, you can see how Hans has achieved a suitable level of georeferencing accuracy in his primary area of interest, despite the non-important areas (i.e the Canadian Polar region, eastern Siberia, Greenland) having relatively low georeferencing accuracy.
With his newly georeferenced scanned map layers. A cartographer can now use the information contained within these scans to supplement a larger cartographic process. For example, Hans can now use the scanned maps to digitize boundaries, or geographic features that may not be present in modern digital datasets (for example, historical boundaries for different countries, or terrain features that are no longer present)
***
About the Author
Hans van der Maarel is the owner of Red Geographics, located in Zevenbergen, Netherlands. Red Geographics is a long-time partner of Avenza and Hans is a well-known power user of both MAPublisher and Geographic Imager. He uses the products for a wide range of cartographic projects for several international organizations and offers training courses and consultancy expertise aimed at developing workflows for clients. In addition to that, he is currently a board member of NACIS. To find out more about Red Geographics, and to see more work by Hans, visit redgeographics.com
The Cartography and Geographic Information Society (CaGIS) promotes interest in map design and significant design advances in cartography. Avenza Systems sponsors several awards for the Student Entries at the Annual Map Design Competition which is open to all map makers in Canada and the United States. Students are highly encouraged to apply to this competition
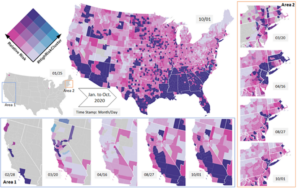
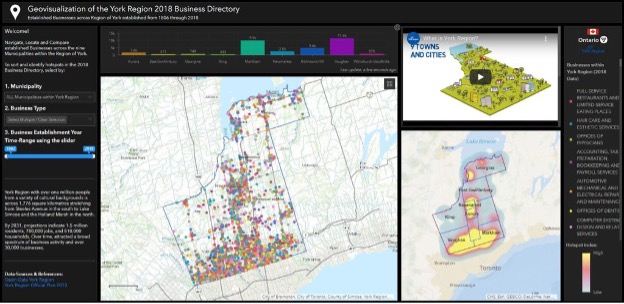
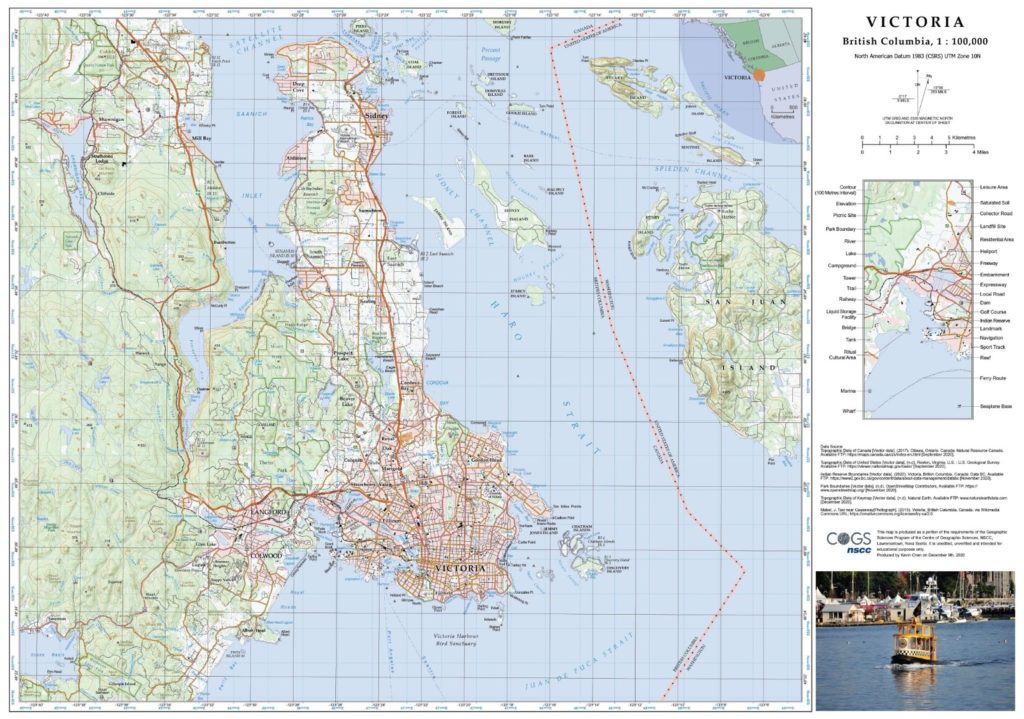
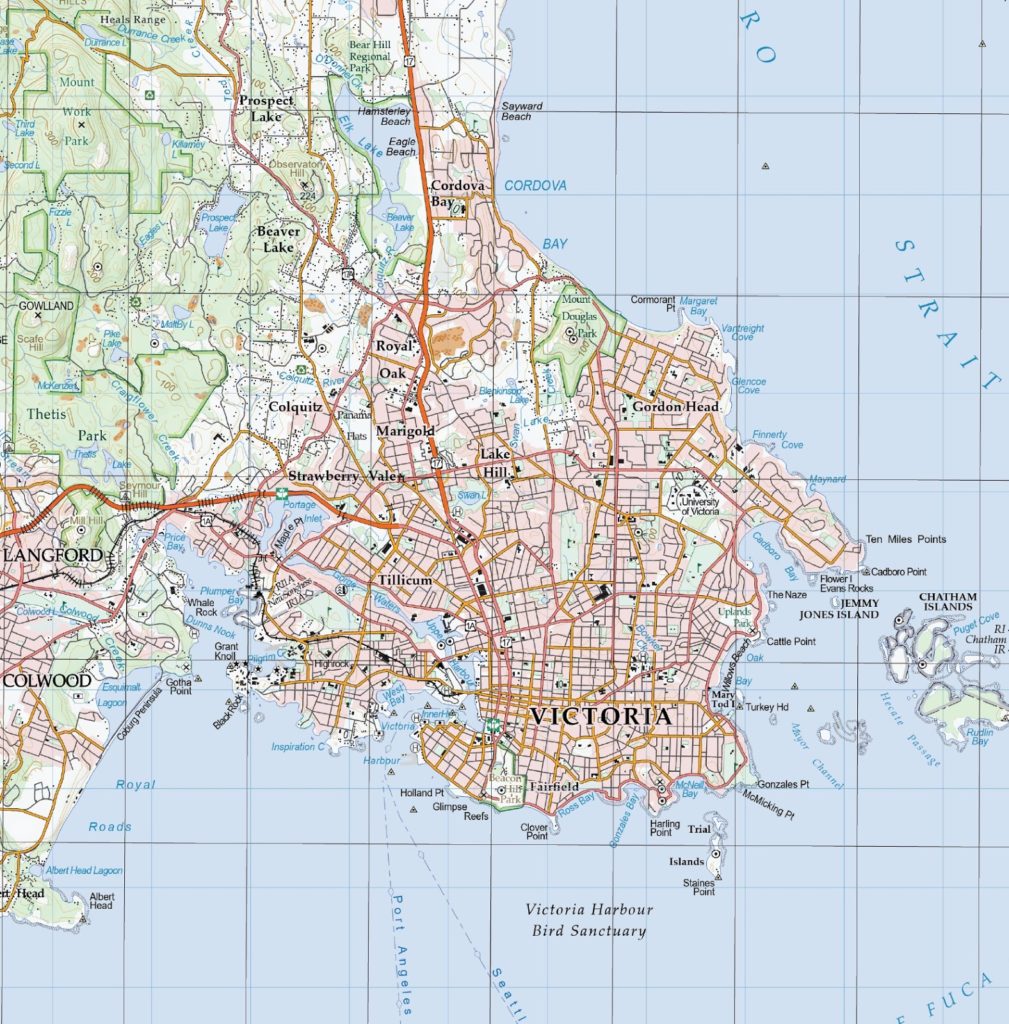
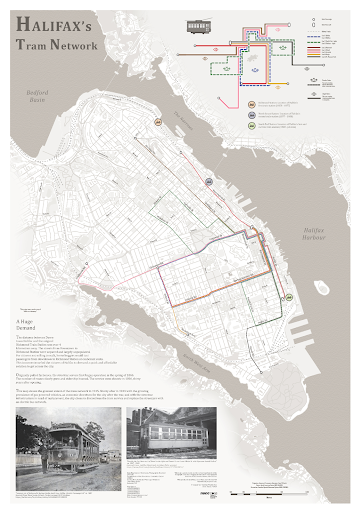
The winners of the Annual Map Design Competition 2020 include aspiring map makers from many schools throughout North America. Avenza is proud to announce that the winners of the David Woodward Digital Map Award are Yu Lan and Sridhar Lam for their maps titled ‘The Animated Bivariate Map of COVID-19’ and ‘Geovisualization of the York Region 2018 Business Directory’, respectively. In addition, Avenza is proud to announce that the winners of the Arthur Robinson Print Map Award are Kevin Chen and Nicholas Weatherbee for their maps titled Victoria and the Halifax Tram Network, respectively.
“We used the bivariate map to represent the daily relative risk and the number of days that a county has been in a cluster. In this product, users are able to discover the space-time pattern by watching and playing with the animated and interactive map.“ – Yu Lan, Ph.D. Student, UNC Charlotte
The Animated Bivariate Map of COVID-19 by Yu Lan
“Overall, the dashboard provides an effective geovisualization with a spatial context and location detail of the York Region’s 2018 businesses. The dashboard design offers a dark theme interface maintaining a visual hierarchy of the different map elements such as the map title, legend, colour scheme, colour combinations ensuring contrast and balance, font face selection and size, background and map contrast, choice of hues, saturation, emphasis etc.” – Sridhar Lam, Master of Spatial Analysis, Ryerson.
Geovisualization of the York Region 2018 Business Directory by Sridhar Lam
“This map aims to produce a detailed, accurate, and visually appealing topographic map of Victoria, British Columbia. It was generalized using data from two different scales to a final scale of 1:100,000. Hillshades were created to enhance the terrain visualization. My goal is to start a meaningful career in cartography and GIS” – Kevin Chen, Nova Scotia Community College
Victoria Map, created using Avenza MAPublisher, by Kevin Chen
Avenza will be participating in the Mapping Leaders Virtual Forum Series on the Use & Distribution of Data. A panel discussion on the opportunities and challenges illustrated through open data and government and how it all comes together in the commercial end.
Felipe Gonzalez-Macqueen
Map Store Business Development Lead
A passionate archaeologist, he earned a Master’s degree in archaeology from Western University. Over the past decade Felipe has combined his knowledge of GIS and archaeology to study ancient architecture, settlement patterns, geoglyphs and ancient road networks to better understand the Pre-Hispanic cultures of Peru. Felipe joined Avenza Systems in 2019, focusing on customer success and engagement with private and government organizations around the world, Felipe brings their map content to the Avenza Map Store platform. Felipe’s most recent publication can be found in the recently published book, ‘Quilcapampa: A Wari Enclave in Southern Peru’.
About this event
IMIA presents our annual Mapping Leaders Forum, a three part-series covering important industry topics and connecting executives from around the globe. Each hour-long discussion will be followed by breakout sessions for attendees to continue the conversation among their peers.
We will be participating in a webinar to share practical uses in Avenza desktop and mobile mapping solutions at the Oil and Gas Summit (virtual event) on November 18, 2021.
About this event
The IV Oil and Gas Summit: “Socio-economic reactivation, a national commitment” is the most important event of the oil and gas industry in Colombia, which will bring together the main players in the sector in a 100% digital environment.
For four days, attendees will be able to participate in five virtual spaces: academic agenda, technical agenda, regional agenda, business fair and business conference. It is expected to have more than 3,500 participants.
This event is organized by the Petroleum Trade Union Committee (CGP), made up of the Colombian Association of Oil and Gas (ACP), the Colombian Chamber of Oil, Gas and Energy (Campetrol), the Colombian Association of Petroleum Engineers (Acipet), the Colombian Association of Petroleum Geologists and Geophysicists (ACGGP) and the Colombian Association of Engineers (ACIEM).
Welcome back to another exciting edition of Mapping Class, a new video-blog series where we curate tutorials and workflows created by expert cartographers and Avenza power users from around the world. For this article, we are excited to introduce Hans van der Maarel, owner of Red Geographics, and expert cartographer. Joining us from Netherlands, Hans has put together a video tutorial showcasing tips and tricks for tackling Georeferencing in a variety of different mapping scenarios. In this first part, Hans goes over the basics of georeferencing in MAPublisher, using a neat city map of Zevenbergen. Tune in for Part Two, coming soon, which will reveal how Hans approaches more challenging georeferencing tasks, including dealing with unknown projection information and working with historical maps.
Hans has produced a short video walkthrough detailing part one of his georeferencing process. The Avenza team has produced video notes (below) to help you follow along.
***
Georeferencing Techniques Part One: The Basics by Hans van der Maarel (video notes by the Avenza team)
Georeferencing is the process of taking imagery or map data that lacks geographic location information and associating it with specific coordinates on Earth. Georeferencing is a very common, but sometimes challenging step that is necessary for producing accurate, meaningful cartographic products. By georeferencing map data, cartographers can ensure that the features on their maps are located correctly, and in a way that accurately represents the real world. Georeferencing also makes it easy to add and update maps with new data layers, as location information stored within the new map layers will be accurately overlaid in the correct position on older map projects. The process for georeferencing maps can be complicated, but Hans has outlined some easy-to-follow steps for quickly performing and validating simple georeferencing tasks with vector map data.
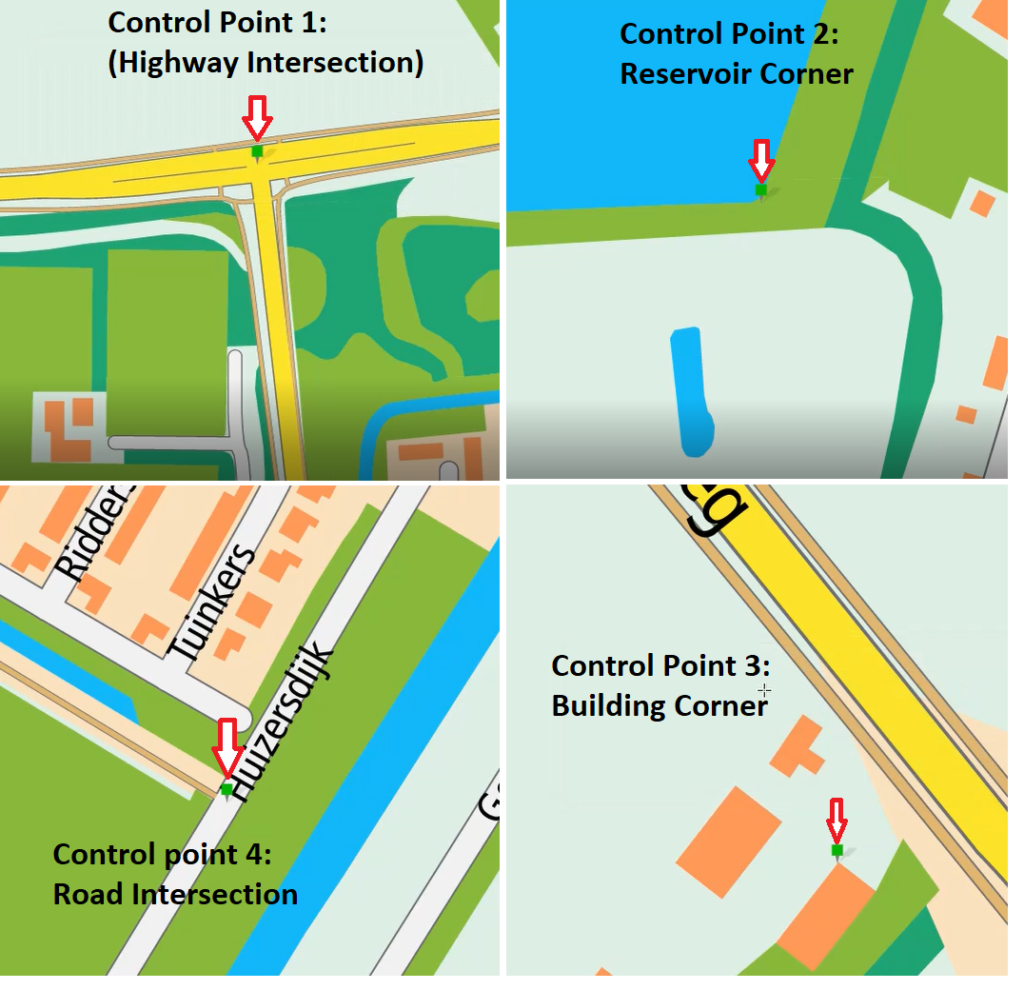
In general, effective georeferencing needs to include at minimum three known control points. In this example, Hans has included an additional fourth control point to provide additional accuracy.
When locating control points, it is a good idea to choose points that roughly approximate the four corners (quadrants) of your map area. Doing so can ensure the georeferencing result is accurate for the entire coverage of the map area and minimizes distortion/shearing effects as the map layers are matched to the final coordinate system. Cartographers should take time to ensure the chosen control points are as accurate as possible, as errors in control point placement will propagate across all locations in the map. Poor control point placement can lead to overall poor georeferencing accuracy.
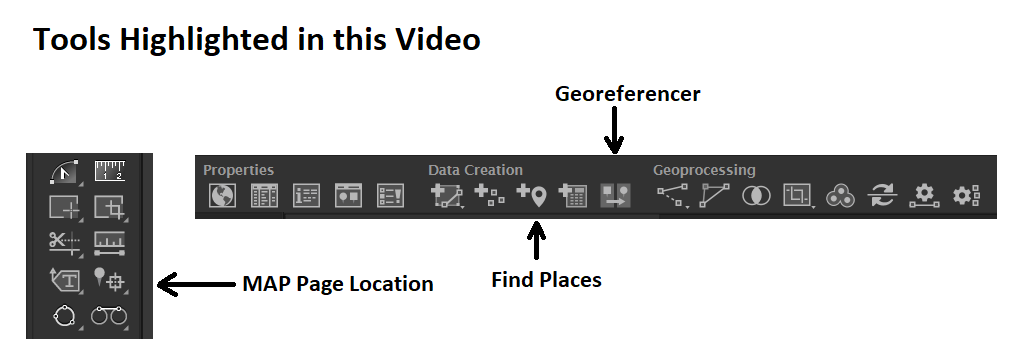
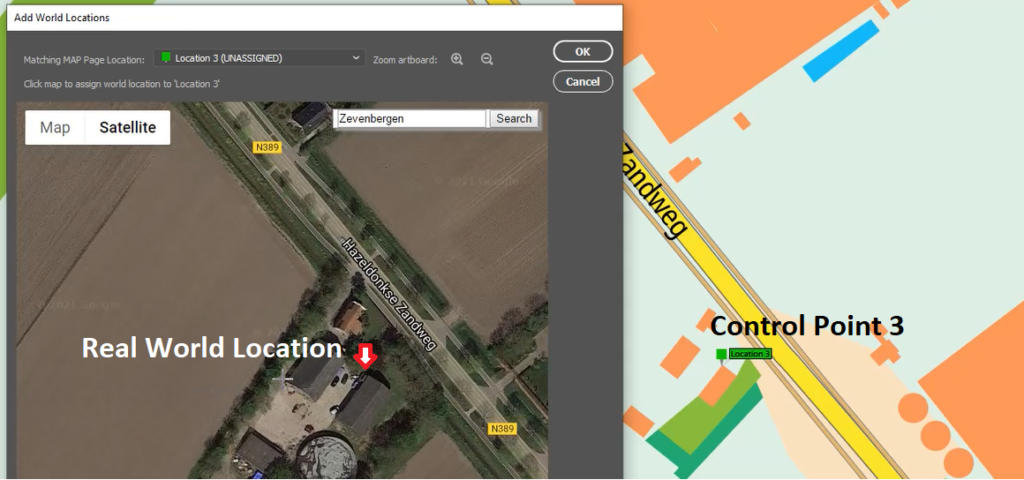
Using the MAP Page location tool, place four control points at known, easily identifiable locations. Hans recommends placing control points at recognizable map features that can be easily seen on the reference imagery. For this example, Hans chose to use the corners and edges of major structures (i.e larger buildings/reservoirs) or the centers of well-known major road intersections. When using road features as reference control points, Hans recommends using the center of the feature rather than the edge. This can compensate for variation in road edge placement that can occur when the vector line layer does not completely match the true road/lane width in the imagery.
Next, open the Georeferencing tool and select the “Add World Locations” option. From here, use the built-in web map to calculate latitude/longitude coordinates for each of your known control points. Using the satellite imagery view can make this process easier, especially when dealing with physical features on the map (i.e building corners). Repeat this for each of the four control points.
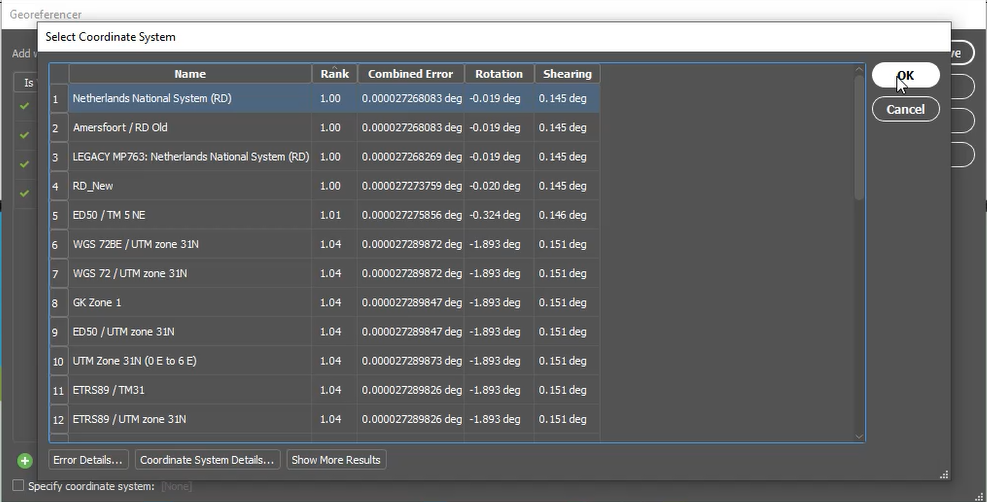
The resulting table will show a list of set coordinates for each of these control points. From here, if you already know the projection the map data is already in, you may set this coordinate system at this stage. If you are unsure, the georeferencer tool will automatically provide a suggested list of coordinate systems that match the control points you have set. These “best” matches are provided based on measuring the error between your user set coordinates and the real-world locations on the web map. Ideally, you want the lowest combined error value. In general, the suggested coordinate systems at the top of the list are often the best choice.
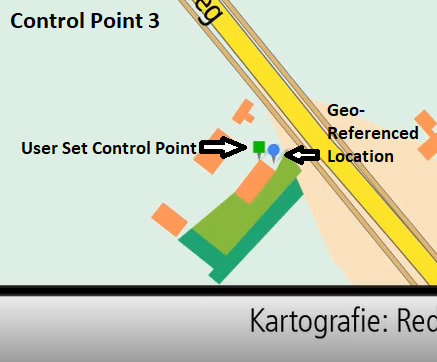
Once you select the desired coordinate system, the tool will automatically create a new MAP View where you can house your newly georeferenced map data. You will notice that the MAP Page Locations you created earlier will be displayed alongside the newly georeference control points. This is a great way to help validate your georeferencing as you will be able to observe the accuracy (or inaccuracy) of your placed control points.
Finally, it is a good idea to use the Find Places tool to validate your georeferencing results. Try searching for identifiable landmarks or major features on your map (i.e. train stations). Simply search for a location using the Find Places tool, and compare this to the georeferenced locations on your map.
This concludes Part One of “Georeferencing Techniques with Hans van der Maarel“. Now that you have covered the basics of Georeferencing in MAPublisher, tune in for part two in the next edition of Mapping Class. There you will see how Hans tackles more complex georeferencing projects, including what to do when you have small-scale maps that come from scanned or printed images, or where projection or referencing information is unavailable. Hans will be using a beautiful historical map of northwest Africa to demonstrate this problem. Look for it in the Avenza Resources Blog next month.
***
About the Author
Hans van der Maarel is the owner of Red Geographics, located in Zevenbergen, Netherlands. Red Geographics is a long-time partner of Avenza and Hans is a well-known power user of both MAPublisher and Geographic Imager. He uses the products for a wide range of cartographic projects for several international organizations and offers training courses and consultancy expertise aimed at developing workflows for clients. In addition to that, he is currently a board member of NACIS. To find out more about Red Geographics, and to see more work by Hans, visit redgeographics.com
Toronto, CA (October 26, 2021) – Avenza Systems Inc., producers of the Avenza Maps® app for mobile devices is pleased to announce the upcoming releases of MAPublisher® 10.9 for Adobe Illustrator® and Geographic Imager® 6.5 for Adobe Photoshop® 2022 These updates will provide a range of user interface improvements, feature enhancements, bug fixes, and performance upgrades, along with compatibility with the latest Adobe Creative Cloud applications.
Data-driven Map Design in Illustrator with MAPublisher
MAPublisher cartography software seamlessly integrates more than seventy GIS mapping tools into Adobe Illustrator to help you create beautiful maps from GIS data. Import industry-standard GIS data formats and make crisp, clean maps with all attributes and georeferencing intact using the Adobe Illustrator design environment.
Expected new features of the MAPublisher 10.9 extension for Adobe Illustrator include support for import and export of vector Geopackages, import of TopoJSON files, new “Geodesic” buffers, a default simplification setting, bug fixes, user interface enhancements, and much more.
Powerful Imagery Editing in Photoshop with Geographic Imager
Geographic Imager for Adobe Photoshop delivers an all-encompassing solution to import, edit, and export geospatial images such as aerial and satellite imagery. Work with digital elevation models, GeoTIFFs, and other popular GIS image formats while using Adobe Photoshop features such as transparencies, filters, cropping, and image adjustments; all while maintaining georeferencing and support for hundreds of coordinate systems and projections
Expected improvements of the Geographic Imager 6.5 extension for Adobe Photoshop include functionality enhancements for several tools, performance improvements, bug fixes, and more. Additional feature upgrades to be announced soon.
Upgrade or Purchase
MAPublisher 10.9 will be available free of charge to all current MAPublisher users with active maintenance and as an upgrade for non-maintenance users starting at US$649. New licenses are available from US$1499. MAPublisher FME-Auto and MAPublisher LabelPro are also available as add-ons starting at US$499.
Geographic Imager 6.5 will be available and free of charge to all current Geographic Imager Maintenance Program members and starts at US$349 for non-maintenance upgrades. New fixed licenses start at US$749. Geographic Imager Basic Edition licenses start at US$99.
Academic, floating, and volume license pricing is also available for both extension suites.
More about Avenza Systems Inc.
Avenza Systems Inc. is an award-winning, privately held corporation that provides cartographers and GIS professionals with powerful software tools to make better maps. Avenza also offers the mobile Avenza Maps app to sell, purchase, distribute, and use maps on iOS and Android devices. For more information, visit www.avenza.com. For further information contact: 416-487-5116 – info@avenza.com – www.avenza.com
Toronto, ON, April 27th, 2021 – Avenza Systems Inc., producers of the Avenza Maps® app for mobile devices and geospatial plugins for Adobe Creative Cloud®, including Geographic Imager® for Adobe Photoshop®, is pleased to announce the release of MAPublisher® 10.8 for Adobe Illustrator®. This latest version provides user interface and usability enhancements for several tools, an updated coordinate systems library, raster ECW format support, and other mapping engine enhancements.
MAPublisher cartography software seamlessly integrates more than seventy GIS mapping tools into Adobe Illustrator to help you create beautiful maps from GIS data. Import industry-standard GIS data formats and make crisp, clean maps with all attributes and georeferencing intact using the Adobe Illustrator design environment.
New features of the MAPublisher 10.8 plugin for Adobe Illustrator include:
User Interface and Tool Improvements:
Multi-select attribute columns to batch modify attribute properties
Line Plotter allows multi-select MAP locations
MAP Themes now includes overprint options
Document Summary panels will now provide MAPublisher “last saved with” version information
Scale Bar, Create Legend, and Elevation Profile preview panel can now display background colours
Raster ECW Support: Import and work with Enhanced Compression Wavelet files
Updated Coordinate Systems: Engine enhancements including an updated coordinate system library
MAPublisher 10.8 is immediately available free of charge to all current MAPublisher users with active maintenance and as an upgrade for non-maintenance users starting at US$649. New licenses are available from US$1499. MAPublisher FME-Auto and MAPublisher LabelPro are also available as add-ons starting at US$499. Academic, floating, and volume licences are also available. Prices include one year of full maintenance. Read more about MAPublisher 10.8 in our release blog, or visit www.avenza.com/mapublisher for more details.
More about Avenza Systems Inc.
Avenza Systems Inc. is an award-winning, privately held corporation that provides cartographers and GIS professionals with powerful software tools to make better maps. Avenza also offers the mobile Avenza Maps app to sell, purchase, distribute, and use maps on iOS and Android devices. For more information, visit www.avenza.com.