


The visual portrayal of quantitative and qualitative data is a process that requires the right tools. You want your audience to be able to make sense of the data you are sharing and be able to weave that data into a compelling and inspiring story. Here is how Avenza MAPublisher and Geographic Imager assisted Robert Simmon, Senior Data Visualization Engineer at Planet.
Robert isn’t your typical data visualization engineer who had formal training in scientific graphic design or cartography. His passion and interest in computer graphics and a master’s degree in materials science gave him the technical skills to start turning numbers into pictures that eventually helped him communicate with research scientists in his professional career.
Robert’s stepping stone into the fields of cartography, design, and data visualization happened during his work at NASA, where one of his first projects was creating a CD-ROM that would allow students and the interested public to explore a global ozone dataset. During his work there, he began to realize that the graphics published and used by NASA were made more for other scientists than for a broad audience. He also realized that good design was a powerful tool to improve communication. So, he tried to re-create scientific graphics in a more user-friendly form, with mixed success. “It wasn’t until I attended a talk by a popular lecturer on visualization that I learned there was a theory behind good design, and a big lightbulb went off in my head,” says Robert. “I began to read everything I could get my hands on about design, data visualization, and cartography—particularly map projections and the use of colour to encode information, since so much visualization at NASA revolved around satellite remote sensing data, which is quantitative and inherently geospatial.”
Eventually, Robert went on to found the Earth Observatory to share the breadth of NASA’s Earth science research with the interested public. After more than a decade with NASA, he received the chance to join the exciting startup—Planet—and work with an unprecedented, high-resolution, global dataset.
Robert developed a fairly unconventional workflow centred around Adobe design tools rather than GIS or scientific visualization software. This is where the Geographic Imager plugin for Adobe Photoshop and MAPublisher plugin for Adobe Illustrator proved invaluable to bridge the gap between data and visualization.
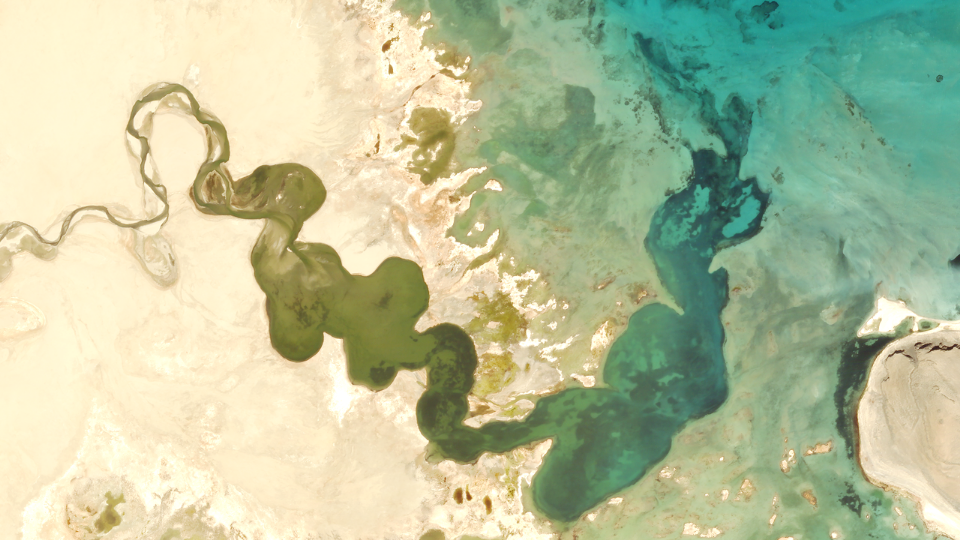
Today, Robert’s day-to-day work largely revolves around processing visible and near-infrared imagery. Every image he works with gets imported into Photoshop with Geographic Imager. Creating maps in Adobe has proven to be effective and highly efficient as software like Adobe Photoshop possess powerful colour-correction tools, fast previews, layers, high bit-depth support, and undo history options.
This aids highly competent visualizers to work seamlessly and flexibly until an image is made perfect. Robert uses Geographic Imager to merge multiple adjacent image scenes or align a time series to make an animation (even if they’re in different projections), all with a single “import” step. He then exports the file as a GeoTIFF, so the image can later be combined with other, complementary data.
Although Robert enjoys working with imagery, he has had the most fun combining multiple data sources, especially raster and vector. Delving into his design workflow a bit deeper, he involves both Adobe Photoshop and Illustrator together. In Adobe Photoshop/Geographic Imager he works on the initial colour work and crops his desired map extents, then imports it into Illustrator/MAPublisher to overlay with vector data and create masks. “It’s particularly useful to be able to crop the imported vector data to match the area of interest, rather than having to manually select and delete objects that lie outside the Illustrator artboard,” says Robert. After setting up his vector layers, he then exports them as a layered Photoshop file and re-combines them with the original raster imagery, to ensure pixel-perfect accuracy.
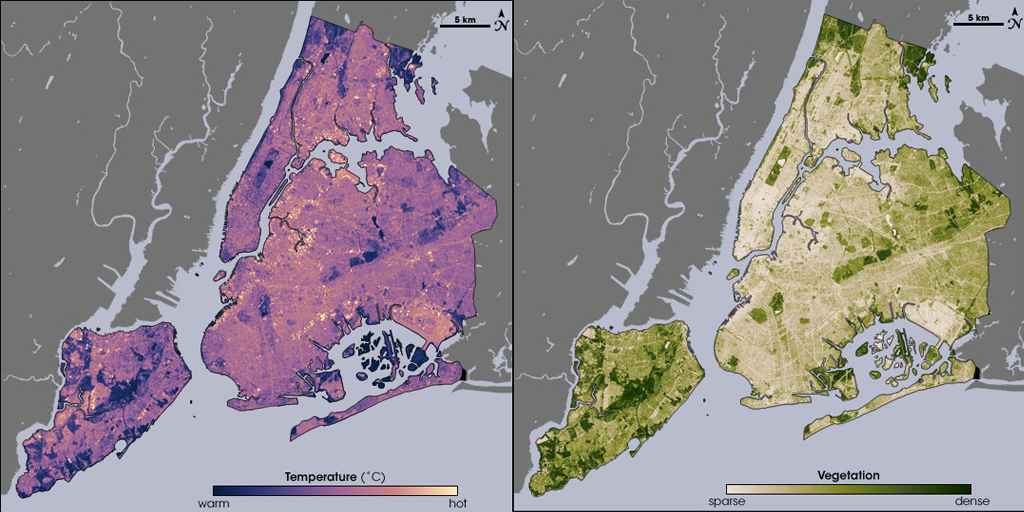
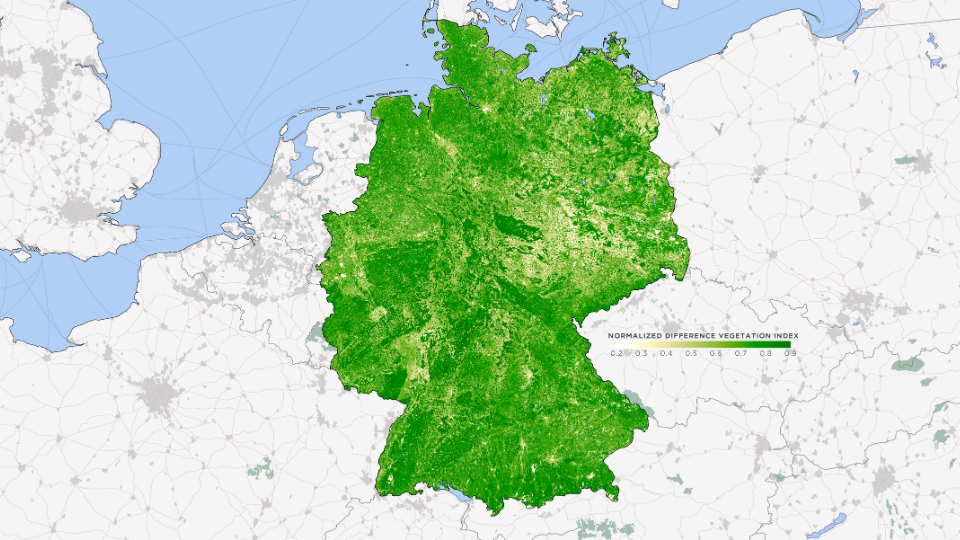
Robert’s love for MAPublisher goes back to 2006 when he first used it to make maps with Landsat data. He used MAPublisher to create a water mask with ZIP code data, which was the only data source he could find with high enough resolution to accurately capture the jutting piers of lower Manhattan. Robert also used MAPublisher to create a map of Amazonia (one of his personal favourites from his portfolio) with the help of MAPublisher’s powerful attribute tools, which allowed him to select and merge data vector data of Amazon biome, distinct from the Political Amazon, for which data is readily available. He continued to create variations on this theme at Planet, including a map of the vegetation of Germany. It was derived from a Planet Surface Reflectance Basemap and given context with Natural Earth boundary, urban area, and transportation data.
Robert continues to tweak his colour palette for his vegetation maps since just being ‘good enough’ has never really been his forte.
_______
In collaboration with Robert Simmon, Senior Data Visualization Engineer at Planet.