


Infographics are a great way to transform less than exciting data into a visualization that is both digestible and fun to look at. Adobe Illustrator and MAPublisher work perfectly together to make infographics simple like the one I made for National Spumoni Day.
You might have noticed, we like to celebrate national food days here at Avenza Systems. Instead of making just a map to celebrate this layered frozen delight, I made an infographic, containing not just one but two maps! Using a combination of Adobe Illustrator and MAPublisher tools, this infographic has graphs and two maps teaching you fun facts all about spumoni, gelato, and ice cream. Curious about how I made it? Keep reading!
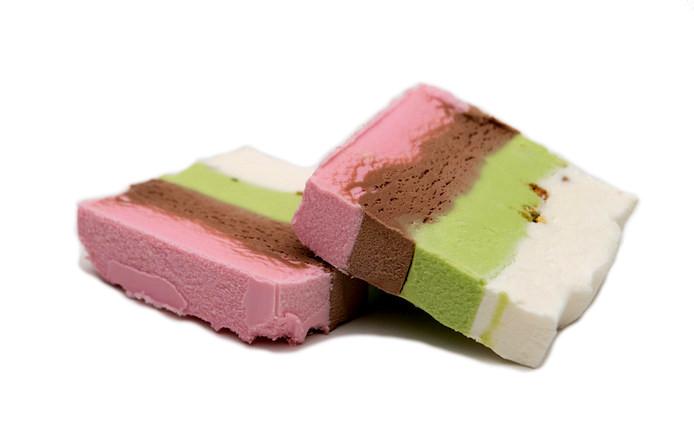
What is spumoni you may ask? Spumoni is a molded gelato with different layers and, usually containing nuts and fruit! Spumoni is usually 3-4 flavours. Cherry, pistachio, and chocolate or vanilla are the most common.
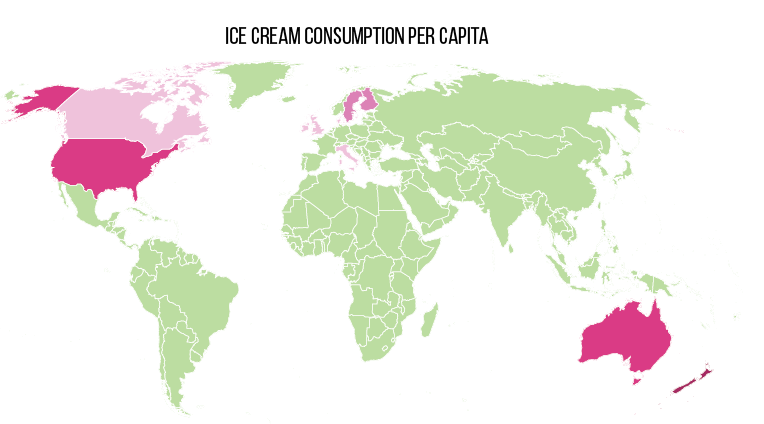
The infographic consists of two different maps; one showing the amount of ice cream eaten per capita around the world, and another showing the amount of milk produced per year by country.
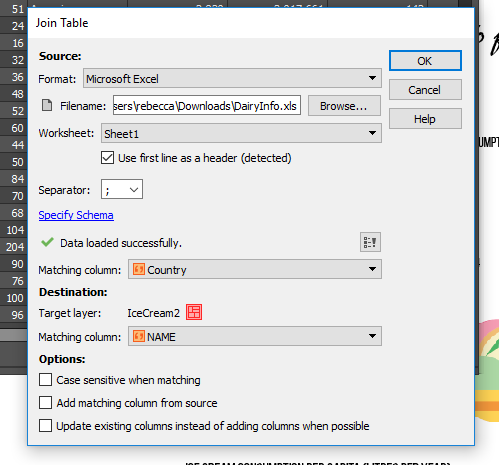
To create each map, an Excel spreadsheet was created with information about the countries milk production, as well as the average amount of ice cream eaten. Once the spreadsheet was created, I joined the tables in the MAP Attributes.
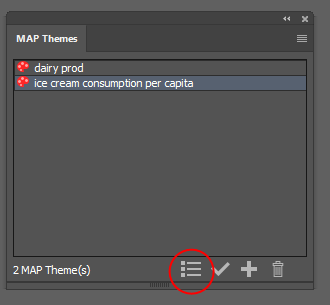
Once the tables were joined, I used MAP Themes to stylize the maps. MAP Themes are an easy way to stylize areas, lines, and points. I created a MAP Theme for each map, based on the attributes I created. One MAP Theme for the dairy production, and one for ice cream consumption. I used the ‘Batch Generate Rules’ option and chose 5 classes. I then chose the fill colour to be a custom colour group I created with spumoni-inspired colours.
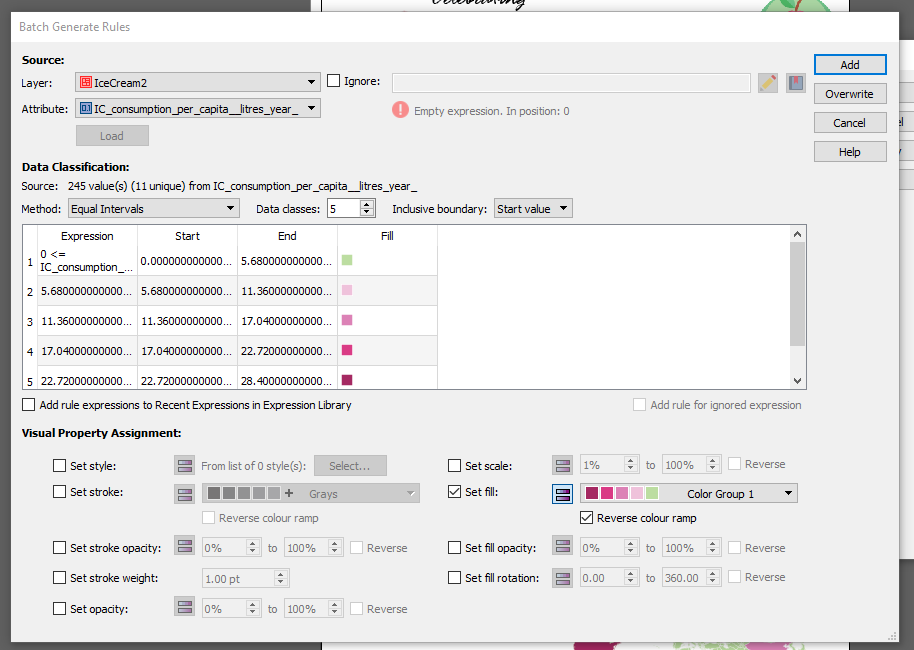
Once I’d generated my rules, I applied my MAP Theme. I then followed the same steps for the dairy production map.
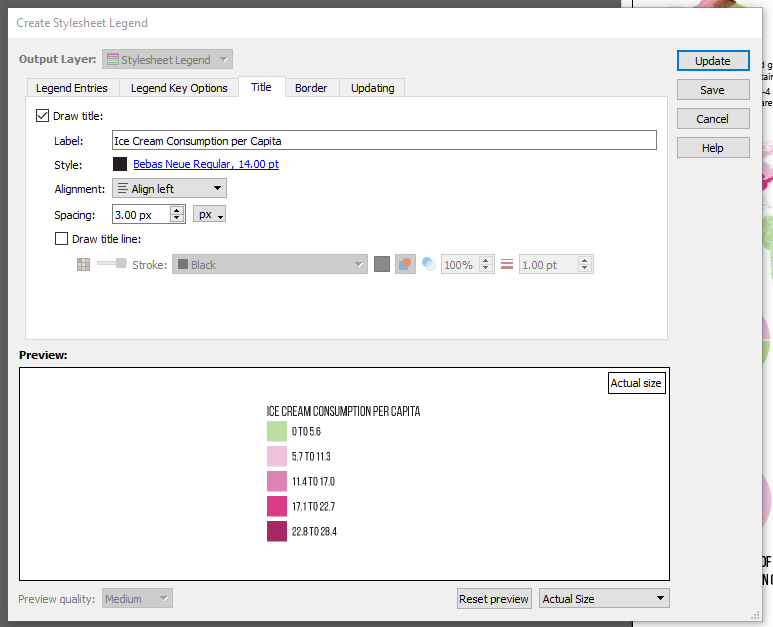
My favourite part of MAP Themes is that it’s super easy to create a MAP Theme legend after. To create a MAP Theme legend, select your MAP Theme Stylesheet and click the Legend button at the bottom of the window.
There are lots of options for customization when creating the legend. You can change the legend entries size, and the legend key font, size, colour, as well as details about the title, and the border.
Once the legend was created, I created the graphs using Adobe Illustrator’s Graph Tool. The graphs use the same colours as the maps, and for finishing touches I added the ice cream symbols and fun facts. Click below to see the finished infographic. Have fun celebrating National Spumoni Day, and have fun making your own infographics!
About the Author
Rebecca Bennett is a member of the Support team at Avenza Systems and loves ice cream almost as much as she loves making creative and visually appealing maps.