


In the latest release of MAPublisher, version 10.3, we added some great new features including the ability to create elevation profiles. The new Elevation Profile tool allows you to create an elevation plot using elevation information from anchors (vertices) of a line as long as there is a single path in a MAP View, with a coordinate system. You can also use the Elevation Profile tool to easily make changes to an existing MAPublisher elevation profile.
Example 1 – Trail Elevation
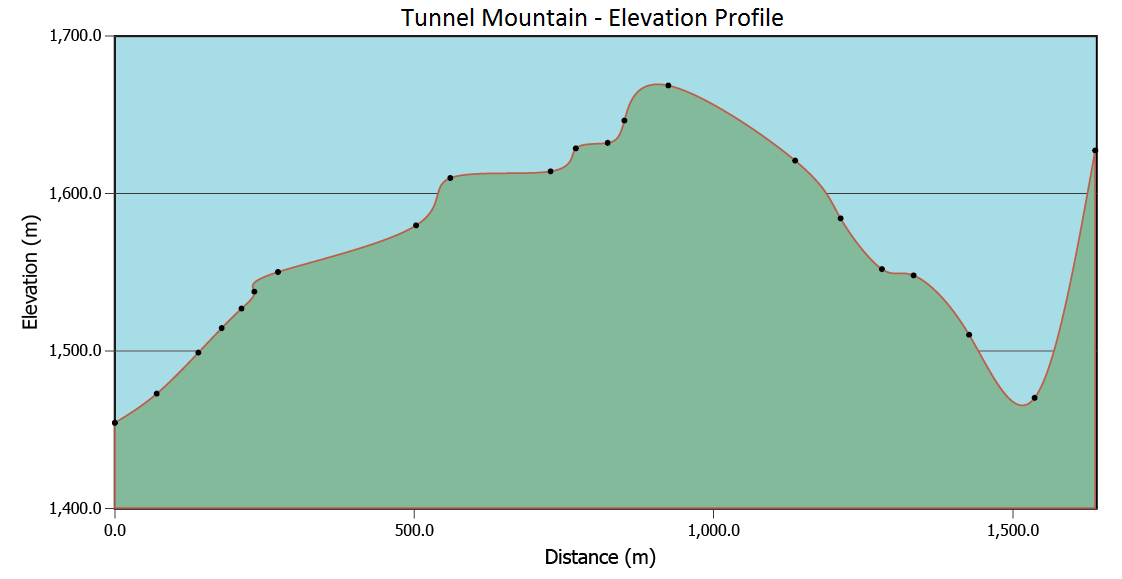
For the first example – take a satellite image of Tunnel Mountain in Banff, Alberta. I gave the image a coordinate system and georeferenced it in Geographic Imager then imported into MAPublisher as a GeoTIFF. Using the pen tool, I replicated the trail system for Tunnel Mountain while adding anchor points (vertices) throughout the line feature. These anchor points are the source of the elevation information in the resulting profile. Alternatively, you can import the trail data from another source and add your own additional anchor points using the Add Anchor tool. The screenshot below shows the anchor points indicating each line vertex.
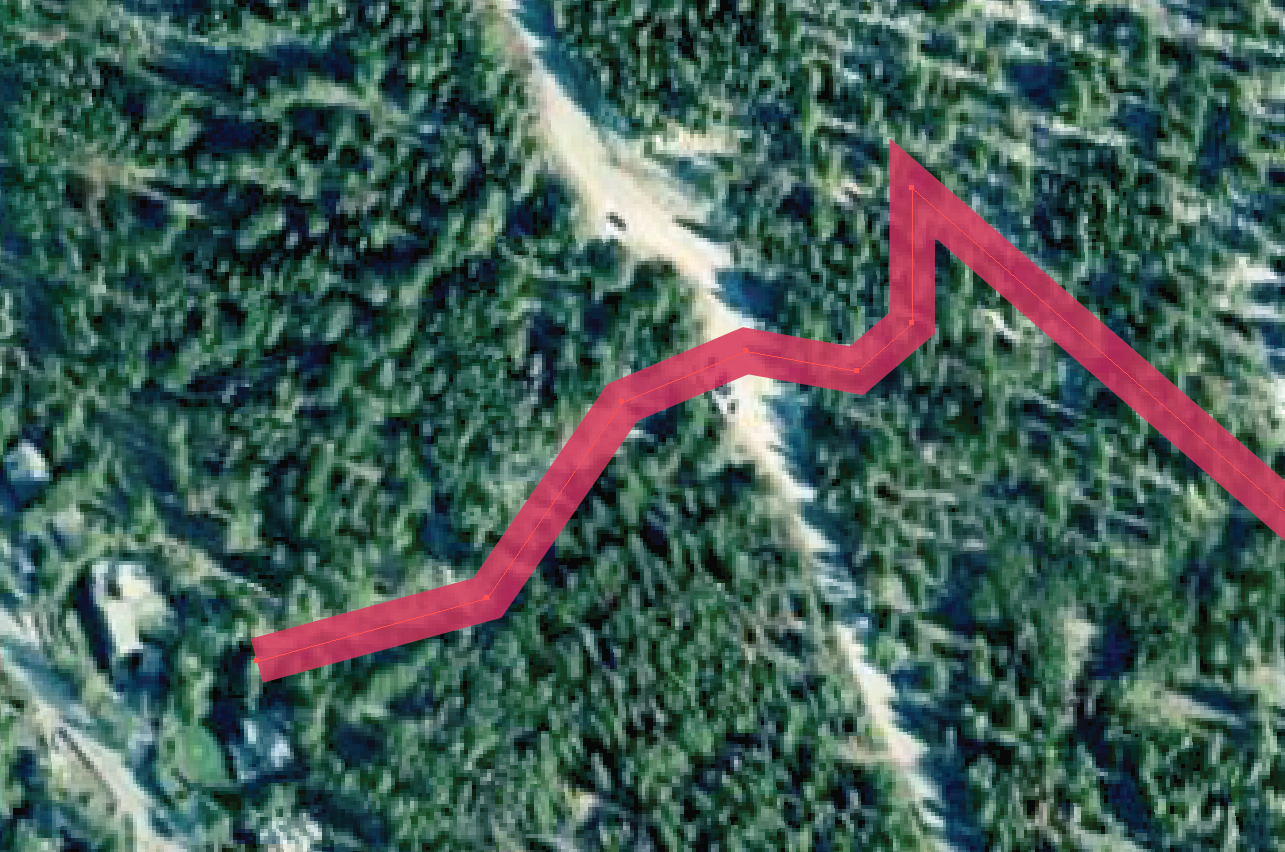
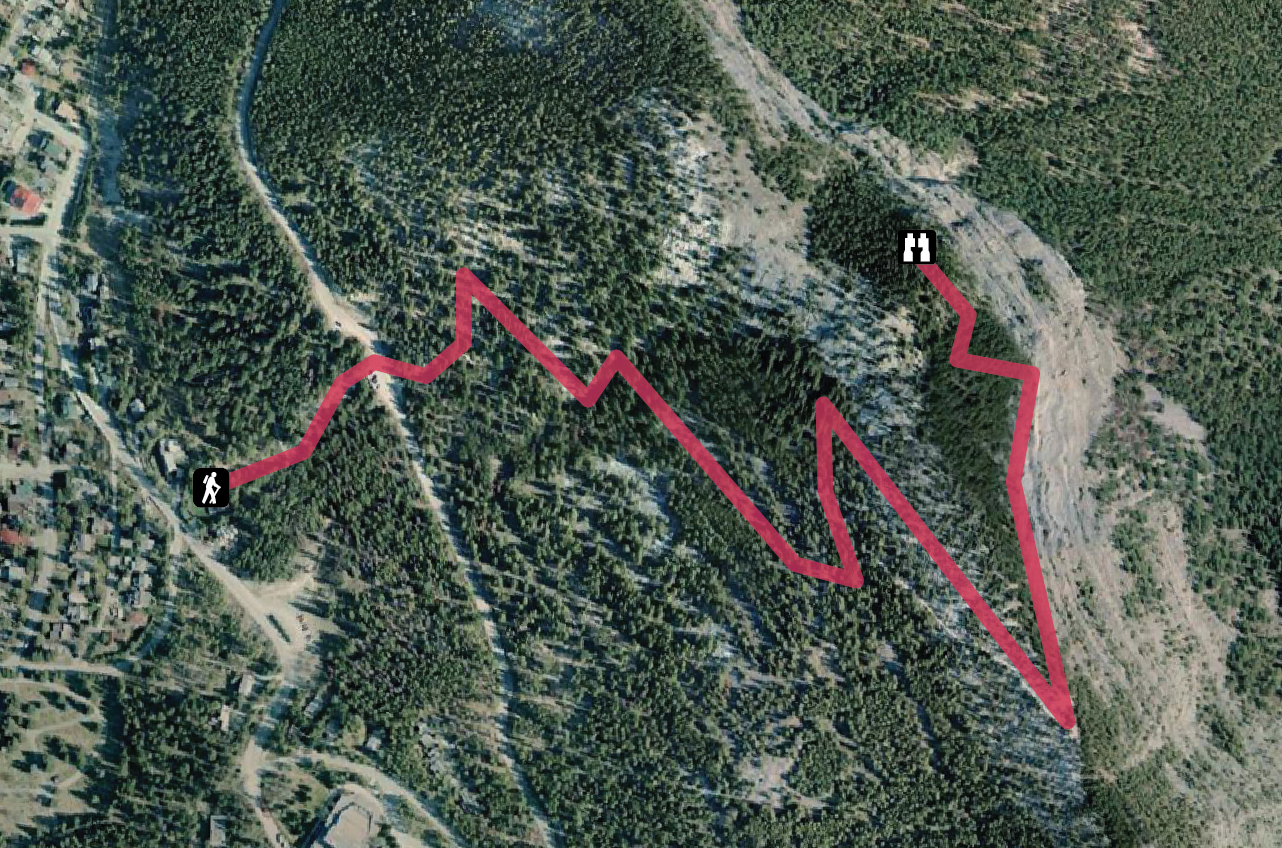
These anchor points correspond with the points on the elevation profile below. Once finished, select the line feature to access the Elevation Profiles tool.
Editing Profile Options
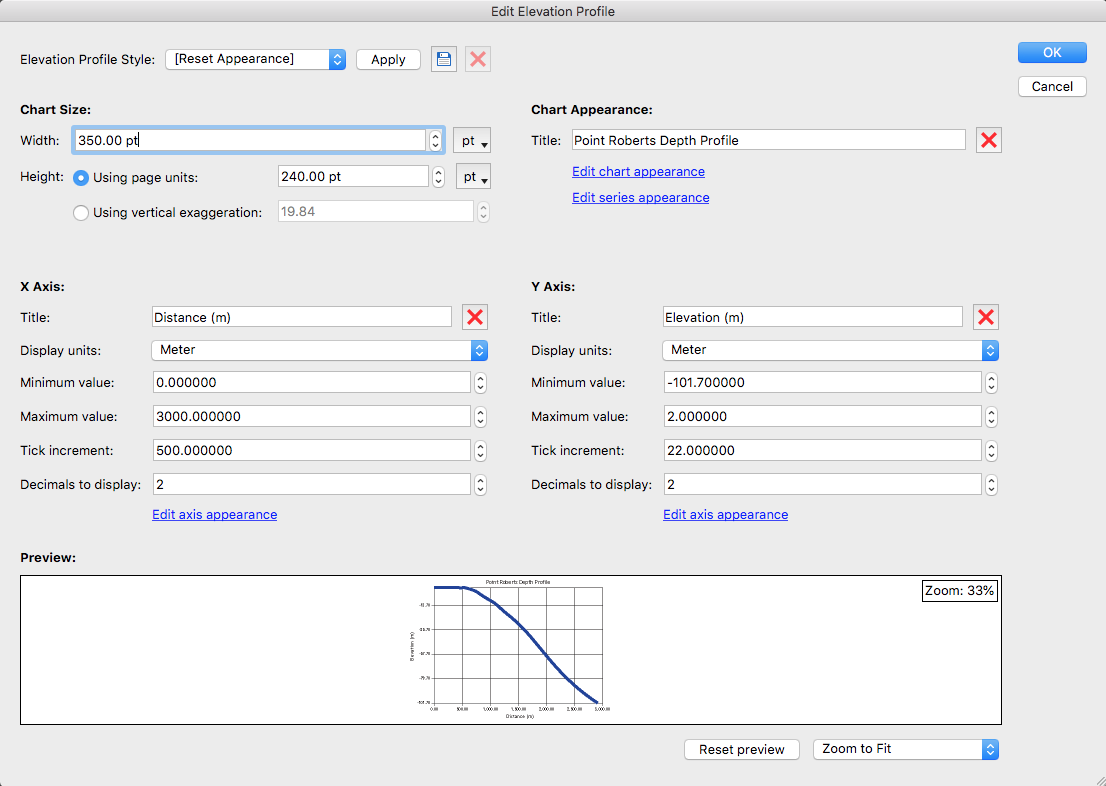
The Edit Elevation Profile window lets you customize your profile manually with advanced customization tools or using a simplified built-in MAPublisher style. The advanced tools allow you to alter the size of the profile, intervals, axes, colour scheme, units of measurement and plenty more to ensure that you can make your profile unique and convey the desired information. For example, select “Edit series appearance” as shown in the screenshot, to choose whether you want your series to be a smooth line, or to display your individual anchor points. Additionally, select “Edit axis appearance” to customize the colour of your grid or change the appearance of your labels. Customize the look of your profile with the built-in stylized templates.
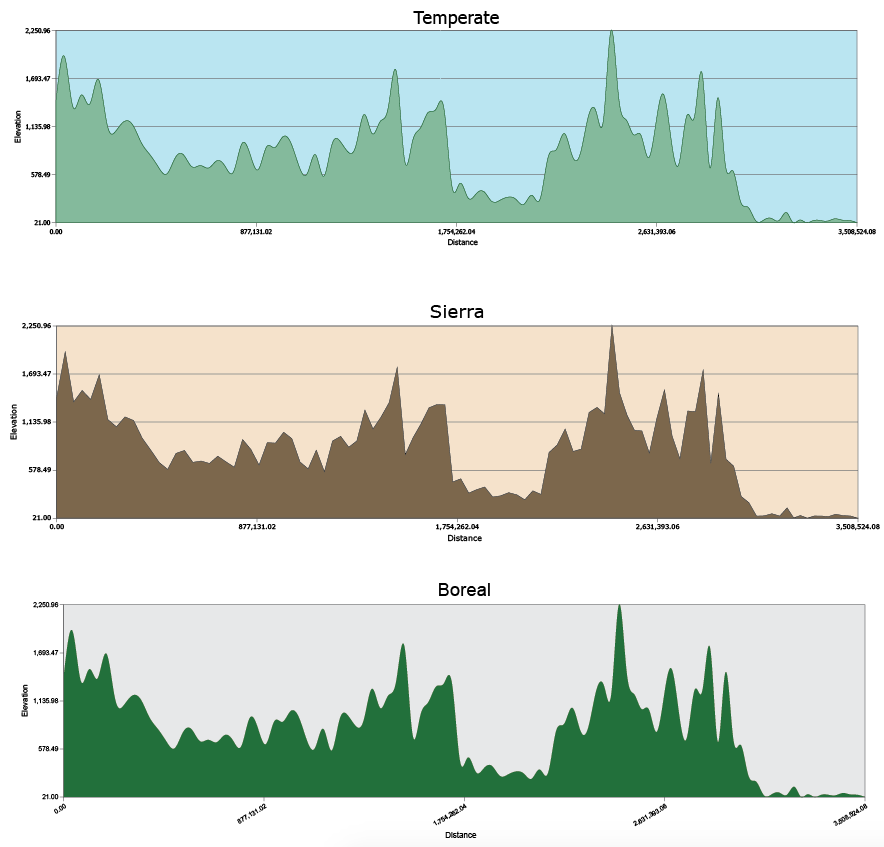
I chose the “Temperate” style, for the example profile below, to stay true to the land cover as you can see above.
Now, in addition to making great trail maps in MAPublisher, the Elevation Profile tool allows you to create a valuable extra feature which could be exceptionally beneficial for hikers!
Try experimenting with the additional built-in styles that reflect the appearance of other land types available as well, such as Sierra, Arid, Boreal, and Fluvial which is featured in our next example.
Example 2 – Fluvial Depth Profile
The nautical map below takes aerial imagery from the National Agriculture Imagery Program (NAIP). Depth data is extracted from the line feature that extends from the marina into the Strait of Georgia in Washington, USA. 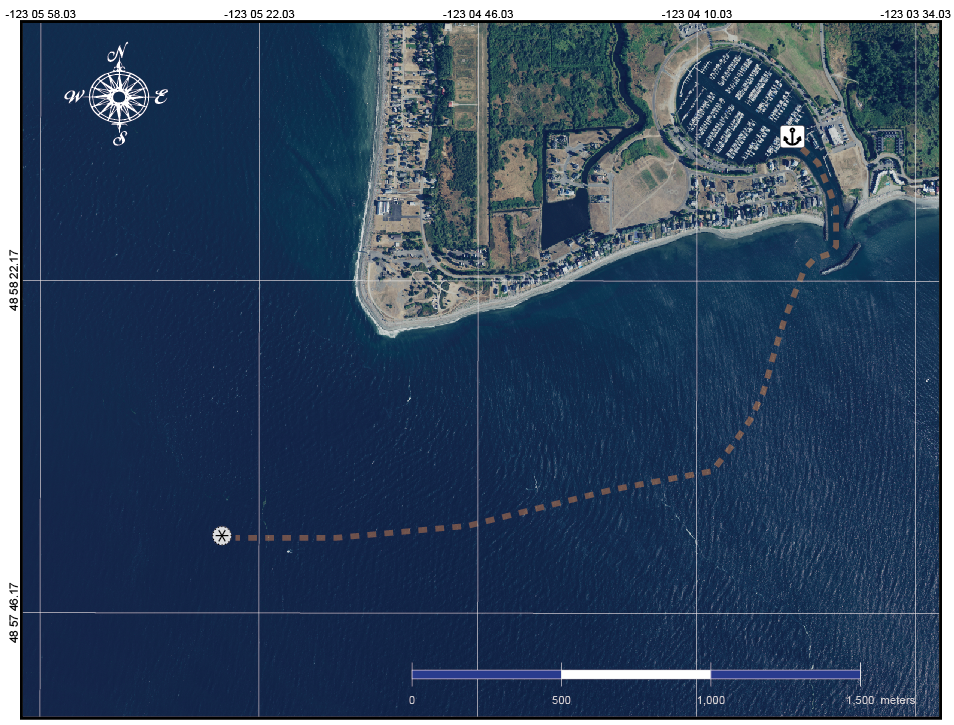
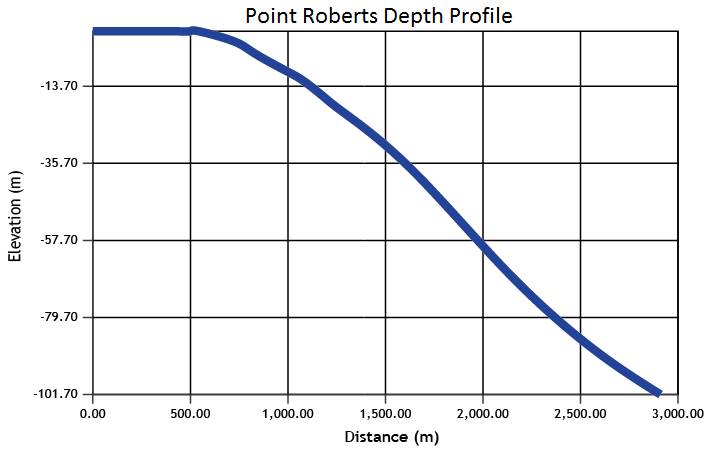 The fluvial depth profile shows the increase in depth the deeper into the Strait.
If you import track data into MAPublisher and add your own anchor points, you can see the elevation or depth reached on your excursion by creating an elevation profile from your track.
Depending on where you drop your anchor points, you can convey everything from coastal change by creating elevation profiles for a temporal series of aerial photos of the same area, to elevation or depth change of a hiking trail on a mountain in one of Canada’s most popular destinations or a sailing trip off the west coast.
Summing Up
With the release of MAPublisher 10.3, you can now make beautiful maps that also communicate elevation information with ease. The new Elevation Profiles tool will help make your maps that much better!
About the Author
Andrea Becker is a member of the Support team at Avenza Systems. She helps clients take their cartography to new heights with MAPublisher design tools.