


We are thrilled to announce the release of MAPublisher version 11.7, the latest update to our MAPublisher extension for Adobe Illustrator.
MAPublisher 11.7 introduces support for database connections in the Manage Data Links tool, compatibility with FME Form 2025, as well as other performance enhancements and bug fixes.
Here’s what you can expect with the latest MAPublisher 11.7 release:
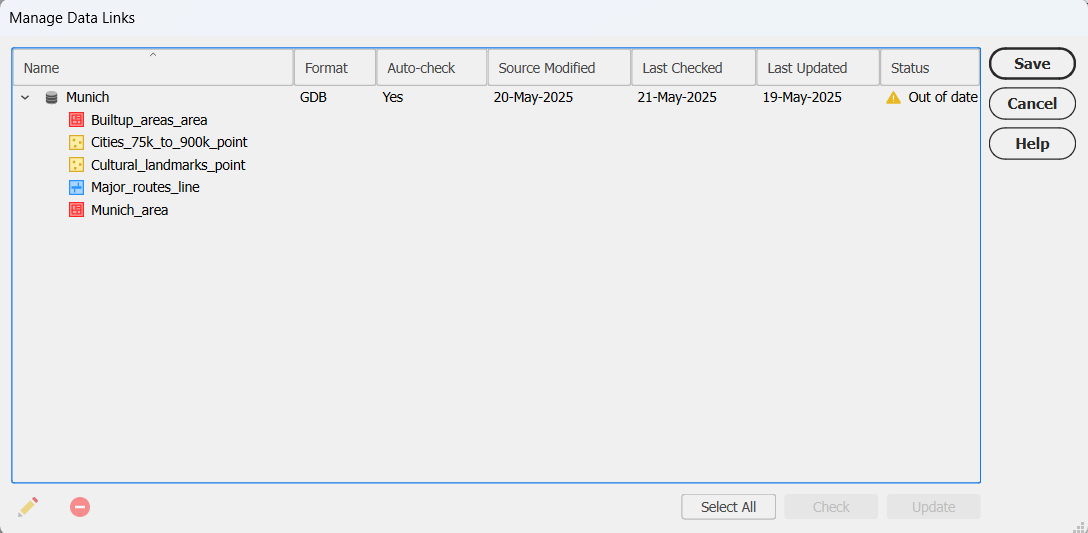
Manage Data Links with database connections
Are you tired of re-importing your databases every time you make changes to them? Well we have great news for you! We are excited to report that with MAPublisher 11.7, the Manage Data Links tool now supports connections with database formats such as PostGIS databases and Esri Geodatabases!
Visual cues for out-of-date datasets
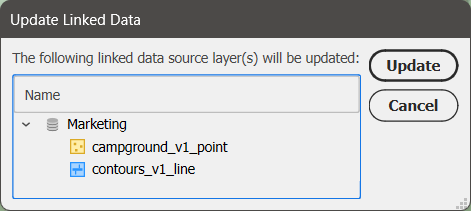
Linked databases can now be managed and updated using the Manage Data Links dialog box, which can be accessed from the MAP Views panel. Database formats such as MDB or GDB will display a yellow warning icon in the status column to notify you that the source database is out of date. Simply click the Update button in the bottom right corner of the dialog box to sync your data changes!
Linking your databases to MAPublisher is also a great way to quickly sync and update the data on your maps without having to re-style the data. MAP Themes are automatically applied to new data added to a previously styled MAP Layer.
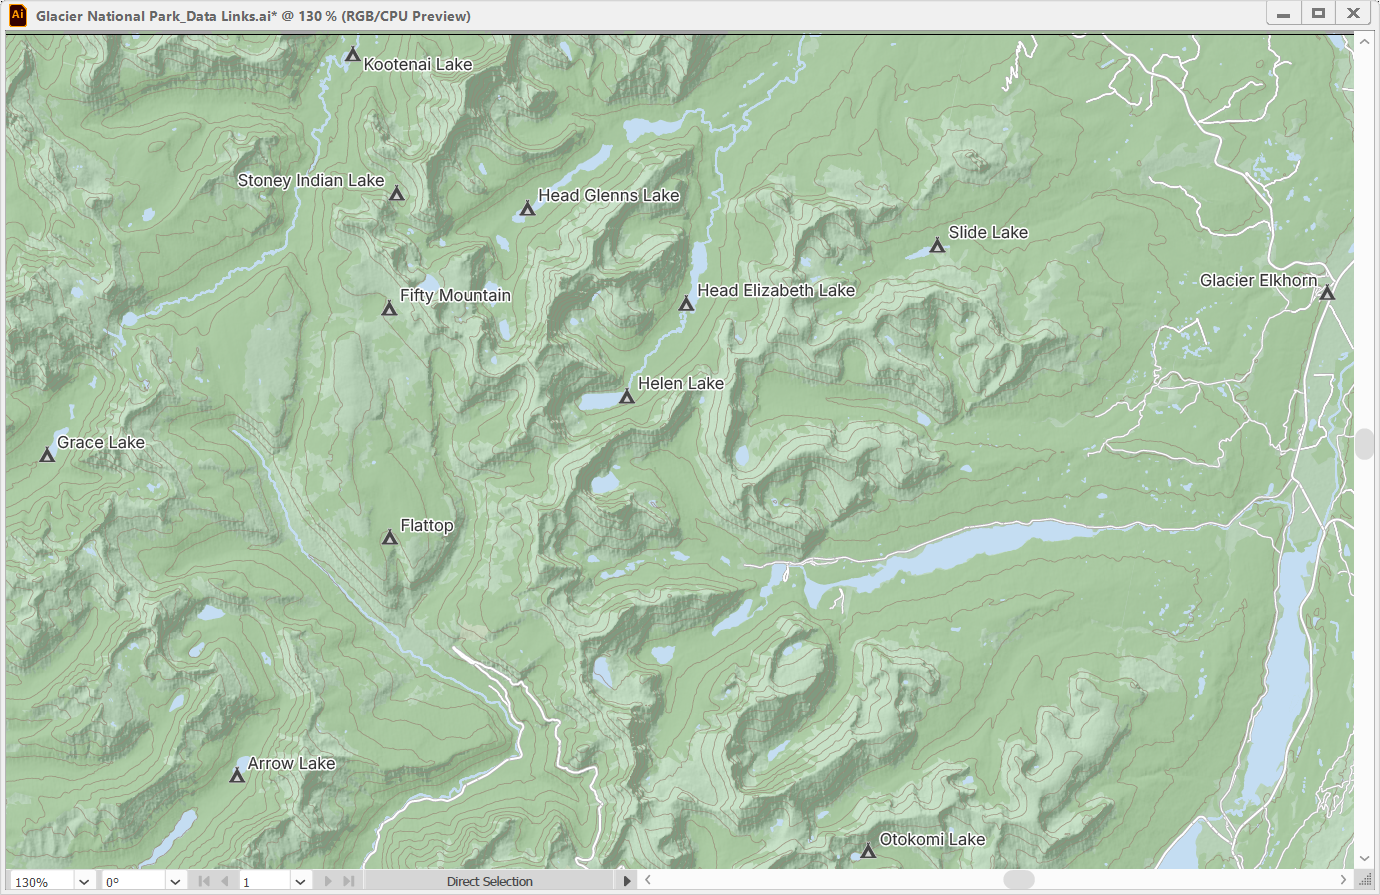
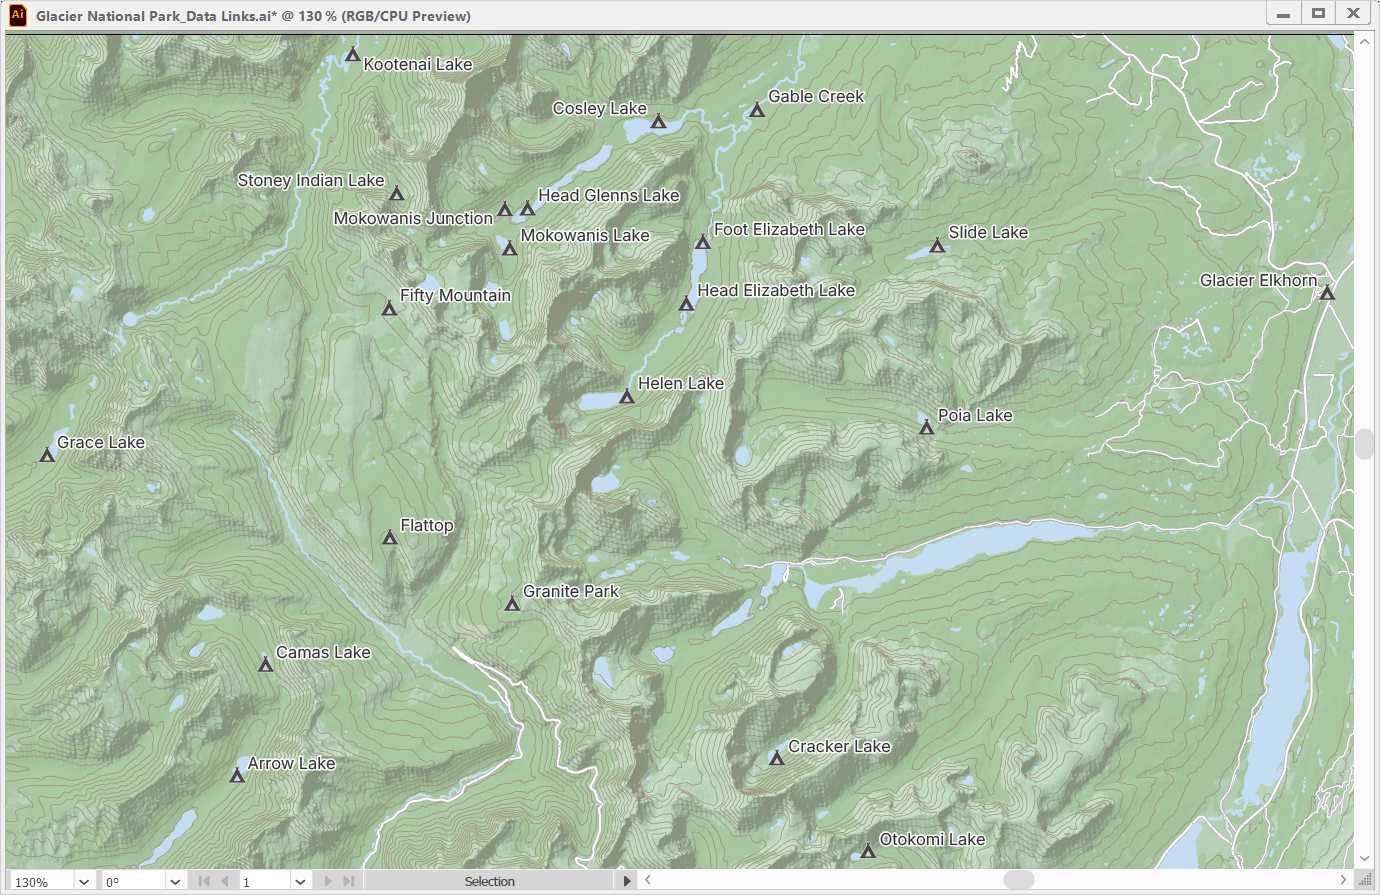
In the example below, a map showing campsites within Glacier National Park has campsite point data and contour line data stored in a PostGIS database.
Opening the Manage Data Links window is not the only way to update your linked databases. The MAP Views panel also features visual cues that warn users whether their datasets connected from linked databases are out of date or available to be updated. These will appear as yellow symbols for file-based databases such as GDB and MDB.
Unlike file-based databases, which store data as files with detectable modification timestamps, PostGIS databases are server-based and do not provide a reliable way to track changes. As a result, MAPublisher cannot automatically detect updates in PostGIS datasets. Instead, PostGIS datasets will display a grey update icon next to them, allowing you to pull possible updates at any time.
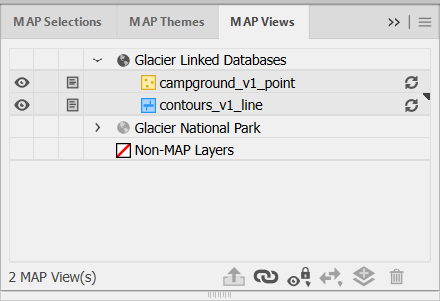
Clicking this icon will open a prompt where you can confirm which MAP Layers you would like to be updated.
After updating, you can see that new campsites and more detailed contour lines have been added to the map and styled accordingly. With a quick run of the LabelPro tool, the labels for the new campsites have been added and the map is fully updated in just a few minutes!
User interface improvements for databases
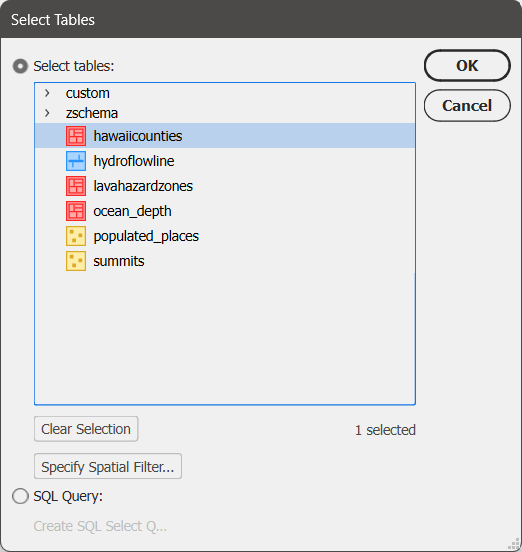
The Import dialog box for database formats now features a few upgrades to the user interface to make the import process clearer. The Select Tables window now has the option to select all or clear your selections at the bottom, and also shows the number of currently selected tables.
To learn more about the Manage Data Links tool, check out its support article.
Compatibility with FME Form 2025
MAPublisher FME Auto is a Windows-only powerful add-on that connects the GIS data processing environment of FME Form to the cartographic design and publishing environment of MAPublisher and Adobe Illustrator. MAPublisher 11.7 is the first version of MAPublisher to provide support for the recent FME Form 2025.0 update.
MAPublisher 11.7 is available now!
If you want to learn more about the new MAPublisher 11.7 features or have any questions, please check out our Support Centre. MAPublisher 11.7 is immediately available today. It is free to all current MAPublisher users with active maintenance subscriptions and available as an upgrade for non-maintenance users.